. 2021 Mar 8;56(5):641-656.e5.
doi: 10.1016/j.devcel.2021.02.007. Epub 2021 Mar 1.

Germ cell differentiation requires Tdrd7-dependent chromatin and transcriptome reprogramming marked by germ plasm relocalization

Affiliations

Germ cell differentiation requires Tdrd7-dependent chromatin and transcriptome reprogramming marked by germ plasm relocalization

Fabio M D'Orazio et al. Dev Cell. .

Abstract

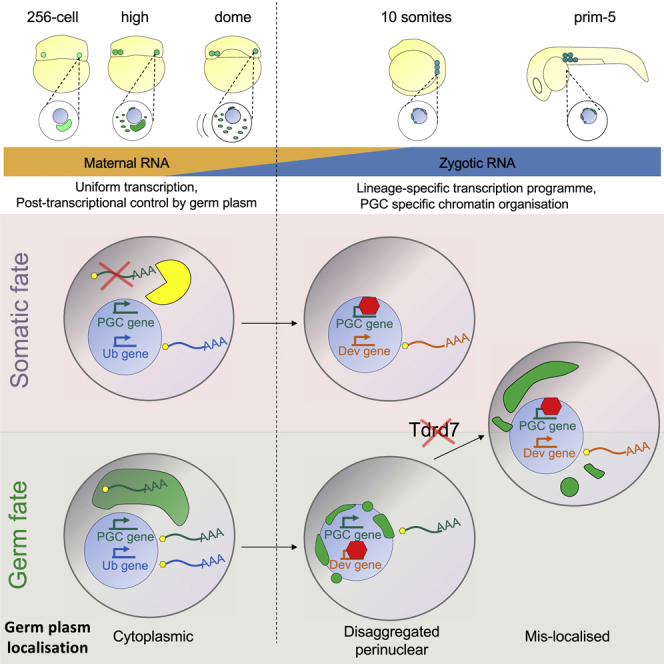
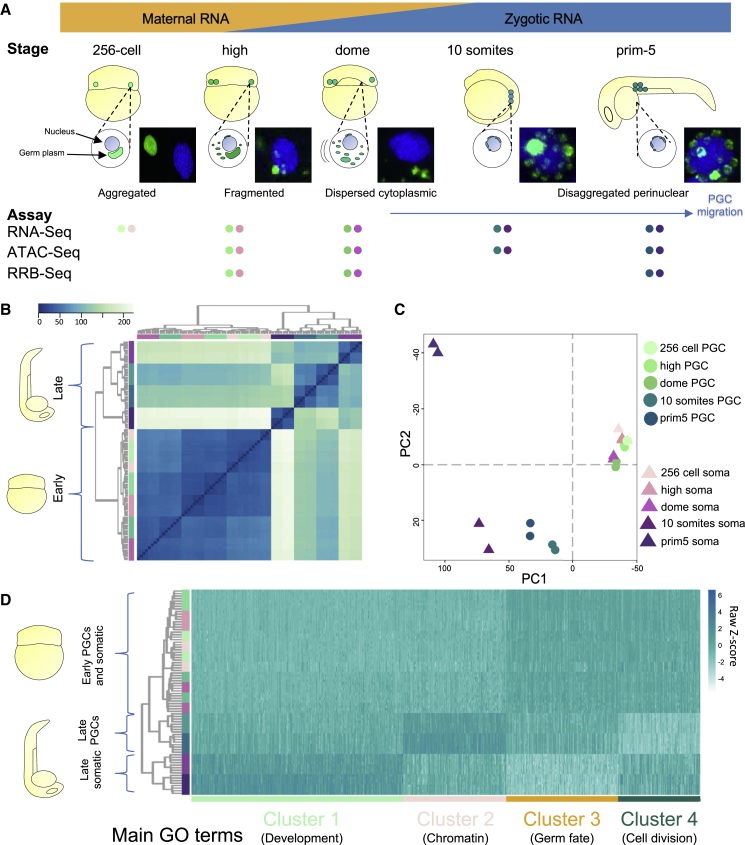
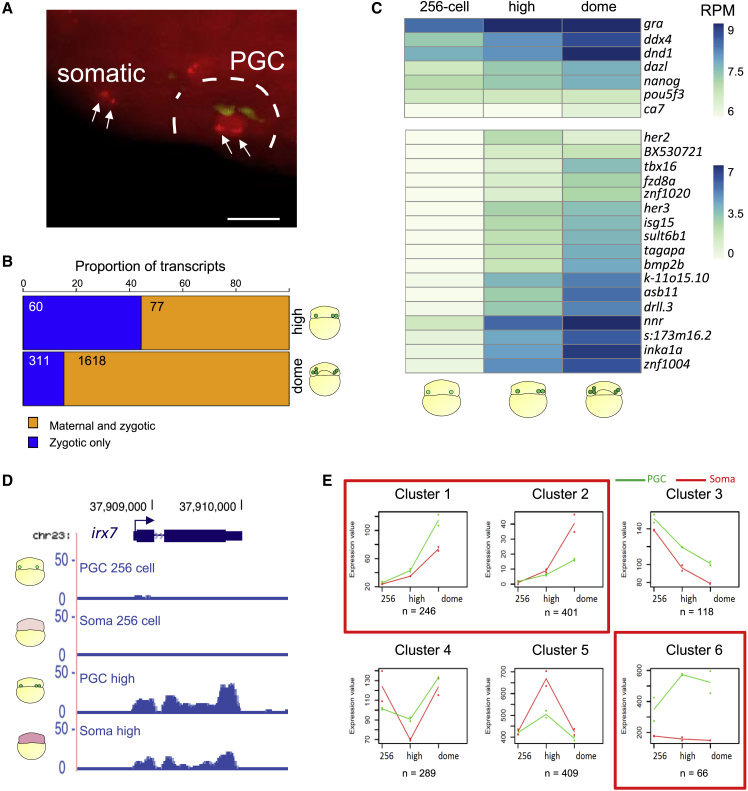
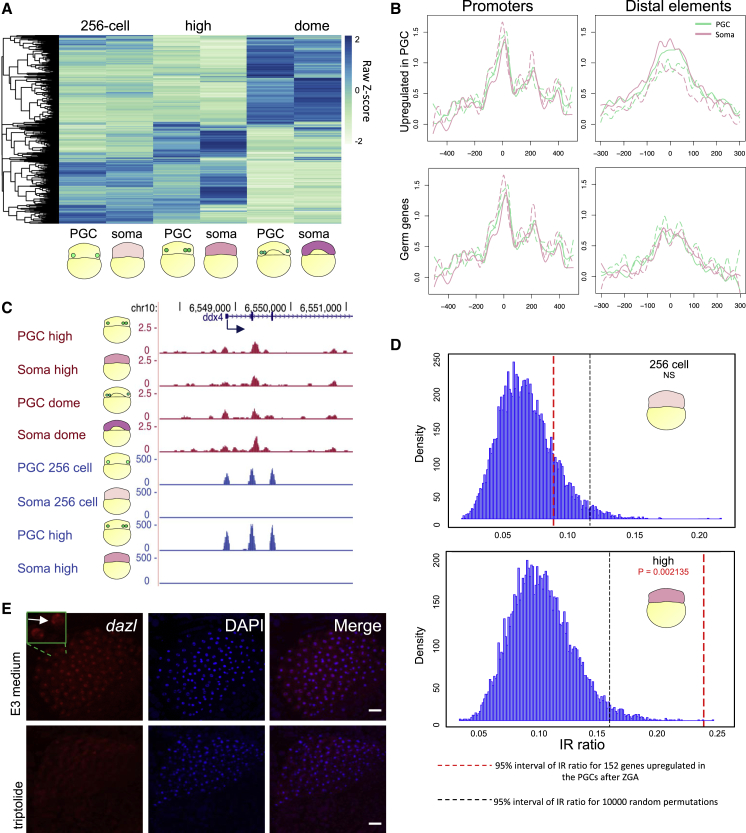
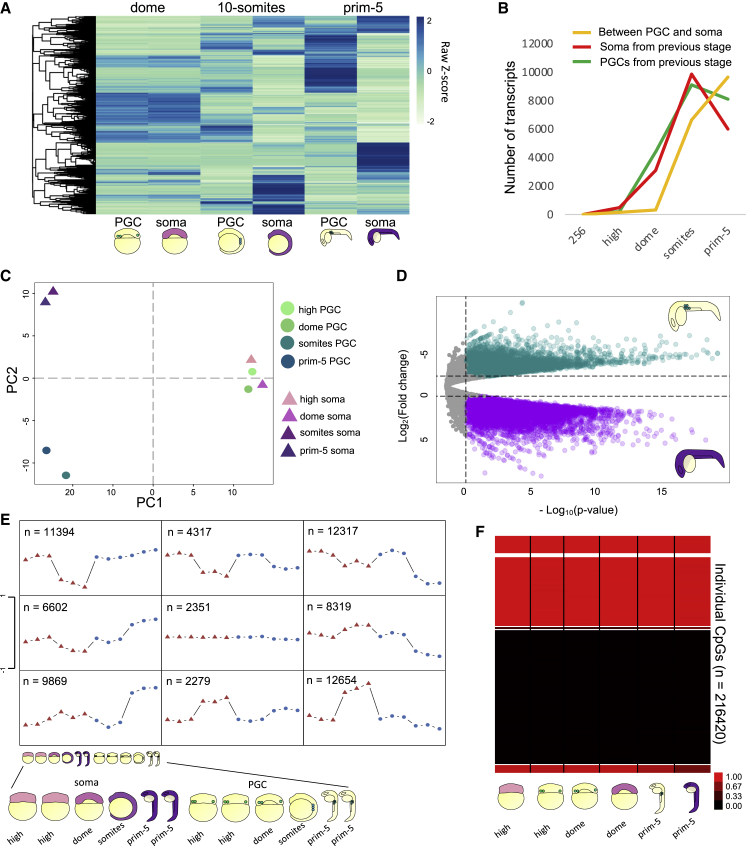
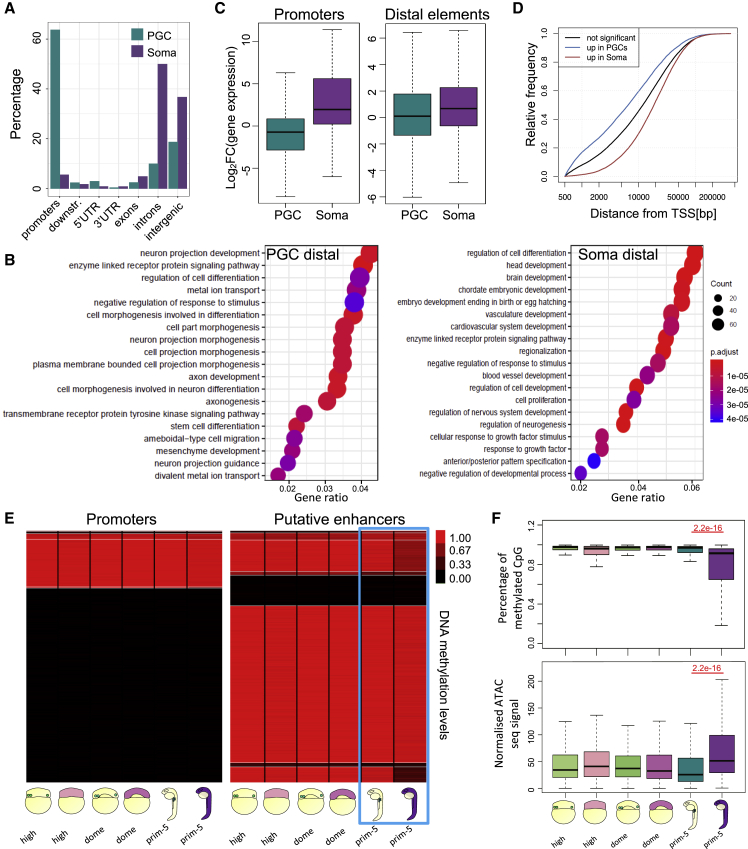
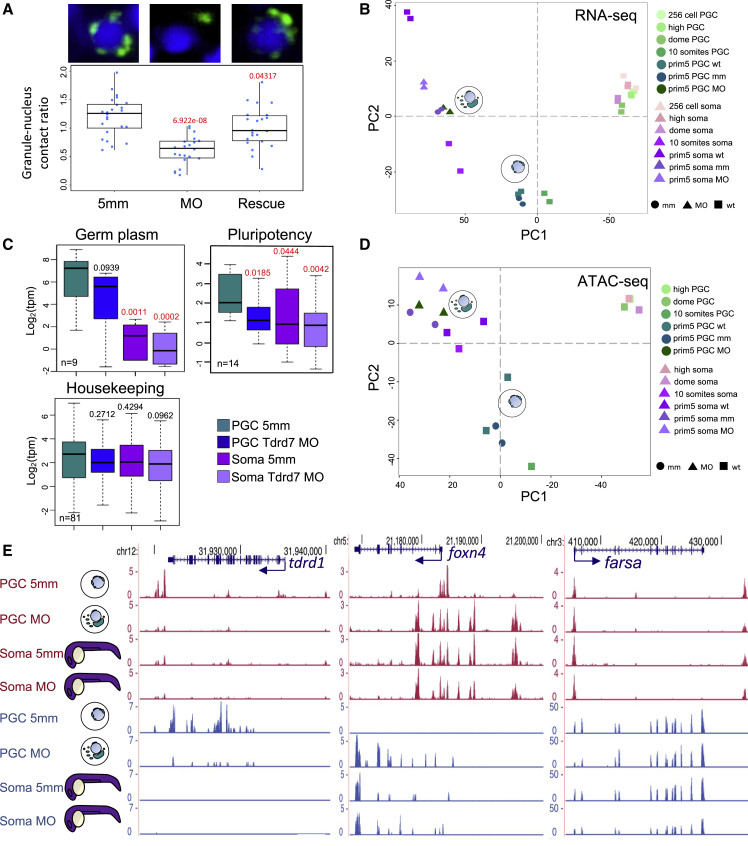
In many animal models, primordial germ cell (PGC) development depends on maternally deposited germ plasm, which prevents somatic cell fate. Here, we show that PGCs respond to regulatory information from the germ plasm in two distinct phases using two distinct mechanisms in zebrafish. We demonstrate that PGCs commence zygotic genome activation together with the somatic blastocysts with no demonstrable differences in transcriptional and chromatin opening. Unexpectedly, both PGC and somatic blastocysts activate germ-cell-specific genes, which are only stabilized in PGCs by cytoplasmic germ plasm determinants. Disaggregated perinuclear relocalization of germ plasm during PGC migration is regulated by the germ plasm determinant Tdrd7 and is coupled to dramatic divergence between PGC and somatic transcriptomes. This transcriptional divergence relies on PGC-specific cis-regulatory elements characterized by promoter-proximal distribution. We show that Tdrd7-dependent reconfiguration of chromatin accessibility is required for elaboration of PGC fate but not for PGC migration.

Keywords: ATAC-seq; DNA methylation; RNA-seq; ZGA; buckyball; chromatin; dazl; germ granules; primordial germ cells; transcription.


Conflict of interest statement

Declaration of interests The authors declare no competing interests.

Figures

None
Graphical abstract
Figure 1
Figure 1
Characterization of PGC transcriptome highlights early developmental similarities and late divergence between PGCs and somatic cells (A) Developmental stages used in the study are shown. Time points were selected according to various phases of germ plasm distribution/PGCs localization. Early stages span ZGA including the first wave at 256-cell stage. Fluorescent images show nuclei in blue (DAPI) and germ plasm in green (Buc-GFP). NGS assays performed for each time point are shown as colored dots; PGCs and somatic cells are in shades of green and purple, respectively. Data provided in biological duplicates unless stated otherwise. (B and C) Unsupervised hierarchical clustering heatmap for Euclidean distance and two-dimensional PCA plot show developmental trends of PGC and somatic cell transcriptomes during development. PGCs and somatic cells are in shades of green and purple, respectively. (D) Groups of differential gene expression reported as normalized transcript heatmap upon k-mean-based clustering over development and cell type.
Figure 2
Figure 2
PGCs do not delay the major wave of transcriptional activation (A) Maximum intensity projection of a multi-stack image showing miR-430 transcription foci (arrows) detected by fluorescently tagged morpholinos (red) in cells marked by germ-plasm-localized GFP-Buc (green) and somatic cells at 512-cell stage. Scale bar, 30 μm. Number of embryos, n = 24. (B) Proportion of zygotic and maternal/zygotic genes upregulated in the germ-plasm-carrying cells at high and dome stages. (C) Expression heatmap of differentially regulated genes in germ-plasm-carrying cells. Scale bar represents scaled RPM. padj < 0.1. (D) Genome browser view of normalized RNA-seq reads for irx7 gene. (E) Clusters of gene expression trends among three developmental stages in PGCs and somatic cells. Median profiles of gene expression values are plotted for each in green (PGCs) and red (somatic cells) and represent the read counts normalized by the DESeq2-calculated size factor. Red squares highlight clusters supporting transcriptional activation in PGCs.
Figure 3
Figure 3
Differential transcriptome between PGCs and somatic cells at early stages is not caused by differential transcription (A) Hierarchical clustering heatmap of differentially expressed genes between PGCs and somatic cells at indicated stages. Scale bar represents scaled RPM. padj < 0.1. (B) Average chromatin accessibility signal at promoters and distal elements of PGC and somatic cells (dashed lines for replicates) for subgroups of genes at high stage. Promoters are aligned to transcription start site, while distal elements are aligned to peak center. (C) Genome browser view of normalized ATAC-seq (magenta) and RNA-seq (blue) reads for PGC and somatic cells at stages spanning ZGA. (D) Density of IR ratio before and after ZGA in the somatic cells for genes upregulated in the PGCs after ZGA. p value is calculated by t test. Statistical significance was calculated upon 10,000 random permutation whose density is shown before and after ZGA. Black and red dashed lines show 95% significance interval for the 10,000 permutations and the gene subgroup, respectively. NS, not significant. (E) In situ hybridization for dazl pre-mRNA at high stage. Scale bar, 50 μm. Number of embryos, n = 7.
Figure 4
Figure 4
Gradual acquisition of germ identity is accompanied by epigenetic changes (A) Hierarchical clustering heatmap of differentially expressed genes between PGCs and somatic cells at dome, 10-somites and prim-5 stages. Scale bar represents scaled RPM. padj < 0.1. (B) Line-chart for gene counts. Upregulated genes from previous stage are in red (somatic) or green (PGCs). The orange line shows number of genes differentially expressed between PGCs and somatic cells at each stage. (C) Two-dimensional PCA plot of ATAC-seq profiles. (D) Volcano plot for regions of open chromatin between PGCs and somatic cells at prim-5 stage (log2FC threshold = ±1, padj < 0.05). (E) Self-organizing map of open chromatin regions. PGCs and somatic cells are shown as blue circles and red triangles, respectively. Schematic of embryos as in Figures 1A and 1B. (F) Methylation status of identified CpGs in PGCs and somatic cells at indicated stages.
Figure 5
Figure 5
PGCs do not open chromatin at regions identified as putative enhancers (A) Percentage of differentially accessible ATAC peaks in PGCs and somatic cells at prim-5 stage overlapping with gene features. Promoter regions include 1 kb up- and downstream of the TSS. (B) Developmental processes GO analysis for genes associated with differentially accessible putative enhancers in PGCs and somatic cells. (C) Fold change of gene expression for genes associated with ATAC peaks upregulated in PGCs or somatic cells. Fold changes represent gene upregulation in PGCs and somatic cells, respectively. (D) Cumulative frequency of open chromatin elements in relation to distance from the closest TSS. padj < 0.05. Colors indicate elements near differentially expressed genes as indicated. (E) Heatmap of average DNA methylation levels at promoters (left) and H3K4me1/H3K27ac-rich genomic sites (putative enhancers) in PGCs and somatic cells at high, dome, and prim-5 stages. Blue box highlights prim-5 stage. (F) Quantification of methylated CpGs and chromatin accessibility at putative enhancer regions. p value in red was calculated by Wilcoxon test. Outliers are omitted.
Figure 6
Figure 6
Tdrd7 is required for maintaining PGC fate (A) Light-sheet images and phenotypic quantification of tdrd7 KD in PGCs at prim-5 stage. Germ granule-nucleus contact ratio is calculated by contact length between each granule and nucleus divided by total granule surface area in a cell and shown as a single dot. Dot columns represent data from embryos (n = 6). Significance of p values against control is shown in red (p < 0.05, Wilcoxon test). (B) Global transcriptional variance shown as PCA plot for wild-type and MO-injected PGCs and somatic cells. (C) Boxplots reporting normalized transcript levels (tpm) for gene subsets in MO-injected PGCs and somatic cells. p values against control is shown. Red color indicates significance (p < 0.05, Wilcoxon test). Outliers are omitted. (D) PCA analysis based on ATAC-seq peaks shows PGCs diverging toward somatic-like chromatin state. (E) Genome browser view of ATAC-seq profiles after morpholino injections. Open chromatin (ATAC-seq) is shown in magenta and transcript levels (RNA-seq) are shown in blue. Arrows show transcription direction of genes indicated in blue.

Similar articles

Cited by

References

    1. Andrey G., Mundlos S. The three-dimensional genome: regulating gene expression during pluripotency and development. Development. 2017;144:3646–3658. - PubMed
    1. Batchelder C., Dunn M.A., Choy B., Suh Y., Cassie C., Shim E.Y., Shin T.H., Mello C., Seydoux G., Blackwell T.K. Transcriptional repression by the Caenorhabditis elegans germ-line protein PIE-1. Genes Dev. 1999;13:202–212. - PMC - PubMed
    1. Bender L.B., Cao R., Zhang Y., Strome S. The MES-2/MES-3/MES-6 complex and regulation of histone H3 methylation in C. elegans. Curr. Biol. 2004;14:1639–1643. - PubMed
    1. Blaser H., Eisenbeiss S., Neumann M., Reichman-Fried M., Thisse B., Thisse C., Raz E. Transition from non-motile behaviour to directed migration during early PGC development in zebrafish. J. Cell Sci. 2005;118:4027–4038. - PubMed
    1. Bogdanovic O., Fernandez-Miñán A., Tena J.J., de la Calle-Mustienes E., Hidalgo C., van Kruysbergen I., van Heeringen S.J., Veenstra G.J., Gómez-Skarmeta J.L. Dynamics of enhancer chromatin signatures mark the transition from pluripotency to cell specification during embryogenesis. Genome Res. 2012;22:2043–2053. - PMC - PubMed

Publication types

LinkOut - more resources