. 2021 Mar 8;56(5):627-640.e5.
doi: 10.1016/j.devcel.2021.02.006. Epub 2021 Mar 1.

Excessive R-loops trigger an inflammatory cascade leading to increased HSPC production

Affiliations

Excessive R-loops trigger an inflammatory cascade leading to increased HSPC production

Joshua T Weinreb et al. Dev Cell. .

Abstract

Hematopoietic stem and progenitor cells (HSPCs) arise during embryonic development and are essential for sustaining the blood and immune systems throughout life. Tight regulation of HSPC numbers is critical for hematopoietic homeostasis. Here, we identified DEAD-box helicase 41 (Ddx41) as a gatekeeper of HSPC production. Using zebrafish ddx41 mutants, we unveiled a critical role for this helicase in regulating HSPC production at the endothelial-to-hematopoietic transition. We determined that Ddx41 suppresses the accumulation of R-loops, nucleic acid structures consisting of RNA:DNA hybrids and ssDNAs whose equilibrium is essential for cellular fitness. Excess R-loop levels in ddx41 mutants triggered the cGAS-STING inflammatory pathway leading to increased numbers of hemogenic endothelium and HSPCs. Elevated R-loop accumulation and inflammatory signaling were observed in human cells with decreased DDX41, suggesting possible conservation of mechanism. These findings delineate that precise regulation of R-loop levels during development is critical for limiting cGAS-STING activity and HSPC numbers.

Keywords: Ddx41; R-loops; hematopoietic stem and progenitor cell; inflammatory signaling; zebrafish.


Conflict of interest statement

Declaration of interests The authors declare no competing interests.

Figures
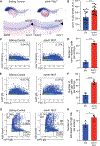
Figure 1.
Figure 1.. Ddx41 regulates HSPC number
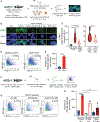
(A) In situ hybridization of the HSPC marker runx1 at 40 hpf in sibling controls (left) and ddx41 mutants (right). Numbers on bottom left corner indicate the fraction of embryos with the same phenotype as the one depicted in the image. Inset underneath shows a higher magnification (83) view of the boxed AGM region above. The aorta is marked with arrowheads. (B) Quantification of runx1 in situ hybridization levels from (A). Quantification was done using Fiji. a.u., arbitrary unit. (C and E) Flow cytometry plots of runx1:mcherry+ (C) and cd41:gfp+ (E) HSPCs from sibling controls (left) and ddx41 mutants (right) at 40 hpf. (D and F) Graphs depicting the absolute number of runx1:mcherry+ (D) and cd41:gfp+ (F) per embryo at 40 hpf. (G) Flow cytometry plots of kdrl:dsred+, cd41:gfp+, and kdrl:dsred+; cd41:gfp+ double positive cells from sibling controls (left) and ddx41 mutants (right) at 40 hpf. (H) Graphs depicting the absolute number of kdrl:dsred+; cd41:gfp+ double positive hemogenic endothelial cells per embryo at 40 hpf. Graphs display means ± standard deviations (stds) with p values calculated with unpaired Student’s t test, *p < 0.05, ***p < 0.001, ****p < 0.0001. N = 3–5 replicates per experiment.
Figure 2.
Figure 2.. Ddx41 constraint of R-loop levels is critical for HSPC homeostasis
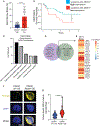
(A) Schematic of the RNASEH1 overexpression experiments. (B) Confocal images showing immunofluorescence of R-loops and nuclei (DAPI) in cells isolated from 28 hpf siblings (left) and ddx41 mutants (right) that are either Tg(hsp70:M27RNASEH1-GFP) negative (left) or Tg(hsp70:M27RNASEH1-GFP) positive (right). Scale bar, 5 μm. (C) Quantification of R-loop levels from (B). (D) Flow cytometry plots of runx1:mcherry+ HSPCs from Tg(hsp70:M27RNASEH1-GFP)-negative (left) and Tg(hsp70:M27RNASEH1-GFP)-positive (right) ddx41 mutants at 40 hpf. (E) Graph depicting the number of runx1:mcherry+ HSPCs per embryo from (D). (F) In situ hybridization of the HSPC marker runx1 at 40 hpf in Tg(hsp70:M27RNASEH1-GFP)-negative ddx41 mutants (left) and Tg(hsp70:M27RNASEH1-GFP)-positive ddx41 mutants (right). Numbers on bottom left corner indicate the fraction of embryos with the same phenotype as the one depicted in the image. A higher magnification view of the AGM region is displayed. The aorta is marked with arrowheads. (G) Quantification of runx1 in situ hybridization levels from (F). Quantification was done using Fiji. a.u., arbitrary unit. (H) Flow cytometry plots of runx1:mcherry+ HSPCs ddx41 mutants injected with ubi:gfp (left, control) and fli1:M27RNASEH1-GFP (right) at 40 hpf. (I) Graph depicting the number of runx1:mcherry+ HSPCs per embryo from (H). Graphs display means ± stds with p values calculated with a one-way ANOVA with Tukey’s multiple testing correction (C and E) or unpaired Student’s t test (G and I), *p < 0.05, **p < 0.01, ***p < 0.001, ****p < 0.0001, ns, not significant (p > 0.05). N = 3–6 replicates per experiment.
Figure 3.
Figure 3.. R-loops promote inflammatory gene expression in ddx41 mutants
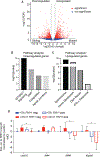
(A) Volcano plot displaying differentially expressed genes between cd41:gfp+ HSPCs from ddx41 mutants and siblings. Significant differences are defined as FDR < 0.05 and log2 fold change >1. Black vertical lines denote the fold-change threshold and the black horizontal line denotes the FDR threshold. Three biological replicates for both ddx41 mutants and siblings were used to generate RNA-sequencing data. (B and C) Representative charts of pathways significantly enriched in genes downregulated (B) or upregulated (C) in ddx41 mutant HSPCs compared with sibling controls as determined by MSigDB analysis. (D) Graph of RT-qPCR analysis of the expression of type I IFN-responsive genes between sibling controls and ddx41 mutants that are Tg(hsp70:M27RNASEH1-GFP)-negative versus Tg(hsp70:M27RNASEH1-GFP)-positive. Expression levels were normalized to β-actin levels. All levels are relative to the RNASEH1-GFP (RNH1) negative sibling controls expressed as ddCt values, with positive values reflecting higher expression and negative values reflecting lower expression. Graph displays means ± standard error ean with p values calculated with an unpaired t test, *p < 0.05. N = 4 replicates per experiment.
Figure 4.
Figure 4.. Ddx41 regulates inflammatory signaling via the cGAS-STING pathway
(A) Schematic of the Ser172-phosphorylated TBK1 (pTBK1) immunofluorescence experiments. (B) Confocal images showing immunofluorescence of pTBK1 and nuclei (DAPI) in cells isolated from 40 hpf siblings, ddx41 mutants (control), ddx41 mutants injected with cGAS translation-blocking (ATG) MO, RNH1-negative ddx41 mutants and RNH1-positive ddx41 mutants. Scale bar, 5 μm. (C) Quantification of pTBK1 levels from (B). (D) Flow cytometry plots of NFκB:gfp+ cells from sibling controls (left) and ddx41 mutants (right) at 40 hpf. (E) Graph depicting the absolute number of NFκB:gfp-high cells per embryo shown in (D). (F) Schematic of the cGAS-STING pathway knockdown experiments with NFκB:gfp quantification. (G) Flow cytometry plots of NFκB:gfp+ cells from ddx41 mutants injected with control morpholino (left), splice-blocking sting morpholino (middle), or cgas ATG morpholino (right) at 40 hpf. (H) Graph depicting the absolute number of NFκB:gfp-high cells per embryo shown in (G). Graphs display means ± stds with p values calculated with unpaired Student’s t test (E) or a one-way ANOVA with Tukey’s multiple testing correction (C and H), *p < 0.05, ***p < 0.001, ****p < 0.0001. N = 3–5 replicates per experiment.
Figure 5.
Figure 5.. Ddx41 regulates HSPC number via the cGAS-STING inflammatory pathway
(A) Schematic of the cGAS-STING pathway knockdown experiments with HSPC quantification. (B) Flow cytometry plots of cd41:gfp+ HSPCs from ddx41 mutants injected with control morpholino (left), splice-blocking sting morpholino (middle), or translation-blocking (ATG) cgas morpholino (right) at 40 hpf. (C) Graph depicting the absolute number of cd41:gfp+ cells per embryo shown in (B). (D) Schematic of the STING knockdown and RNASEH1 overexpression experiment with HSPC quantification. (E) Flow cytometry plots of runx1:mcherry+ HSPCs from Tg(hsp70:M27RNASEH1-GFP)-negative (top left) and Tg(hsp70:M27RNASEH1-GFP)-positive (top right) uninjected ddx41 mutants versus Tg(hsp70:M27RNASEH1-GFP)-negative (bottom left) and Tg(hsp70:M27RNASEH1-GFP)-positive (bottom right) STING morpholino-injected ddx41 mutants at 40 hpf. (F) Graph depicting the number of runx1:mcherry+ HSPCs per embryo from (E). Graphs display means ± stds with p values calculated with a one-way ANOVA with Tukey’s multiple testing correction, **p < 0.01, ***p < 0.001, ****p < 0.0001, ns, not significant (p > 0.05). N = 3–6 replicates per experiment.
Figure 6.
Figure 6.. Conserved properties in DDX41 low and mutated human cells
(A) Graph depicting bone marrow blast percentages of MDS patients with high (top 20%) or low (bottom 20%) DDX41 expression. (B) Kaplan-Meier survival curve comparing MDS patients with high or low DDX41 expression. (C) Representative charts of REACTOME pathways significantly enriched in DDX41 low patients’ CD34+ HSPCs compared with DDX41 high patients’ CD34+ HSPCs. (D) Venn diagram showing overlap between genes that were highly expressed in DDX41 low MDS samples and within the “Innate immune system” pathway and assessed for how their expression correlated with blast counts in the cohort of 183 MDS patients in (E). (E) Heatmap correlating clinical hematological variables with the genes in the REACTOME “innate immune signature” pathway from DDX41 low patients’ CD34+ HSPCs (D). Each cell represents the correlation between the 183 values of the clinical variable (column), and the 183 values of the gene probe (row) matched by patient. (F) Confocal images showing immunofluorescence of R-loops and nuclei (DAPI) in HEK-293 cells that are overexpressing DDX41 wildtype (left) or a DDX41 R525H mutant (right). Scale bar, 10 μm. (G) Quantification of R-loop levels from (F). Graphs display means ± stds with p values calculated with unpaired Student’s t test, *p < 0.05, ****p < 0.0001.

Comment in

References

    1. Ablasser A, Schmid-Burgk JL, Hemmerling I, Horvath GL, Schmidt T, Latz E, and Hornung V (2013). Cell intrinsic immunity spreads to bystander cells via the intercellular transfer of cGAMP. Nature 503, 530–534. - PMC - PubMed
    1. Bai J, Cervantes C, Liu J, He S, Zhou H, Zhang B, Cai H, Yin D, Hu D, Li Z, et al. (2017). DsbA-L prevents obesity-induced inflammation and insulin resistance by suppressing the mtDNA release-activated cGAS-cGAMP-STING pathway. Proc. Natl. Acad. Sci. USA 114, 12196–12201. - PMC - PubMed
    1. Bertrand JY, Chi NC, Santoso B, Teng S, Stainier DY, and Traver D (2010). Haematopoietic stem cells derive directly from aortic endothelium during development. Nature 464, 108–111. - PMC - PubMed
    1. Boguslawski SJ, Smith DE, Michalak MA, Mickelson KE, Yehle CO, Patterson WL, and Carrico RJ (1986). Characterization of monoclonal antibody to DNA.RNA and its application to immunodetection of hybrids. J. Immunol. Methods 89, 123–130. - PubMed
    1. Boisset JC, van Cappellen W, Andrieu-Soler C, Galjart N, Dzierzak E, and Robin C (2010). In vivo imaging of haematopoietic cells emerging from the mouse aortic endothelium. Nature 464, 116–120. - PubMed

Publication types

MeSH terms