. 2021 Jun 1;33(6):1248-1263.e9.
doi: 10.1016/j.cmet.2021.02.005. Epub 2021 Mar 1.

CRISPR screens in physiologic medium reveal conditionally essential genes in human cells

Affiliations

CRISPR screens in physiologic medium reveal conditionally essential genes in human cells

Nicholas J Rossiter et al. Cell Metab. .

Abstract

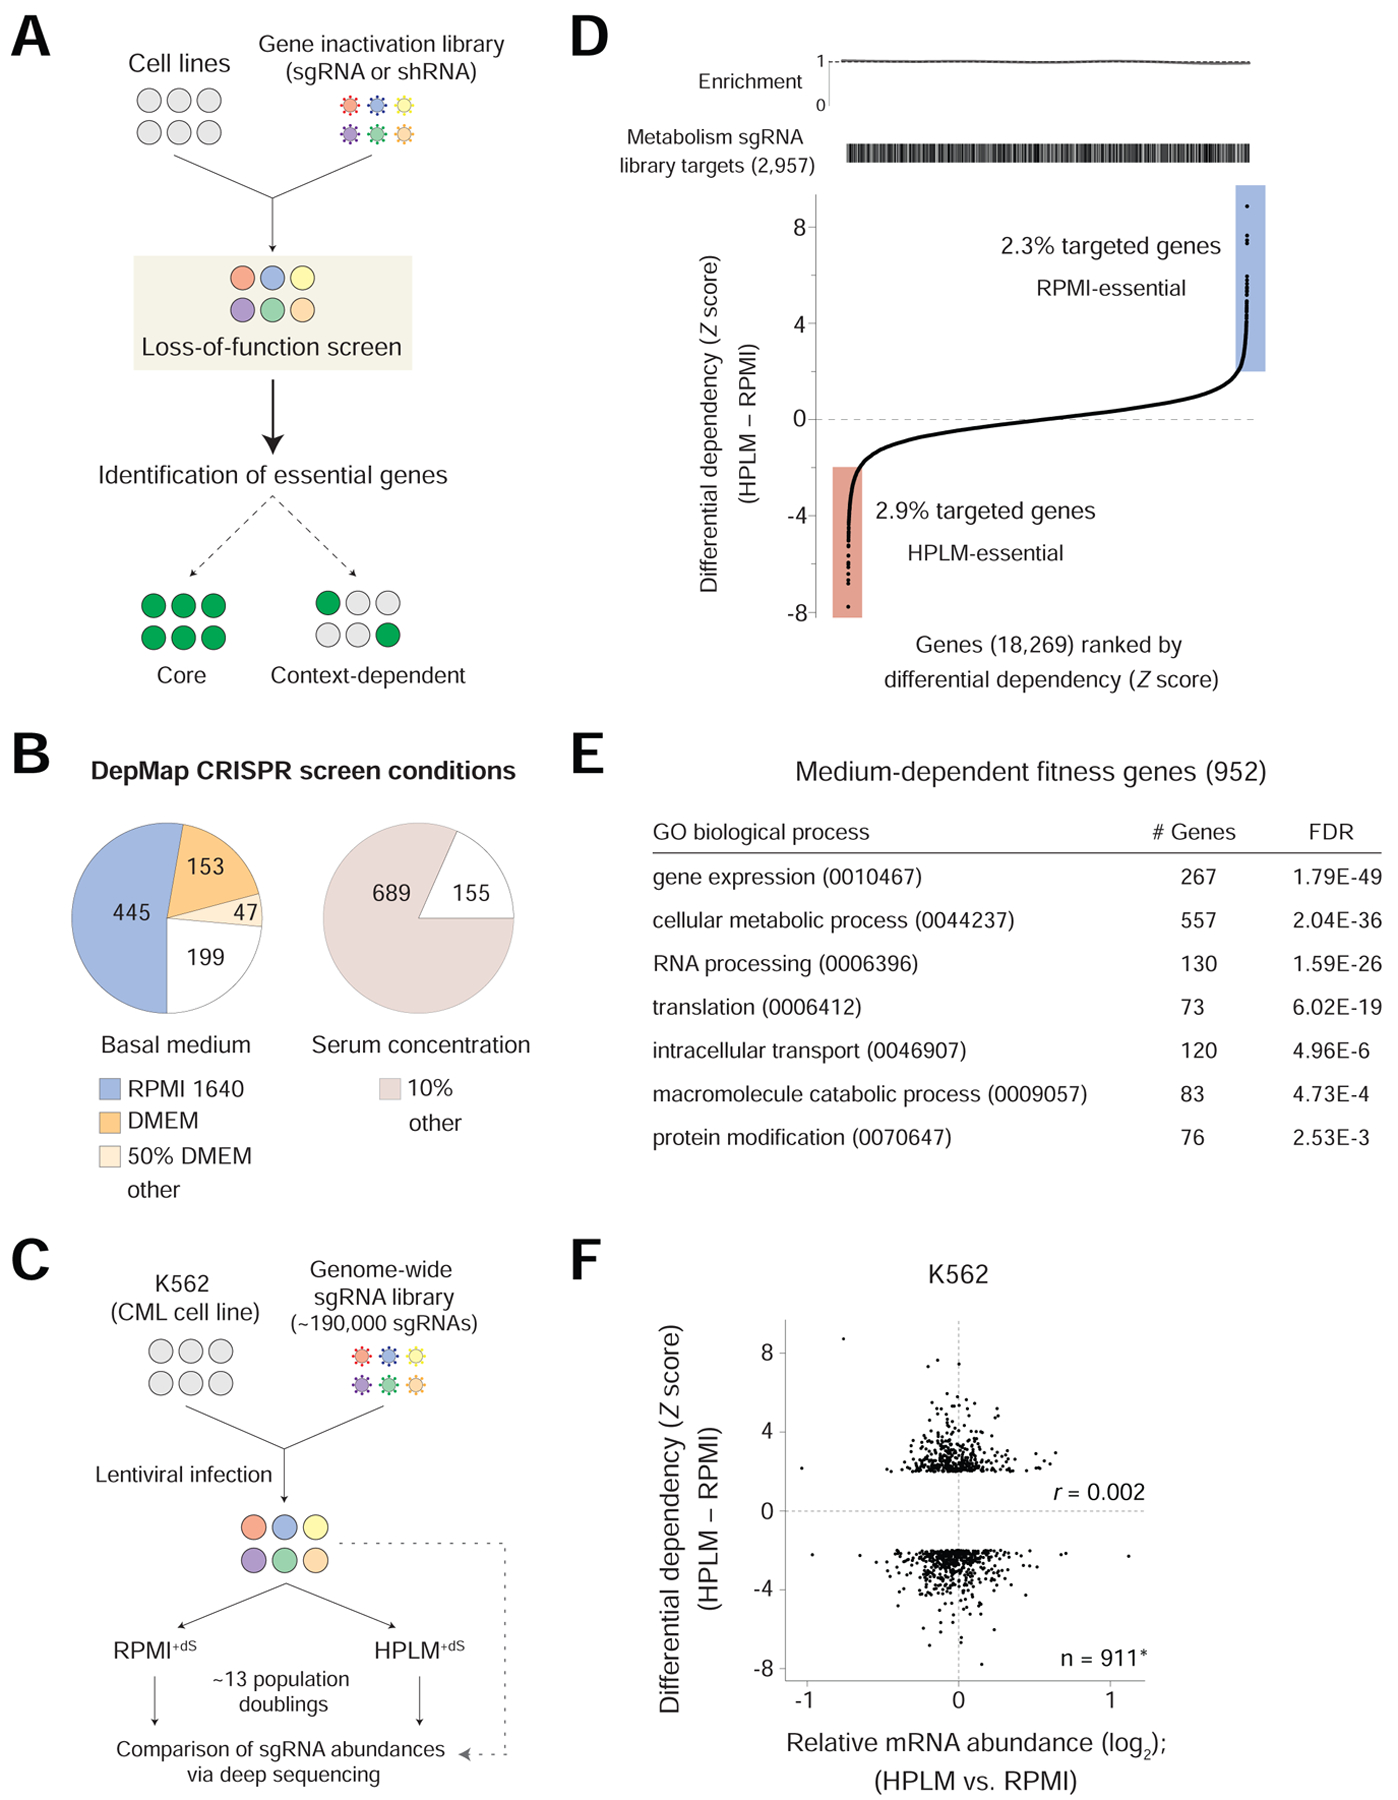
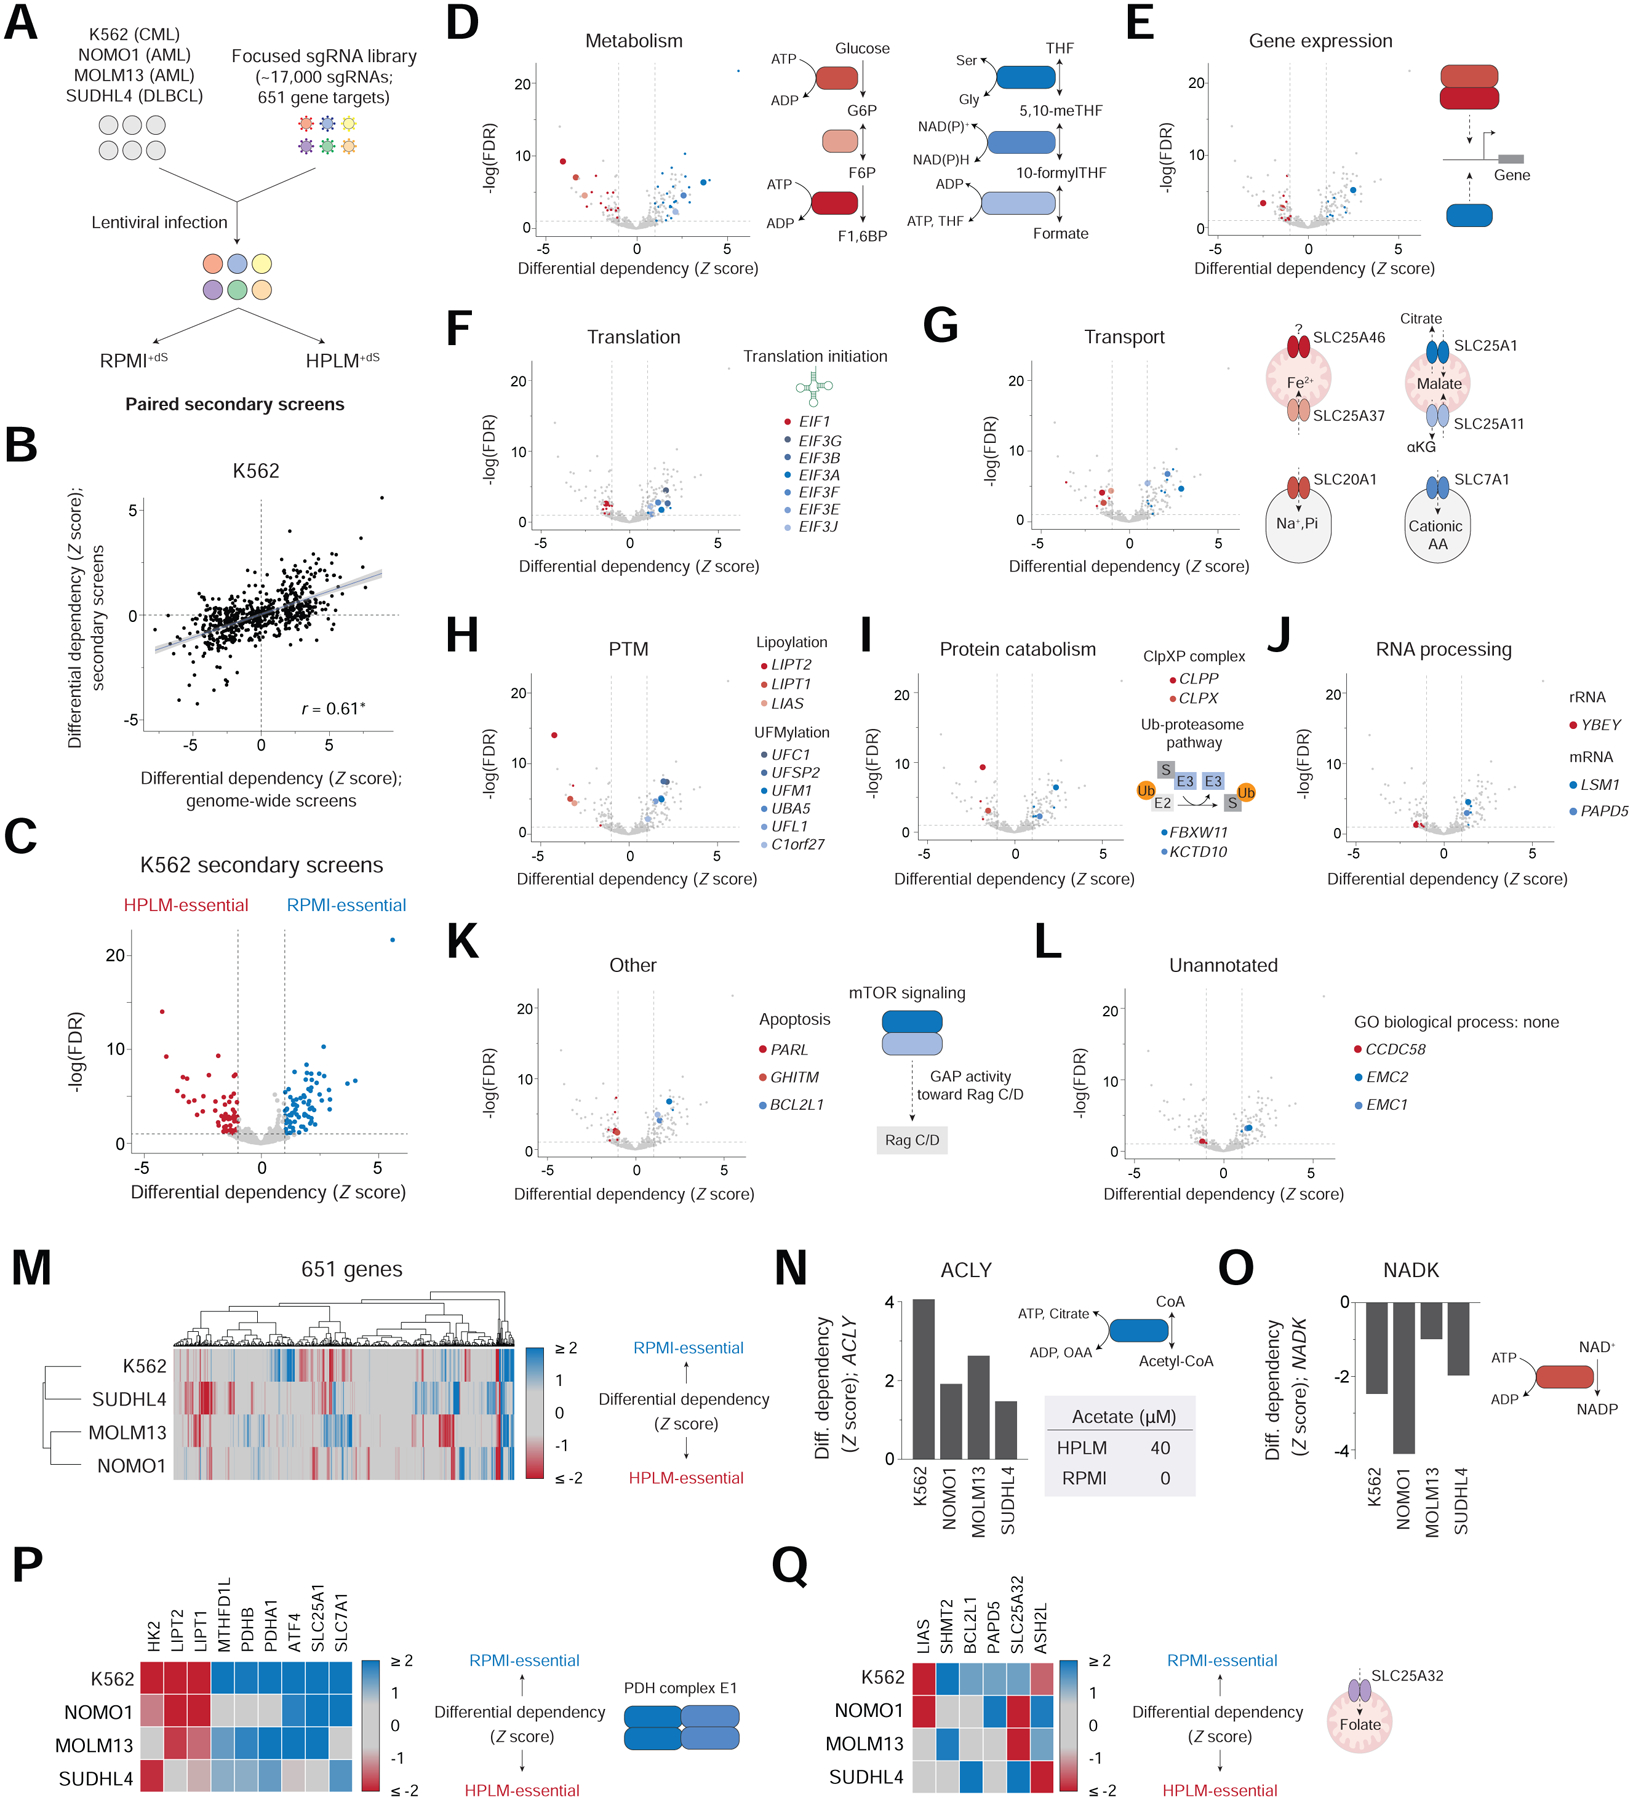
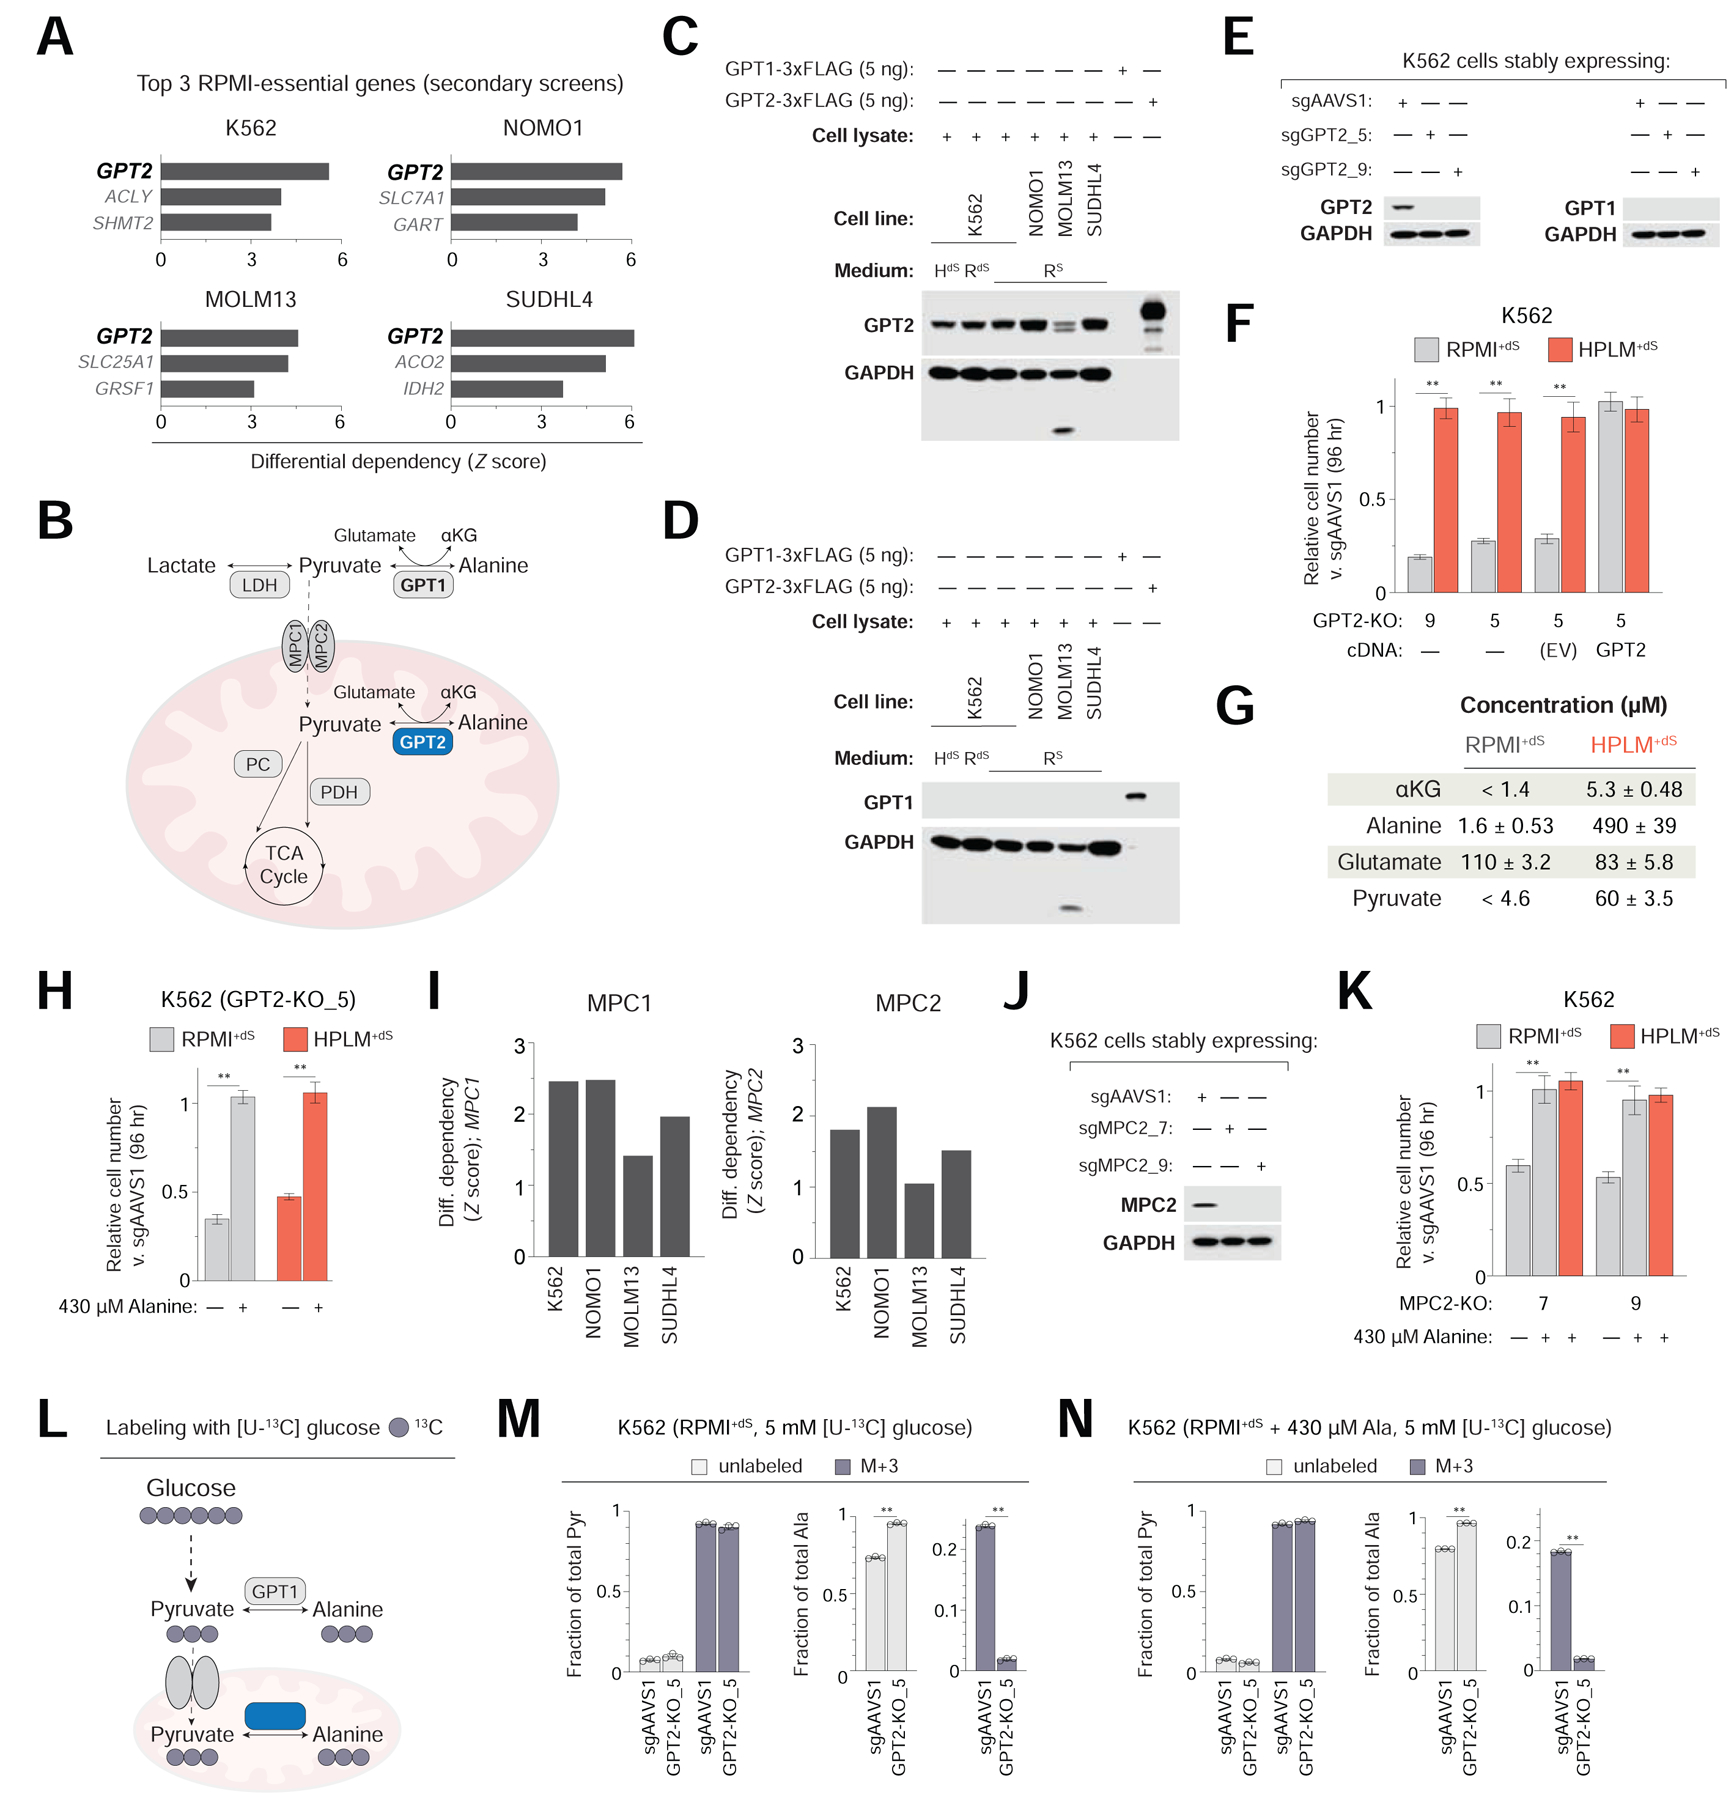
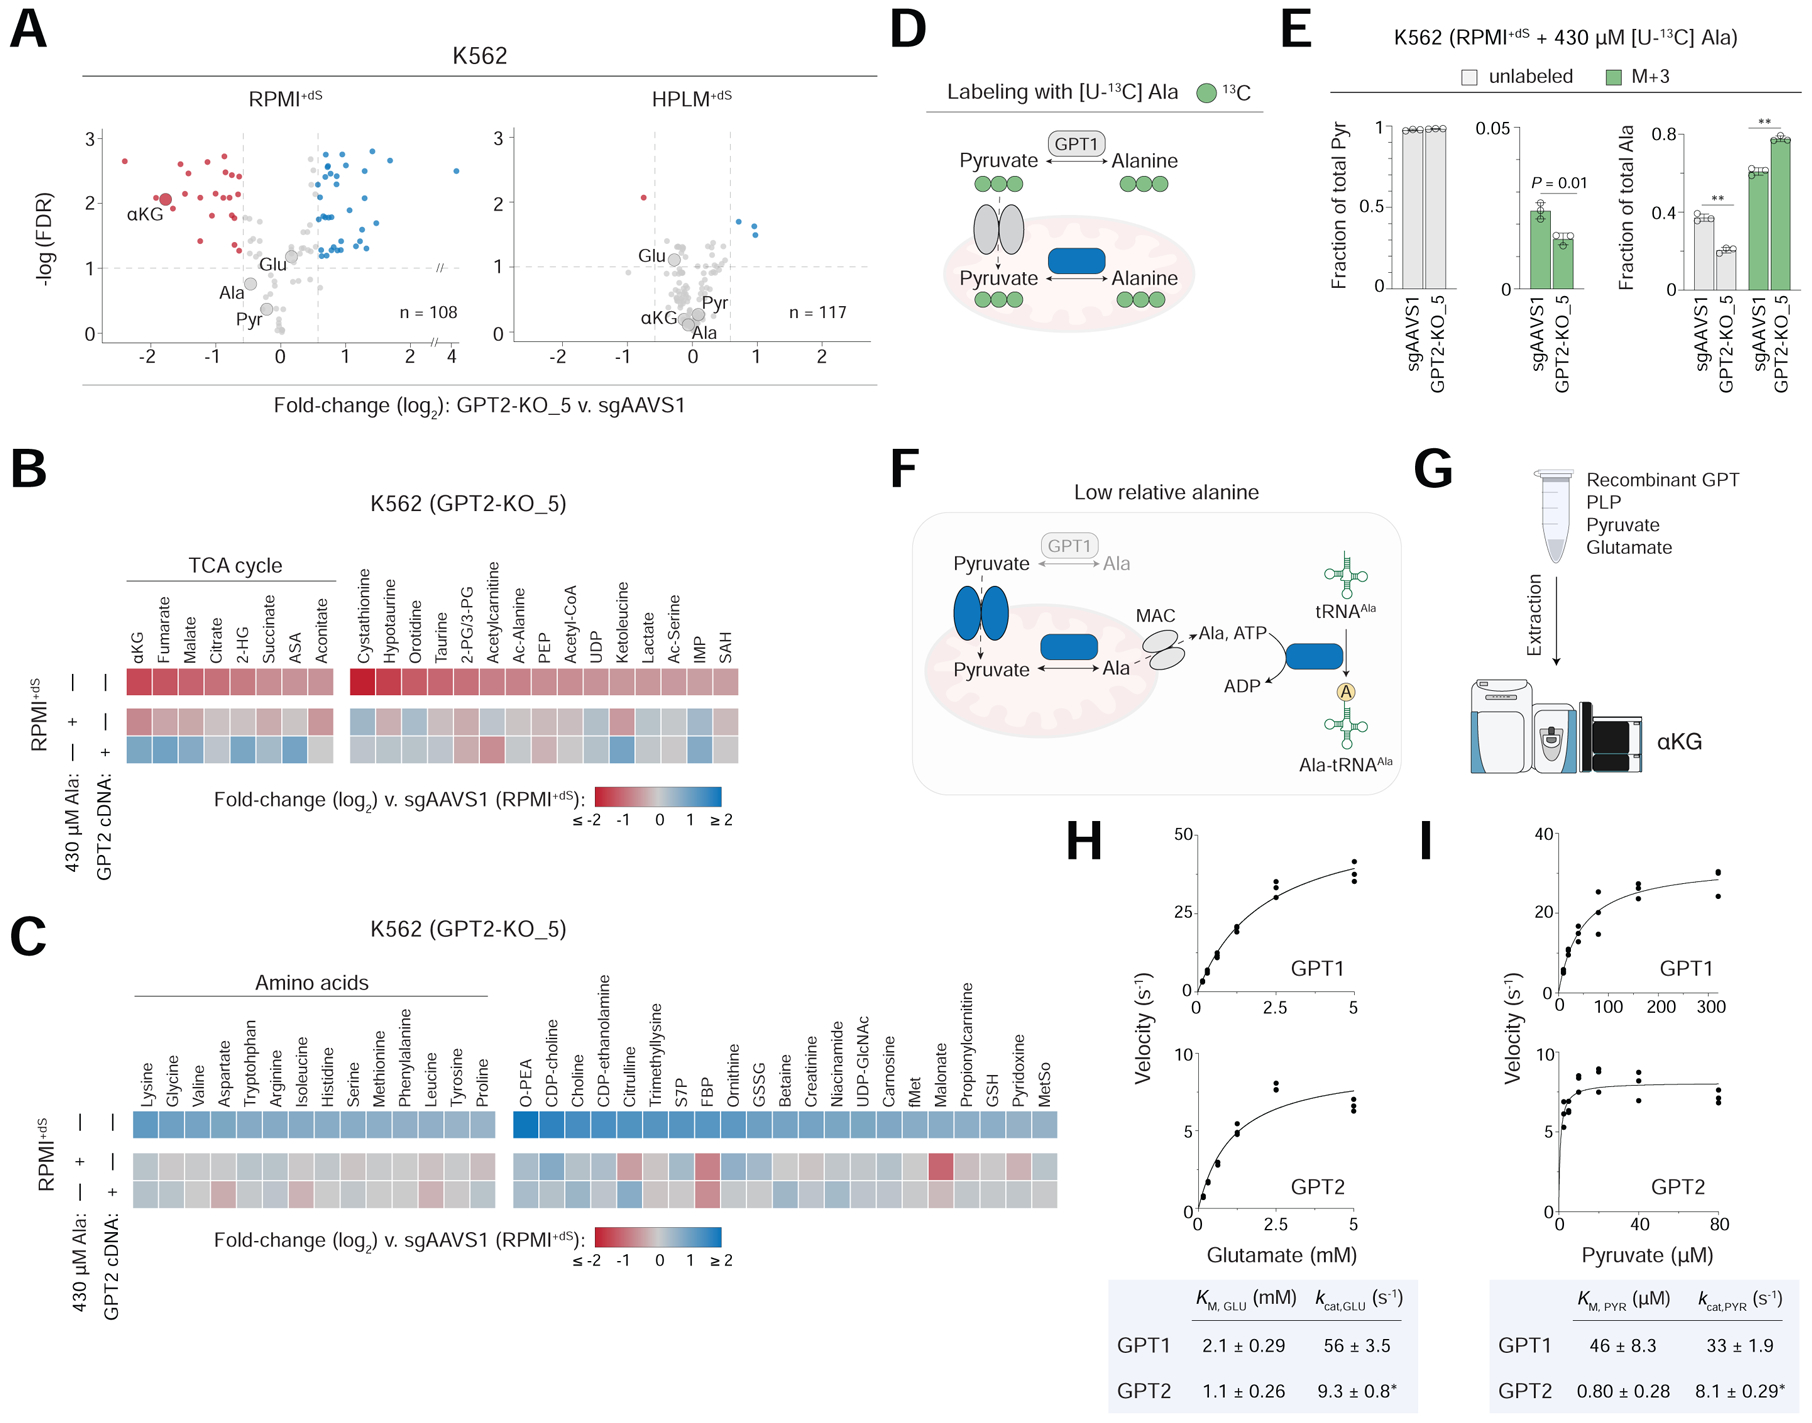
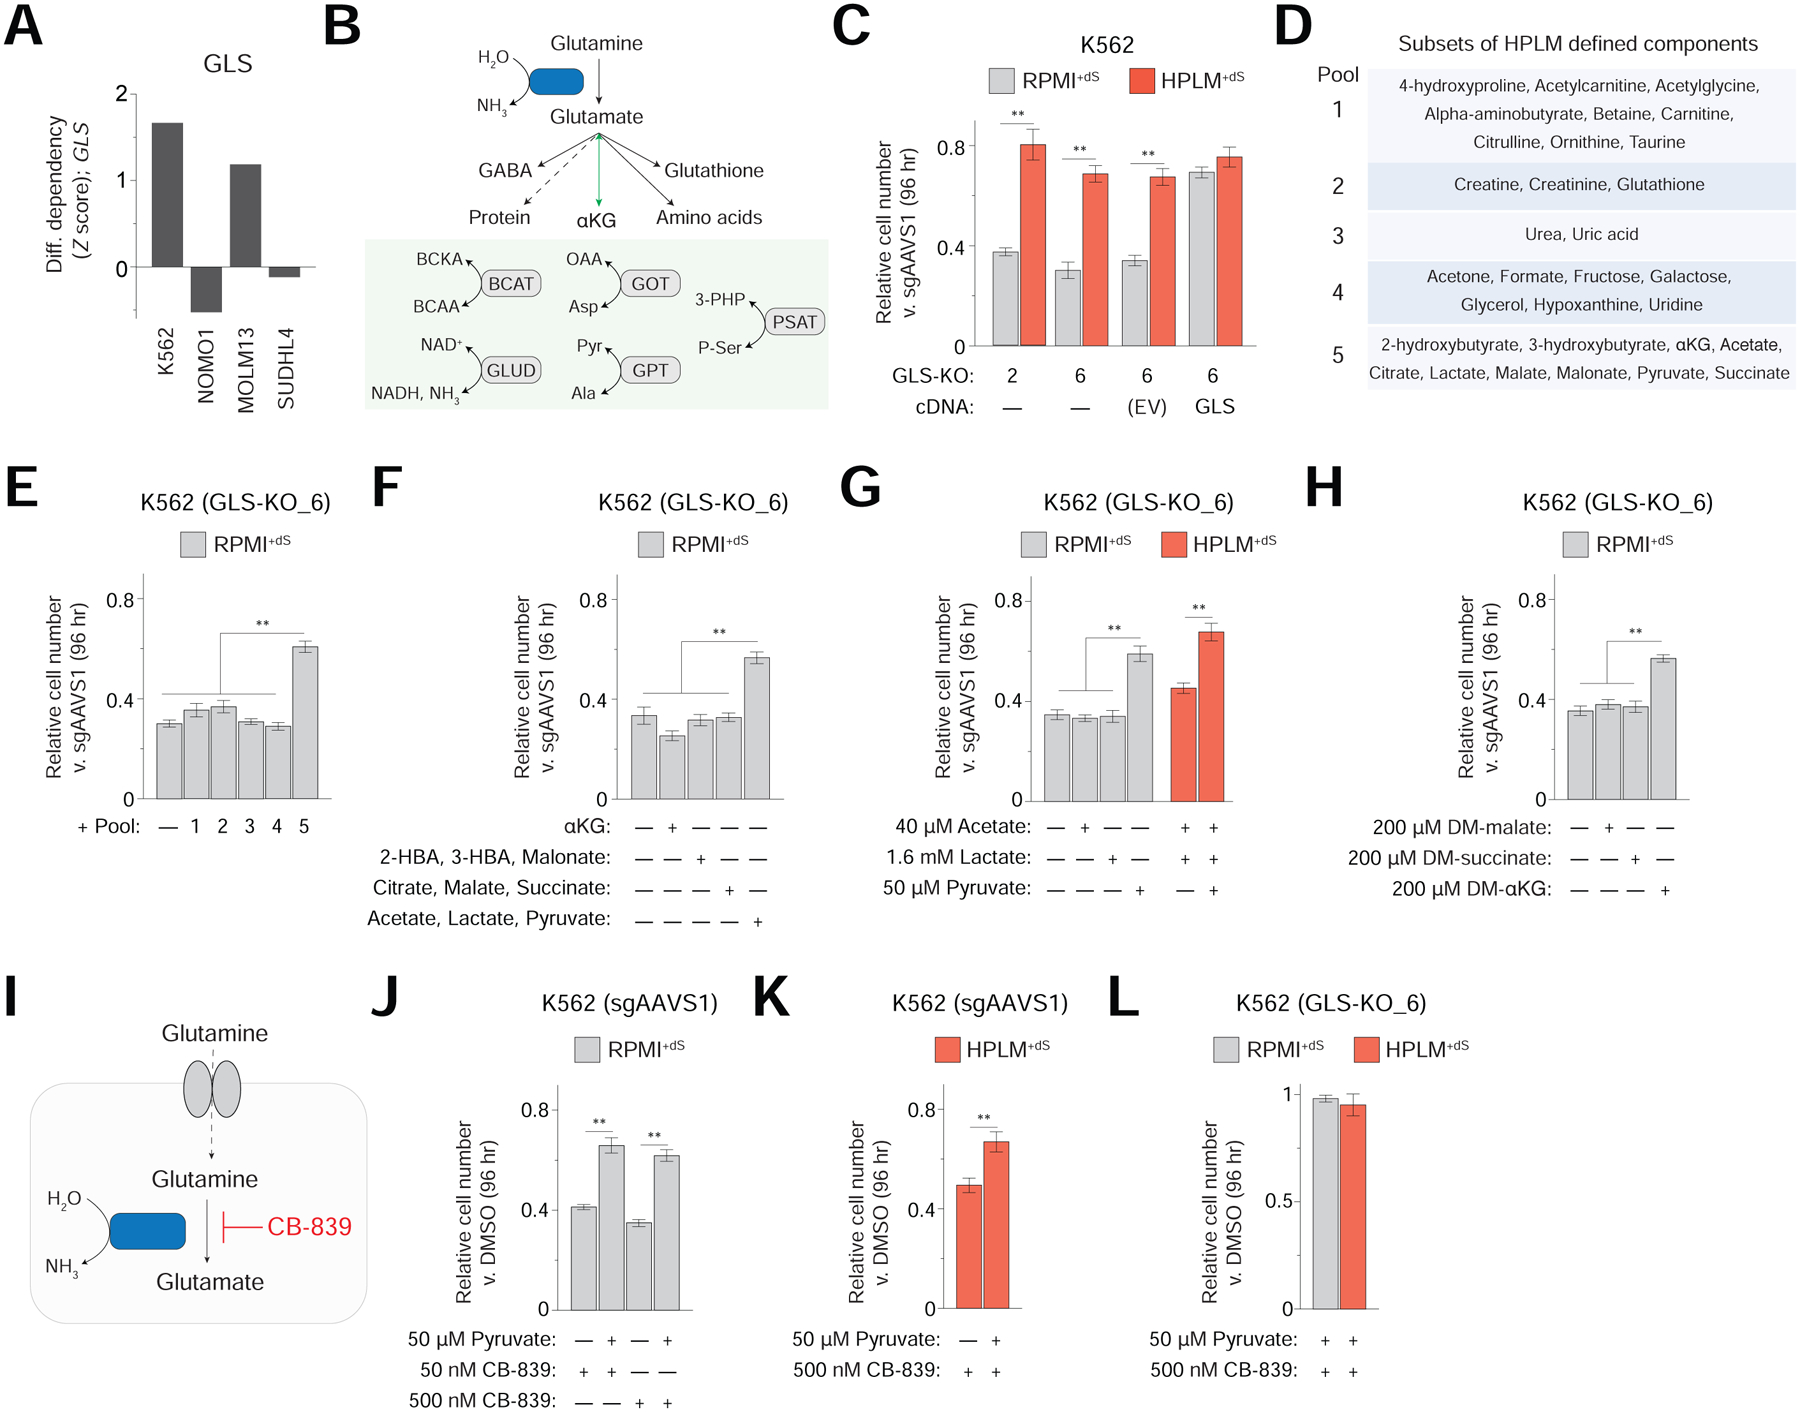
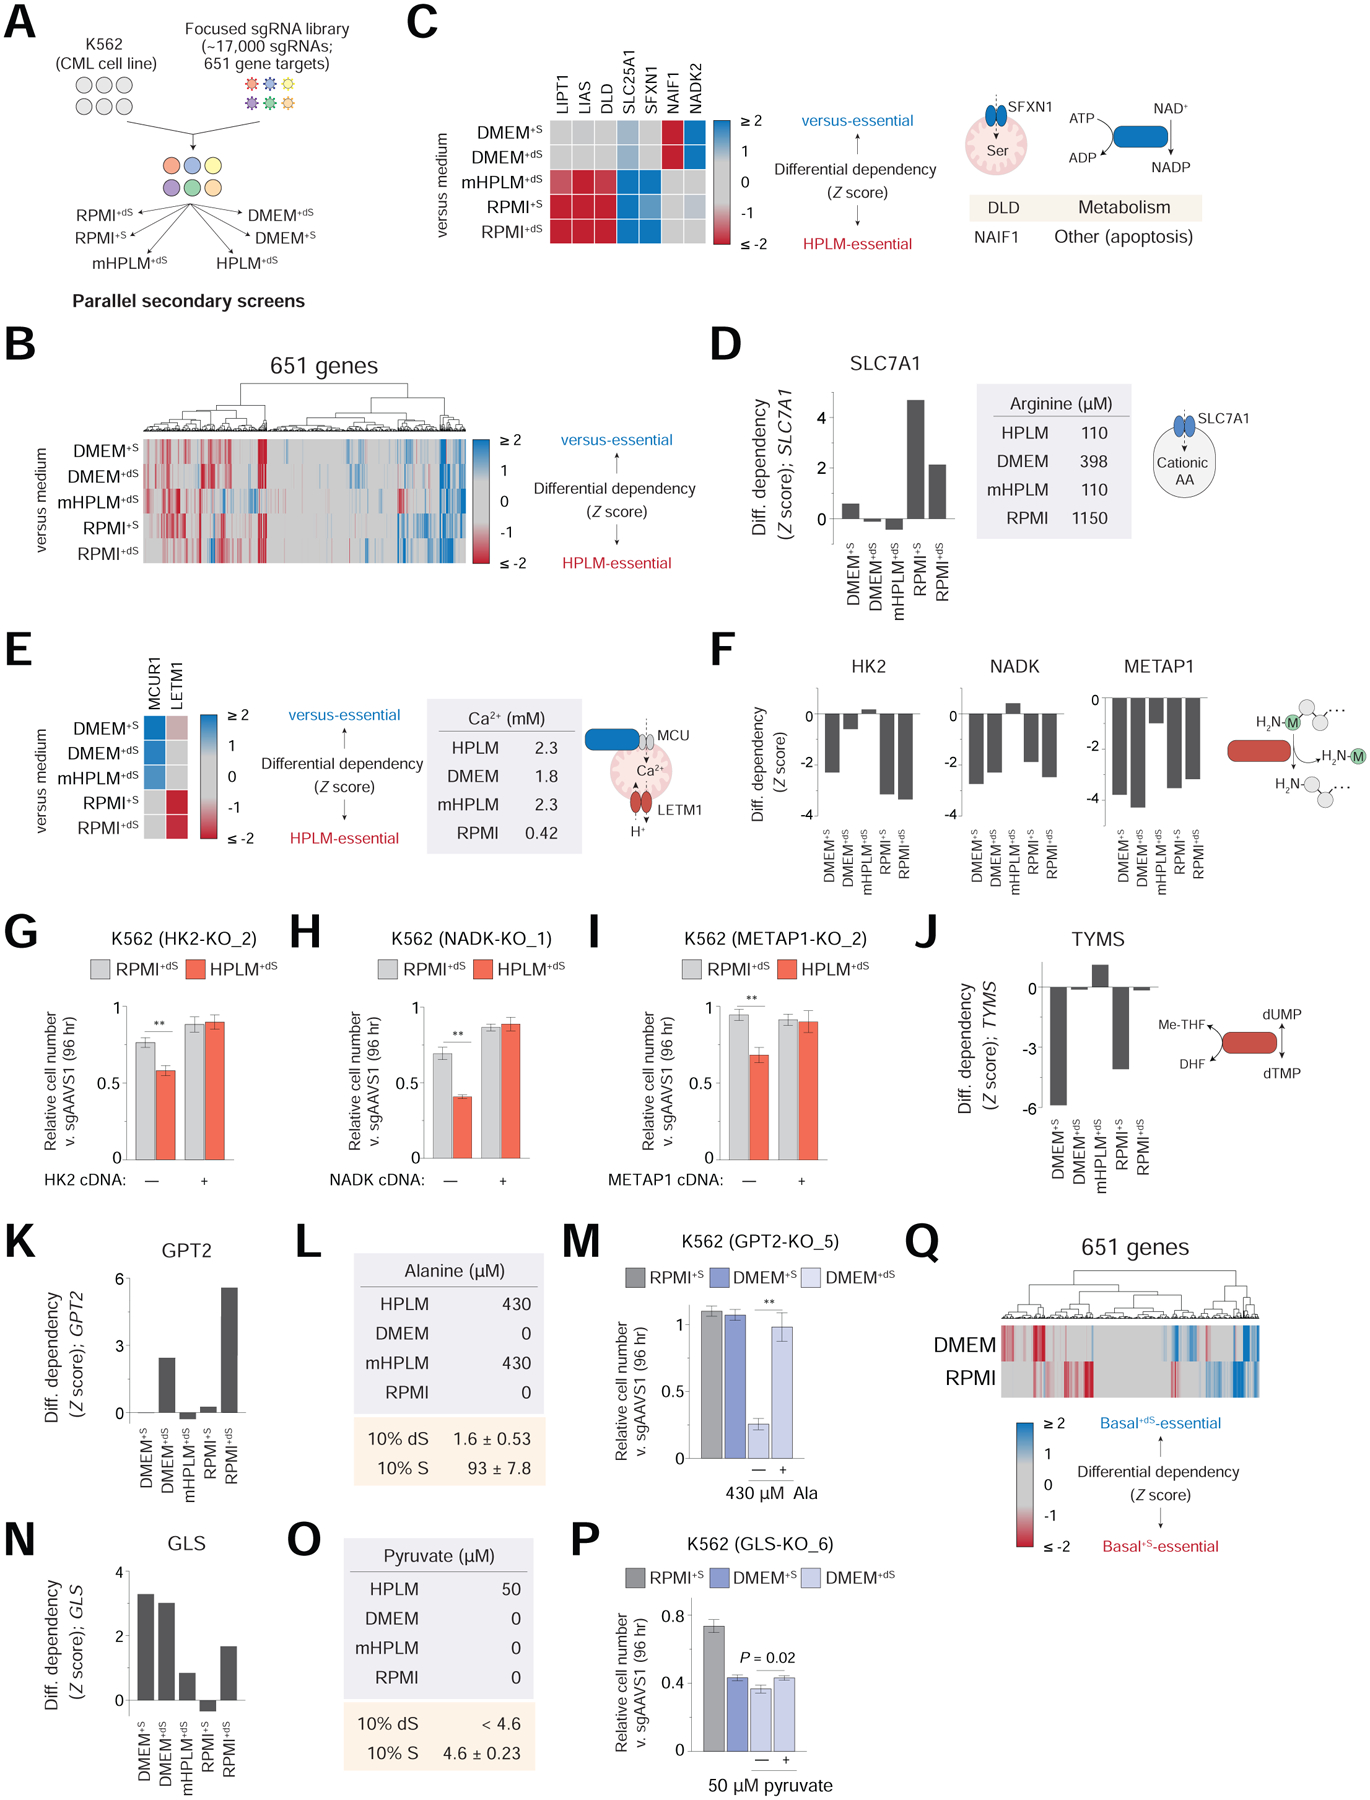
Forward genetic screens across hundreds of cancer cell lines have started to define the genetic dependencies of proliferating human cells and how these vary by genotype and lineage. Most screens, however, have been carried out in culture media that poorly reflect metabolite availability in human blood. Here, we performed CRISPR-based screens in traditional versus human plasma-like medium (HPLM). Sets of conditionally essential genes in human cancer cell lines span several cellular processes and vary with both natural cell-intrinsic diversity and the combination of basal and serum components that comprise typical media. Notably, we traced the causes for each of three conditional CRISPR phenotypes to the availability of metabolites uniquely defined in HPLM versus conventional media. Our findings reveal the profound impact of medium composition on gene essentiality in human cells, and also suggest general strategies for using genetic screens in HPLM to uncover new cancer vulnerabilities and gene-nutrient interactions.

Keywords: CRISPR; HPLM; conditional gene essentiality; gene-nutrient interaction; genetic screen; physiologic medium.


Conflict of interest statement

Declaration of interests J.R.C. and D.M.S. are inventors on a patent application for HPLM (PCT/US2017/061377) assigned to the Whitehead Institute. The remaining authors declare no competing interests.

Figures

Figure 1.
Figure 1.. Genome-wide CRISPR screens for conditionally essential genes
See also Figure S1; Tables S1 and S2. (A) Schematic for forward genetic screen methods based on either RNAi or CRISPR. sgRNA, single guide RNA. shRNA, short hairpin RNA. (B) Growth conditions across 844 CRISPR screens from DepMap. 50% DMEM, contained DMEM and another basal medium in a 1:1 mixture. (C) Schematic for genome-wide CRISPR screens in K562 cells. (D) Genes ranked by differential dependency (See STAR Methods). Barcode and enrichment plots depict the distribution of genes targeted by a metabolism-focused sgRNA library reported elsewhere (top). (E) Subset of enriched GO biological processes represented by the 952 medium-essential hits analyzed using a PANTHER overrepresentation test (See STAR Methods and Table S2). (F) Relative mRNA levels versus differential dependency for medium-essential hits. *41 of the 952 genes had no reads in the RNA-seq datasets. r, Pearson’s correlation coefficient.
Figure 2.
Figure 2.. Conditionally essential genes span several cellular processes and can vary with cell-intrinsic diversity.
See also Figure S2 and Table S3 (A) Schematic for focused library CRISPR screens. AML, acute myeloid leukemia; DLBCL, diffuse large B-cell lymphoma. (B) Comparison between phenotypes from genome-wide and secondary K562 screens. Data are fit by linear regression (blue line); shaded bands indicate 95% confidence intervals. r, Pearson’s correlation coefficient. *P = 2.2 × 10⁻¹⁶. Data for secondary K562 screens are from pooled replicates in panels B-Q. (C) Conditional phenotypes in the secondary K562 screens. Dotted lines mark ± 1 (x-axis) and a false discovery rate (FDR) = 0.1 (y-axis). (D-L) Medium-essential hits encode proteins that have roles in: (D) metabolism, (E) gene expression, (F) translation, (G) transport, (H) post-translational modification (PTM), (I) protein catabolism, (J) RNA processing, and (K) other processes, including apoptosis and mTOR signaling. Other hits lack a GO process annotation (L). Shaded points indicate hits manually curated for association with process highlighted in the panel (See STAR Methods). (M) Cluster map showing conditional phenotypes in four cell lines. (N-O) Conditional phenotypes for ACLY (N) and NADK (O). (P-Q) Heatmap of conditional phenotypes for indicated genes (left). PDHA1 and PDHB are components of PDH complex E1 subunit (P, right). SLC25A32 is a mitochondrial folate transporter (Q, right). Remaining genes are highlighted elsewhere in the Figure.
Figure 3.
Figure 3.. Identification of a gene-nutrient interaction between GPT2 and alanine
See also Figure S3 (A) Top three scoring RPMI-essential hits in four cell lines. Data for secondary K562 screens are from pooled replicates in panels A, I. (B) Cellular fates of pyruvate and the reversible reaction catalyzed by GPT1/2. LDH, lactate dehydrogenase; PDH, pyruvate dehydrogenase; PC, pyruvate carboxylase. (C-D) Immunoblots for expression of GPT2 (C) and GPT1 (D). Purified proteins confirm antibody specificity. High intrinsic protease activity in the MOLM13 line might cause the observed banding. (E) Immunoblots for expression of either GPT2 (left) or GPT1 (right) in GPT2-knockout and control (sgAAVS1) K562 cells. (F) Relative growth of GPT2-knockout versus control cells (mean ± SD, n = 3, **P < 0.005). EV, empty vector. (G) Measured concentrations of GPT reaction components in RPMI+dS and HPLM+dS (mean ± SD, n = 3). Neither αKG nor pyruvate could be detected in RPMI+dS by the metabolite profiling method; thresholds correspond to levels in RPMI+S. (H) Relative growth of GPT2-knockout versus control cells (mean ± SD, n = 3, **P < 0.005). (I) Conditional phenotypes for MPC1 (left) and MPC2 (right). (J) Immunoblot for expression of MPC2 in MPC2-knockout and control K562 cells. (K) Relative growth of MPC2-knockout versus control cells (mean ± SD, n = 3, **P < 0.005). (L) Schematic for the incorporation of 13C from glucose into alanine via pyruvate. (M-N) Fractional labeling of pyruvate (left) and alanine (right) following culture of cells in RPMI+dS containing [U-13C]-glucose (M) and further supplemented with 430 μM alanine (N) (mean ± SD, n = 3, **P < 0.005). M+3, incorporation of three 13C.
Figure 4.
Figure 4.. Protein synthesis underlies the GPT2-alanine interaction and human GPTs show markedly different KM values for pyruvate.
See also Figures S4 and Table S6 (A) Unbiased metabolite profiling of GPT2-knockout versus control K562 cells (n = 3). Dotted lines mark a fold-change of ± 1.5 (x-axis). GPT reaction components are labeled. (B-C) Heatmap of relative abundances for metabolites highlighted in either red (B) or blue (C) in panel A, RPMI+dS. GPT2-knockout cells following culture in the indicated conditions (three rows) versus control cells in RPMI+dS. Metabolite clusters are sorted by log2-transformed fold change of the top row. Argininosuccinic acid (ASA) can be a precursor to fumarate. Remaining metabolite abbreviations in Table S6. (D) Schematic for the incorporation of 13C from alanine into pyruvate. (E) Fractional labeling of pyruvate (left) and alanine (right) following culture of cells in RPMI+dS containing [U-13C]-alanine (mean ± SD, n = 3, **P < 0.005). M+3, incorporation of three 13C. (F) Proposed model for the cell-essential role of GPT2 in conditions of relative alanine limitation. Proteins encoded by RPMI-essential hits (blue). A canonical mitochondrial alanine carrier (MAC) has not yet been identified. (G) Schematic of an assay for the forward GPT reaction using LC-MS-based detection of αKG. (H-I) Plots of reaction velocity as a function of either glutamate (H) or pyruvate (I) concentration for human GPT1 (top) and GPT2 (bottom) (n = 3). Data are fit by Michaelis-Menten curves. *kcat values displayed by GPT2 may be underestimated (See Main Text).
Figure 5.
Figure 5.. Identification of a gene-nutrient interaction between GLS and pyruvate
See also Figure S5 (A) Conditional phenotypes for GLS. Data for secondary K562 screens are from pooled replicates. (B) Reaction catalyzed by GLS and cellular fates of glutamate, including its reversible conversion to αKG (top) as coupled to various reactions (bottom). BCKA, branched-chain keto acid. BCAA, branched-chain amino acid. (C) Relative growth of GLS-knockout versus control cells (mean ± SD, n = 3, **P < 0.005). (D) Pools of defined HPLM components. (E-H) Relative growth of GLS-knockout versus control cells (mean ± SD, n = 3, **P < 0.005). Pool designations correspond to panel D (E). Metabolites added at HPLM-defined concentrations (F-G). (I) Schematic for competitive inhibition of GLS by the small-molecule CB-839. (J-L) Relative growth of either control (J, K) or GLS-knockout K562 cells (L) treated with CB-839 versus DMSO (mean ± SD, n = 3, **P < 0.005).
Figure 6.
Figure 6.. Basal and serum components of complete culture media affect gene essentiality
See also Figures S6 and Table S3 (A) Schematic for focused library K562 screens in six different conditions. (B) Cluster map showing conditional phenotypes versus HPLM+dS. Data for screens in RPMI+dS and HPLM+dS are from pooled replicates in panels B-F; J-K; N; and Q. Differential dependencies were determined as HPLM+dS – “versus medium”. (C) Heatmap of HPLM-relative phenotypes for the indicated genes (left). SFXN1 is a mitochondrial serine transporter; reaction catalyzed by NADK2; manually curated processes for DLD and NAIF1 (right). Remaining genes highlighted in Figure 2. (D) HPLM-relative phenotypes for SLC7A1. (E) Heatmap of HPLM-relative phenotypes for MCUR1 and LETM1 (left). LETM1 is a mitochondrial H+/Ca2+ antiporter and MCUR1 is a regulator of the MCU, mitochondrial Ca2+ uniporter (right). (F) HPLM-relative phenotypes for HK2 (left), NADK (middle), and METAP1 (right). (G-I) Relative growth of HK2-knockout (G), NADK-knockout (H), and METAP1-knockout versus control K562 cells (mean ± SD, n = 3, **P < 0.005). (J-K) HPLM-relative phenotypes for TYMS (J) and GPT2 (K). (L) Defined alanine levels in each basal medium (top). Concentrations of alanine in 10% FBS (dS, dialyzed; S, untreated) as determined by metabolite profiling of RPMI+dS and RPMI+S (mean ± SD, n = 3). (M) Relative growth of GPT2-knockout versus control cells (mean ± SD, n = 3, **P < 0.005). (N) HPLM-relative phenotypes for GLS. (O) Defined pyruvate levels in each basal medium (top). Concentrations of pyruvate in 10% FBS (dS, dialyzed; S, untreated) as determined by metabolite profiling of RPMI+dS and RPMI+S (mean ± SD, n = 3). Pyruvate could not be detected in RPMI+dS by the metabolite profiling method. (P) Relative growth of GLS-knockout versus control cells (mean ± SD, n = 3). (Q) Cluster map showing differential dependencies calculated as DMEM+S – DMEM+dS (top row) and RPMI+S – RPMI+dS (bottom row).

References

    1. Ackermann T, and Tardito S (2019). Cell Culture Medium Formulation and Its Implications in Cancer Metabolism. Trends Cancer 5, 329–332. - PMC - PubMed
    1. Altman BJ, Stine ZE, and Dang CV (2016). From Krebs to clinic: glutamine metabolism to cancer therapy. Nat Rev Cancer 16, 619–634. - PMC - PubMed
    1. Arce-Molina R, Cortés-Molina F, Sandoval PY, Galaz A, Alegría K, Schirmeier S, Barros LF, and Martín AS (2020). A highly responsive pyruvate sensor reveals pathway- regulatory role of the mitochondrial pyruvate carrier MPC. Elife 9, e53917. - PMC - PubMed
    1. Behan FM, Iorio F, Picco G, Gonçalves E, Beaver CM, Migliardi G, Santos R, Rao Y, Sassi F, Pinnelli M, et al. (2019). Prioritization of cancer therapeutic targets using CRISPR–Cas9 screens. Nature 568, 511–516. - PubMed
    1. Birsoy K, Wang T, Chen WW, Freinkman E, Abu-Remaileh M, and Sabatini DM (2015). An Essential Role of the Mitochondrial Electron Transport Chain in Cell Proliferation Is to Enable Aspartate Synthesis. Cell 162, 540–551. - PMC - PubMed

Publication types