. 2021 Feb 26;26(5):1250.
doi: 10.3390/molecules26051250.

The Interplay of Cholesterol and Ligand Binding in h TSPO from Classical Molecular Dynamics Simulations

Affiliations

The Interplay of Cholesterol and Ligand Binding in h TSPO from Classical Molecular Dynamics Simulations

Hien T T Lai et al. Molecules. .

Abstract

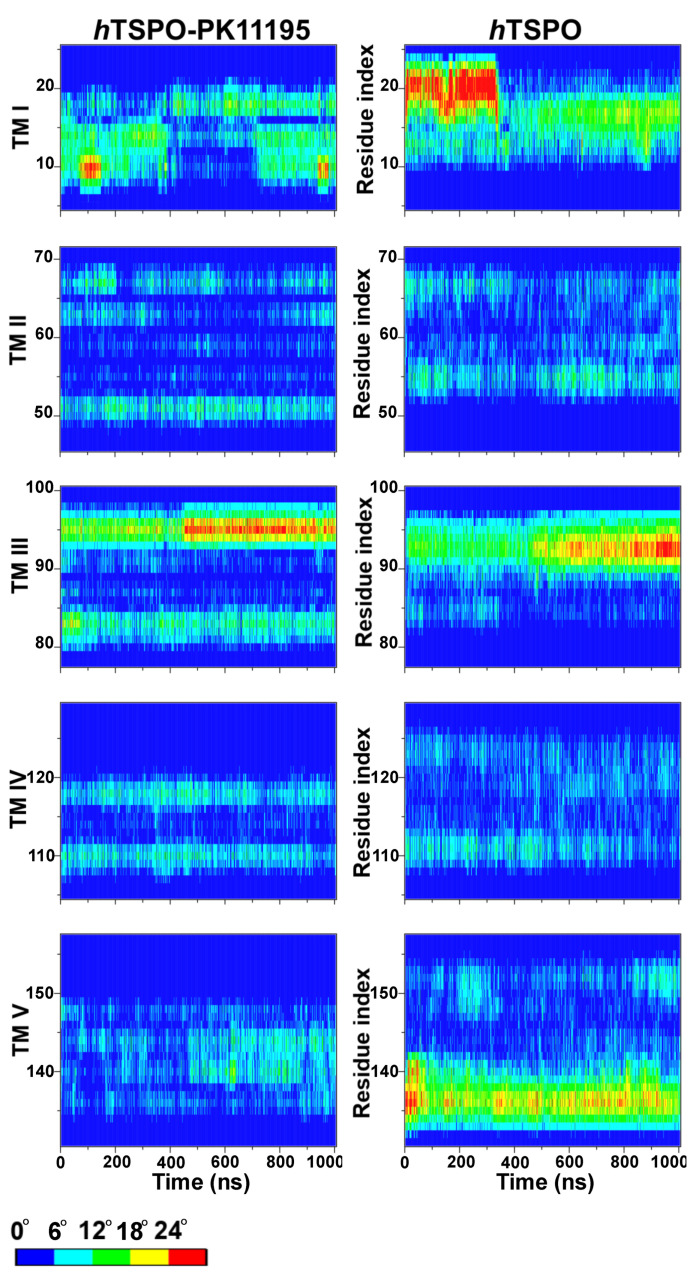
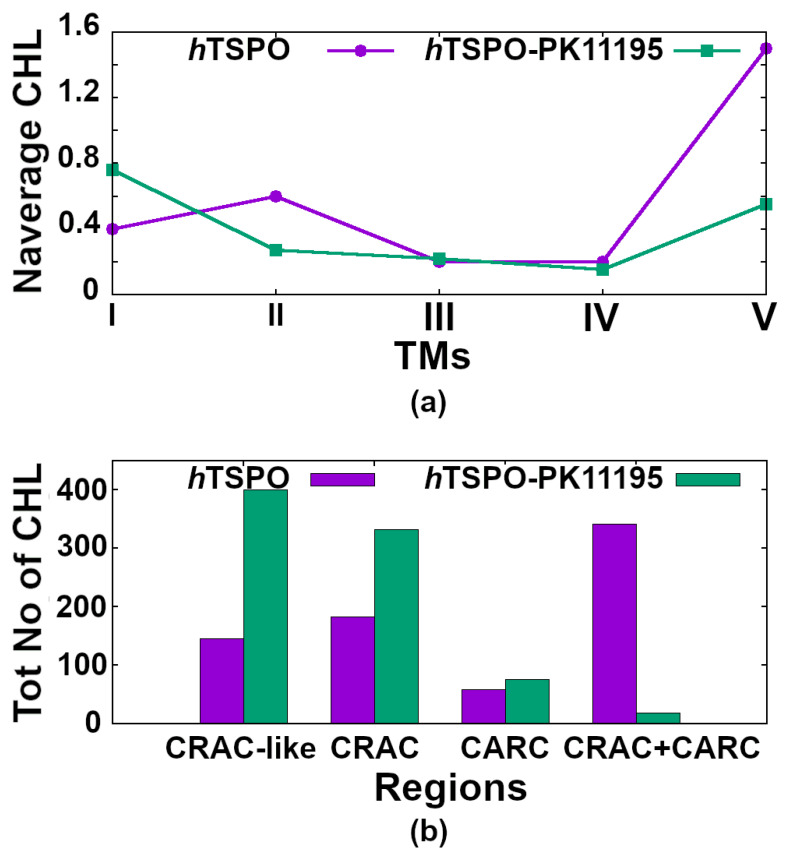
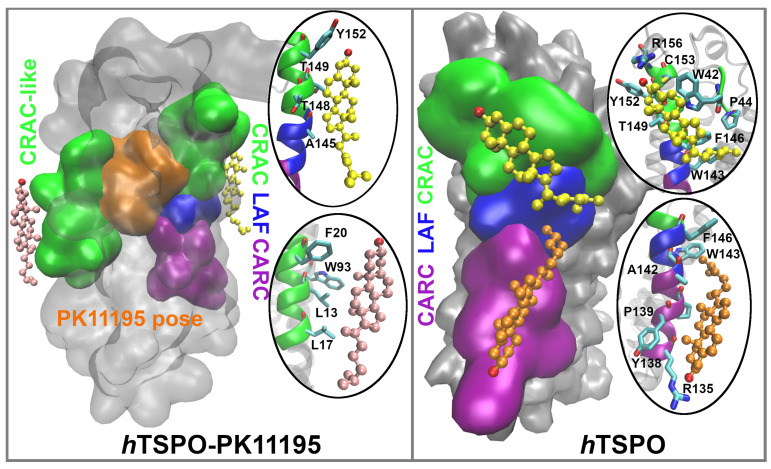
The translocator protein (TSPO) is a 18kDa transmembrane protein, ubiquitously present in human mitochondria. It is overexpressed in tumor cells and at the sites of neuroinflammation, thus representing an important biomarker, as well as a promising drug target. In mammalian TSPO, there are cholesterol-binding motifs, as well as a binding cavity able to accommodate different chemical compounds. Given the lack of structural information for the human protein, we built a model of human (h) TSPO in the apo state and in complex with PK11195, a molecule routinely used in positron emission tomography (PET) for imaging of neuroinflammatory sites. To better understand the interactions of PK11195 and cholesterol with this pharmacologically relevant protein, we ran molecular dynamics simulations of the apo and holo proteins embedded in a model membrane. We found that: (i) PK11195 stabilizes hTSPO structural fold; (ii) PK11195 might enter in the binding site through transmembrane helices I and II of hTSPO; (iii) PK11195 reduces the frequency of cholesterol binding to the lower, N-terminal part of hTSPO in the inner membrane leaflet, while this impact is less pronounced for the upper, C-terminal part in the outer membrane leaflet, where the ligand binding site is located; (iv) very interestingly, cholesterol most frequently binds simultaneously to the so-called CRAC and CARC regions in TM V in the free form (residues L150-X-Y152-X(3)-R156 and R135-X(2)-Y138-X(2)-L141, respectively). However, when the protein is in complex with PK11195, cholesterol binds equally frequently to the CRAC-resembling motif that we observed in TM I (residues L17-X(2)-F20-X(3)-R24) and to CRAC in TM V. We expect that the CRAC-like motif in TM I will be of interest in future experimental investigations. Thus, our MD simulations provide insight into the structural features of hTSPO and the previously unknown interplay between PK11195 and cholesterol interactions with this pharmacologically relevant protein.

Keywords: PK11195; cholesterol; hTSPO; homology modeling; molecular dynamics (MD) simulation.


Conflict of interest statement

The authors declare no conflict of interest.

Figures

Figure 1
Figure 1
Multiple sequence alignment of TSPO from different organisms: human TSPO (hTSPO), Mus musculus (MoTSPO) [36], Rhodobacter sphaeroides (RsTSPO) [35], and Bacillus cereus (BcTSPO) [34]. For the last three proteins, experimental structural information is available. Semi-conserved positions with more than 50% consensus according to ClustalO [46] are highlighted in cyan, while highly conserved positions with more than 90% consensus are shown in red. The oligomerization motif G83XXXG87 is indicated by the orange stars and rectangle. The W95XPXF99 motif is depicted with the blue stars and rectangle. The cholesterol-binding motif CRAC and its “mirror code” CARC are marked by dark green and violet rectangles and stars, respectively. The CRAC-like motif in TM I is highlighted by the light green rectangle.
Figure 2
Figure 2
Top and side view of the structural model of the hTSPO monomer (orange cartoon representation) aligned with the RsTSPO template (black tube representation). Four important functional regions are highlighted: cholesterol recognition/interaction amino acid consensus region (CRAC, in green color) and reverse region of the CRAC (CARC, in purple color), both involved in cholesterol binding, the G83XXXG87 motif (blue color) relevant for monomer–monomer interactions, and the W95XPXF99 motif (shown in red color) important for ligands binding. The figure was prepared with the VMD program [50].
Figure 3
Figure 3
PK11195 binding interactions with the hTSPO model. (a) Top: Open access to the binding pocket between TM I and TM II of the hTSPO structural model that persists throughout the MD simulation. We do not observe other openings, nor the change in the LP I conformation. Center: PK11195 moves in the binding site of the hTSPO model from its initial state observed in the first 450 ns (red color) to the new pose (blue color, 450–1000 ns). The image of every hundredth frame is shown smoothed with a five frame window. Bottom: Chemical formula of PK11195. (b,c) 3D and 2D representations of the PK11195 binding pocket during the first 450 ns (top) and after the ligand movement, from 450 ns till the end of the MD run (bottom). 3D plots show PK11195 (yellow and orange balls and sticksrepresentation for 0–450 ns and for 450–1000 ns, respectively) and the residues binding it for more than 90% of the simulation time; the backbone and hydrogen atoms were omitted for clarity reasons. F100 was kept in (c), despite that it does not bind PK11195 anymore, to show the change in its side chain conformation. The most constant interactions, formed for more than 75% of the simulation time between PK11195 and the hTSPO model, are shown in the 2D plots obtained by the Discovery tool [62]. Legend: green circles—hydrogen bonds, light green circles—VdW interactions, light pink circles—π-alkyl, and dark pink circles—π-π interactions.
Figure 4
Figure 4
(a) Evolution of the root mean squared deviation (RMSD) values of the apo (violet graph) and holo (green graph) hTSPOs during the 1 μs long MD simulation. RMSD values were calculated for the backbone atoms of residues W5 to N158, excluding the N– and C–termini and H atoms. (b) Root mean squared fluctuations (RMSF) of the Cα atoms in the apo (violet graph) and holo (green graph) hTSPOs. RMSF values were calculated for equilibrated proteins (in the MD simulation range of 400 ns–1 μs). (c,d) RMSD values for each of the five transmembrane helices (TM I–TM V) in the apo (hTSPO) and holo (hTSPO–PK11195) proteins, respectively.
Figure 5
Figure 5
Analysis of the flexibility of each TM domain (TM I–TM V) in hTSPO–PK11195 and hTSPO structural models by means of Bendix [67]. y-axis: residue index number corresponding to the residues composing individual TM domain; x-axis: simulation time. The color scale indicates changes in helix angle/bending during the MD simulations, from blue: <6 to red: >24.
Figure 6
Figure 6
The principal component analysis of the (a) hTSPO and (b) hTSPO–PK11195 models showing the flexible parts of the protein. The image of every hundredth frame is shown, spanning from the beginning (red color) to the end (blue color) of the MD simulation.
Figure 7
Figure 7
(a) The average number of cholesterol molecules (Naverage CHL) binding to the individual helix (TM I–TM V) in the apo (violet line) and holo (green line) hTSPOs at each frame of the 1 μs MD trajectory. (b) The total number of all cholesterol molecules (Tot No of CHL) binding either to the CRAC-like motif in TM I or to the CRAC and/or CARC in TM V during our 1 μs long MD simulation of apo hTSPO (violet) and holo hTSPO (green).
Figure 8
Figure 8
Cholesterol molecules bind most frequently to CRAC and CRAC–like regions (green surface representation) that are in the vicinity of the PK11195 binding site (orange surface representation) in the hTSPO–PK11195 system and to CRAC, LAF(blue surface representation), and CARC (purple surface representation) motifs in the hTSPO system. Corresponding residues from each region that interact with cholesterol (color coded, respectively) are represented within ellipses.

References

    1. Fan J., Lindemann P., GJ Feuilloley M., Papadopoulos V. Structural and functional evolution of the translocator protein (18 kDa) Curr. Mol. Med. 2012;12:369–386. - PubMed
    1. Bonsack F., Sukumari-Ramesh S. TSPO: An evolutionarily conserved protein with elusive functions. Int. J. Mol. Sci. 2018;19:1694. doi: 10.3390/ijms19061694. - DOI - PMC - PubMed
    1. Yeliseev A.A., Krueger K.E., Kaplan S. A mammalian mitochondrial drug receptor functions as a bacterial “oxygen” sensor. Proc. Natl. Acad. Sci. USA. 1997;94:5101–5106. doi: 10.1073/pnas.94.10.5101. - DOI - PMC - PubMed
    1. Anholt R., Pedersen P.L., De Souza E., Snyder S.H. The peripheral-type benzodiazepine receptor. Localization to the mitochondrial outer membrane. J. Biol. Chem. 1986;261:576–583. doi: 10.1016/S0021-9258(17)36131-8. - DOI - PubMed
    1. Yasin N., Veenman L., Singh S., Azrad M., Bode J., Vainshtein A., Caballero B., Marek I., Gavish M. Classical and novel TSPO ligands for the mitochondrial TSPO can modulate nuclear gene expression: Implications for mitochondrial retrograde signaling. Int. J. Mol. Sci. 2017;18:786. doi: 10.3390/ijms18040786. - DOI - PMC - PubMed

LinkOut - more resources