

Statistical Evidence for a Helical Nascent Chain
- PMID: 33652806
- PMCID: PMC7996779
- DOI: 10.3390/biom11030357
Statistical Evidence for a Helical Nascent Chain
Abstract
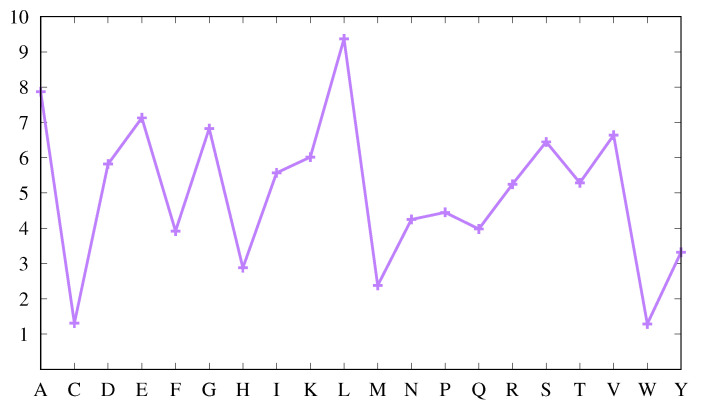
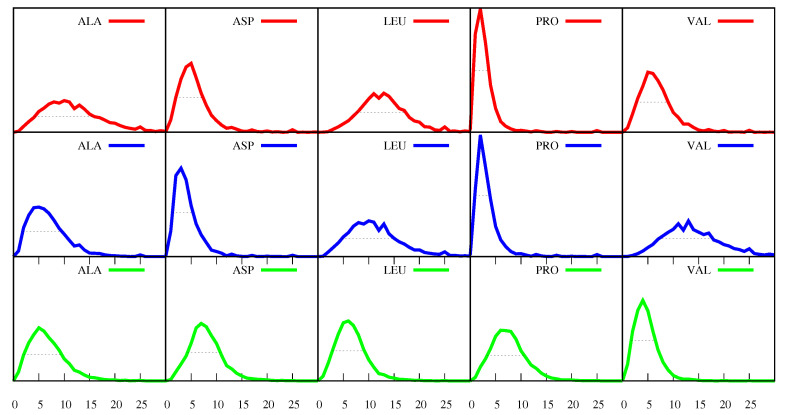
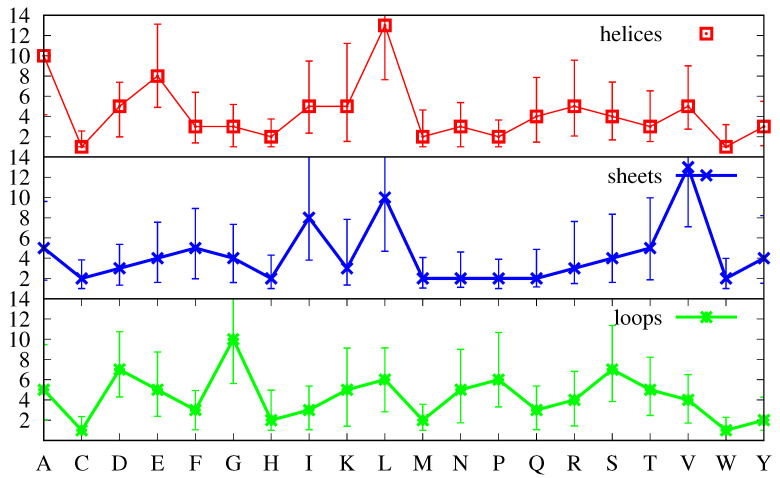
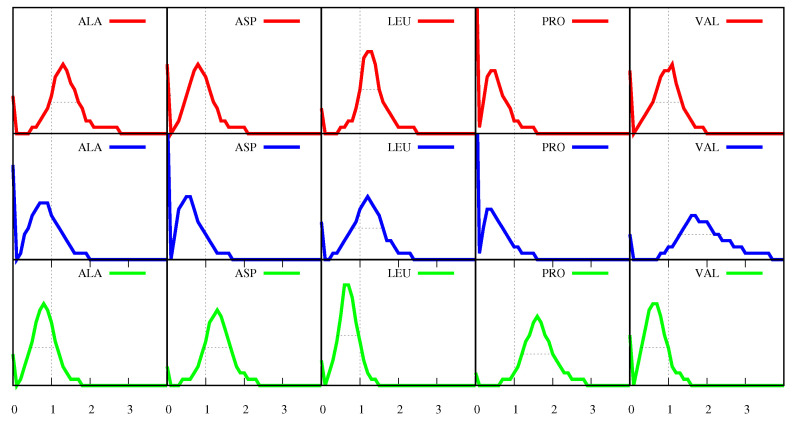
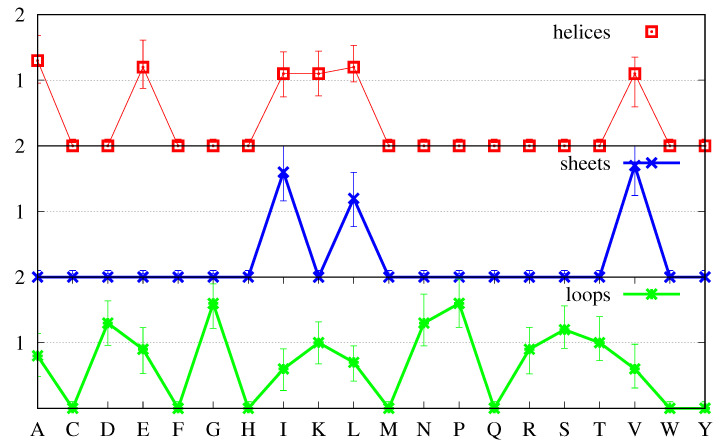
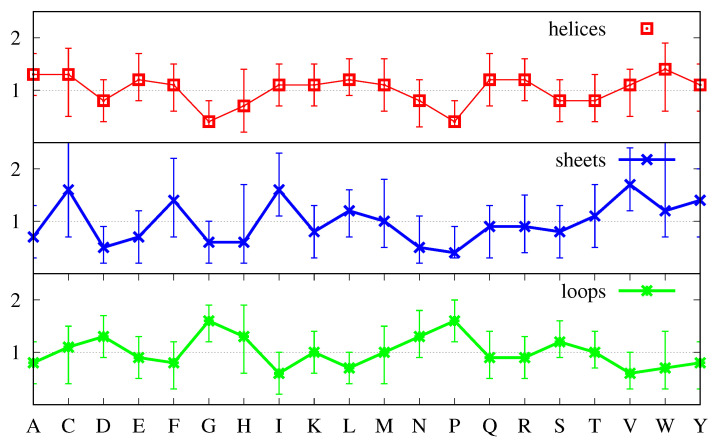
We investigate the hypothesis that protein folding is a kinetic, non-equilibrium process, in which the structure of the nascent chain is crucial. We compare actual amino acid frequencies in loops, α-helices and β-sheets with the frequencies that would arise in the absence of any amino acid bias for those secondary structures. The novel analysis suggests that while specific amino acids exist to drive the formation of loops and sheets, none stand out as drivers for α-helices. This favours the idea that the α-helix is the initial structure of most proteins before the folding process begins.
Keywords: folding pathway; protein folding; secondary structure prediction; single amino acid distributions.
Conflict of interest statement
The authors declare no conflict of interest.
Figures
Similar articles
-
Prediction of protein folding rates from simplified secondary structure alphabet.J Theor Biol. 2015 Oct 21;383:1-6. doi: 10.1016/j.jtbi.2015.07.024. Epub 2015 Aug 4. J Theor Biol. 2015. PMID: 26247139
-
Proteins that convert from alpha helix to beta sheet: implications for folding and disease.Curr Protein Pept Sci. 2000 Dec;1(4):339-47. doi: 10.2174/1389203003381289. Curr Protein Pept Sci. 2000. PMID: 12369904 Review.
-
Amino acid content of beta strands and alpha helices depends on their flanking secondary structure elements.Biosystems. 2018 Jun;168:45-54. doi: 10.1016/j.biosystems.2018.04.002. Epub 2018 May 6. Biosystems. 2018. PMID: 29742459
-
Statistical analysis of the unique characteristics of secondary structures in proteins.Comput Biol Chem. 2024 Dec;113:108237. doi: 10.1016/j.compbiolchem.2024.108237. Epub 2024 Oct 5. Comput Biol Chem. 2024. PMID: 39393289
-
Templates in protein de novo design.J Biotechnol. 1995 Jul 31;41(2-3):197-210. doi: 10.1016/0168-1656(95)00010-n. J Biotechnol. 1995. PMID: 7654350 Review.
Cited by
-
Ribosome Tunnel Environment Drives the Formation of α-Helix during Cotranslational Folding.J Chem Inf Model. 2024 Aug 26;64(16):6610-6622. doi: 10.1021/acs.jcim.4c00901. Epub 2024 Aug 16. J Chem Inf Model. 2024. PMID: 39150098 Free PMC article.
References
Publication types
MeSH terms
Substances
Grants and funding
LinkOut - more resources
Full Text Sources
Other Literature Sources
