

A Pilot Study Comparing the Effects of Consuming 100% Orange Juice or Sucrose-Sweetened Beverage on Risk Factors for Cardiometabolic Disease in Women
- PMID: 33652807
- PMCID: PMC7996959
- DOI: 10.3390/nu13030760
A Pilot Study Comparing the Effects of Consuming 100% Orange Juice or Sucrose-Sweetened Beverage on Risk Factors for Cardiometabolic Disease in Women
Abstract
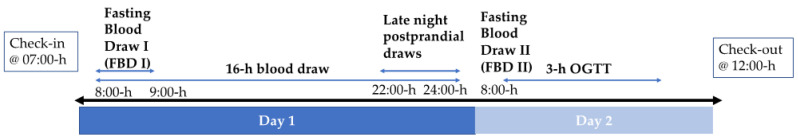
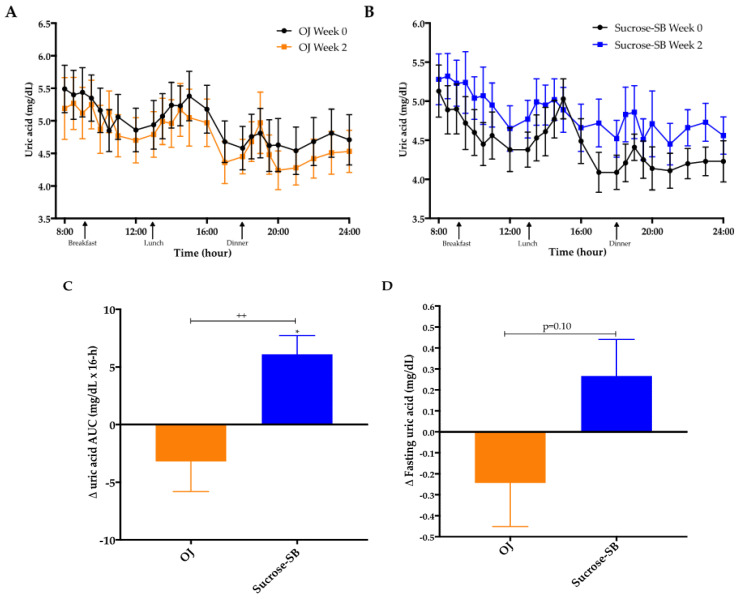
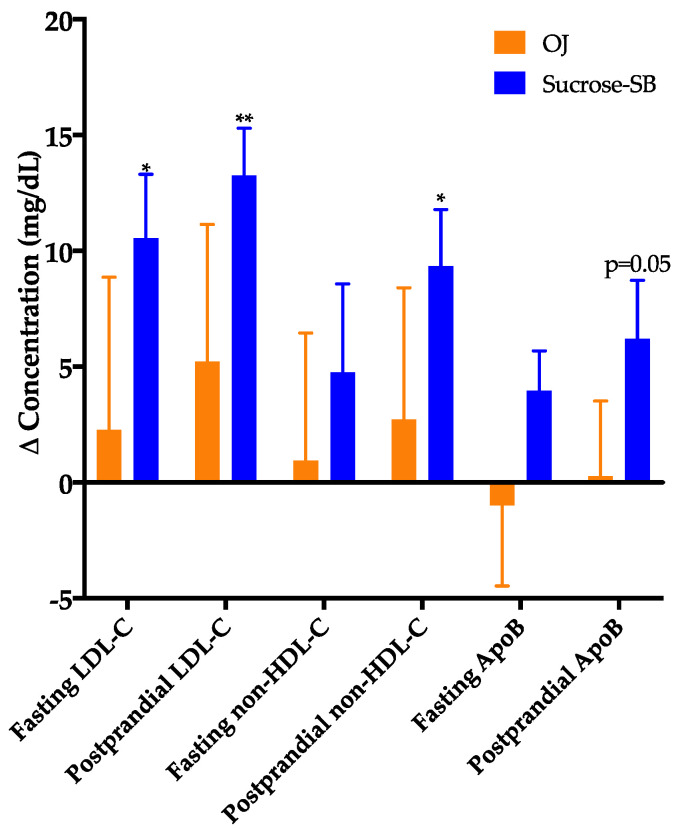
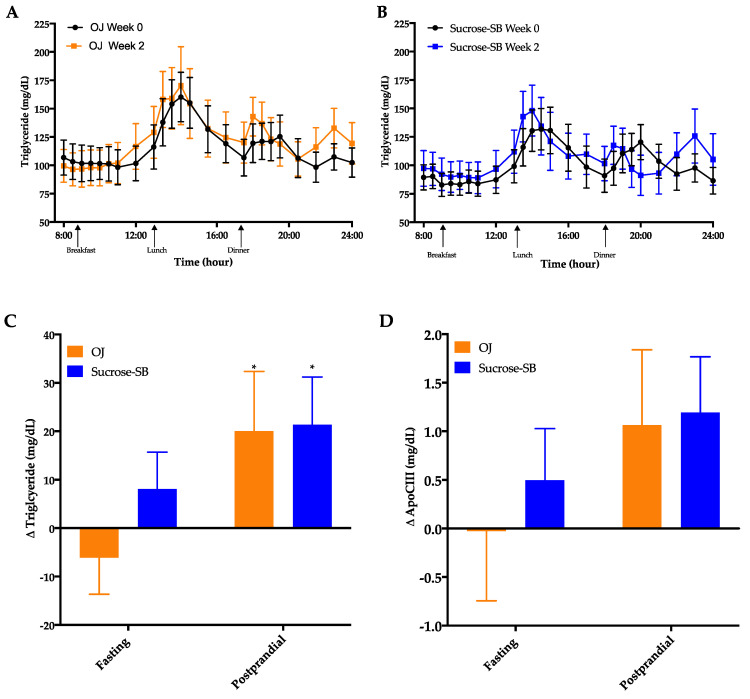
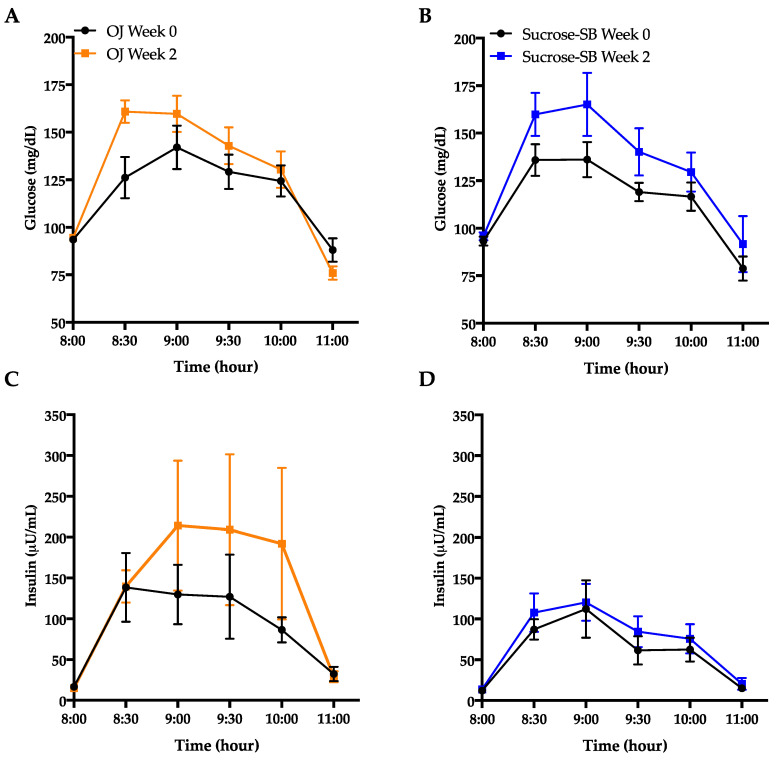
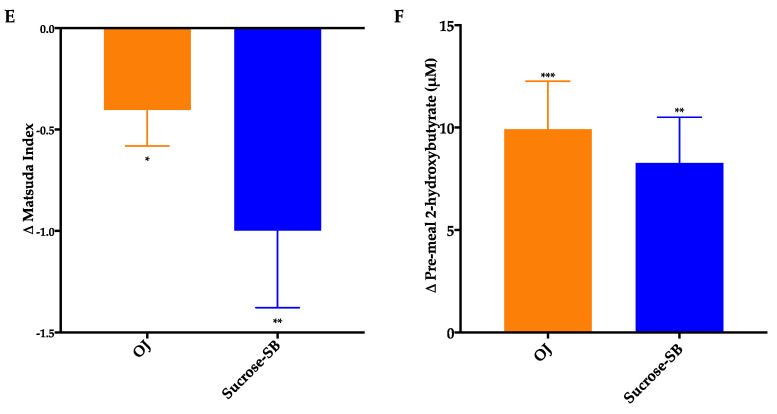
Overconsumption of sugar-sweetened beverages increases risk factors associated with cardiometabolic disease, in part due to hepatic fructose overload. However, it is not clear whether consumption of beverages containing fructose as naturally occurring sugar produces equivalent metabolic dysregulation as beverages containing added sugars. We compared the effects of consuming naturally-sweetened orange juice (OJ) or sucrose-sweetened beverages (sucrose-SB) for two weeks on risk factors for cardiometabolic disease. Healthy, overweight women (n = 20) were assigned to consume either 3 servings of 100% orange juice or sucrose-SB/day. We conducted 16-hour serial blood collections and 3-h oral glucose tolerance tests during a 30-h inpatient visit at baseline and after the 2-week diet intervention. The 16-h area under the curve (AUC) for uric acid increased in subjects consuming sucrose-SB compared with subjects consuming OJ. Unlike sucrose-SB, OJ did not significantly increase fasting or postprandial lipoproteins. Consumption of both beverages resulted in reductions in the Matsuda insulin sensitivity index (OJ: -0.40 ± 0.18, p = 0.04 within group; sucrose-SB: -1.0 ± 0.38, p = 0.006 within group; p = 0.53 between groups). Findings from this pilot study suggest that consumption of OJ at levels above the current dietary guidelines for sugar intake does not increase plasma uric acid concentrations compared with sucrose-SB, but appears to lead to comparable decreases of insulin sensitivity.
Keywords: fruit juice; insulin sensitivity; lipids; sugar-sweetened beverage; uric acid.
Conflict of interest statement
The funders had no role in the design of the study; in the collection, analyses, or interpretation of data; in the writing of the manuscript, or in the decision to publish the results.
Figures
Similar articles
-
Consuming Sucrose- or HFCS-sweetened Beverages Increases Hepatic Lipid and Decreases Insulin Sensitivity in Adults.J Clin Endocrinol Metab. 2021 Oct 21;106(11):3248-3264. doi: 10.1210/clinem/dgab508. J Clin Endocrinol Metab. 2021. PMID: 34265055 Free PMC article.
-
Postprandial Glycemic and Insulinemic Responses to Common Breakfast Beverages Consumed with a Standard Meal in Adults Who Are Overweight and Obese.Nutrients. 2017 Jan 4;9(1):32. doi: 10.3390/nu9010032. Nutrients. 2017. PMID: 28054966 Free PMC article. Clinical Trial.
-
Effects of Consuming Sugar-Sweetened Beverages for 2 Weeks on 24-h Circulating Leptin Profiles, Ad Libitum Food Intake and Body Weight in Young Adults.Nutrients. 2020 Dec 19;12(12):3893. doi: 10.3390/nu12123893. Nutrients. 2020. PMID: 33352724 Free PMC article. Clinical Trial.
-
Are Fruit Juices Healthier Than Sugar-Sweetened Beverages? A Review.Nutrients. 2019 May 2;11(5):1006. doi: 10.3390/nu11051006. Nutrients. 2019. PMID: 31052523 Free PMC article. Review.
-
Sugar- and Intense-Sweetened Drinks in Australia: A Systematic Review on Cardiometabolic Risk.Nutrients. 2017 Sep 28;9(10):1075. doi: 10.3390/nu9101075. Nutrients. 2017. PMID: 28956823 Free PMC article.
Cited by
-
Gout and Diet: A Comprehensive Review of Mechanisms and Management.Nutrients. 2022 Aug 26;14(17):3525. doi: 10.3390/nu14173525. Nutrients. 2022. PMID: 36079783 Free PMC article. Review.
-
Reply to: 'Guidelines on 'added' sugars are unscientific and unnecessary'.Nat Rev Cardiol. 2022 Dec;19(12):847-849. doi: 10.1038/s41569-022-00794-7. Nat Rev Cardiol. 2022. PMID: 36220971 No abstract available.
-
Consuming Sucrose- or HFCS-sweetened Beverages Increases Hepatic Lipid and Decreases Insulin Sensitivity in Adults.J Clin Endocrinol Metab. 2021 Oct 21;106(11):3248-3264. doi: 10.1210/clinem/dgab508. J Clin Endocrinol Metab. 2021. PMID: 34265055 Free PMC article.
References
-
- Stanhope K.L., Goran M.I., Bosy-Westphal A., King J.C., Schmidt L.A., Schwarz J.-M., Stice E., Sylvetsky A.C., Turnbaugh P.J., Bray G.A., et al. Pathways and mechanisms linking dietary components to cardiometabolic disease: Thinking beyond calories. Obes. Rev. 2018;19:1205–1235. doi: 10.1111/obr.12699. - DOI - PMC - PubMed
-
- Stanhope K.L., Schwarz J.M., Keim N.L., Griffen S.C., Bremer A.A., Graham J.L., Hatcher B., Cox C.L., Dyachenko A., Zhang W., et al. Consuming fructose-sweetened, not glucose-sweetened, beverages increases visceral adiposity and lipids and decreases insulin sensitivity in overweight/obese humans. J. Clin. Investig. 2009;119:1322–1334. doi: 10.1172/JCI37385. - DOI - PMC - PubMed
-
- Stanhope K.L., Medici V., Bremer A.A., Lee V., Lam H.D., Nunez M.V., Chen G.X., Keim N.L., Havel P.J. A dose-response study of consuming high-fructose corn syrup–sweetened beverages on lipid/lipoprotein risk factors for cardiovascular disease in young adults. Am. J. Clin. Nutr. 2015;101:1144–1154. doi: 10.3945/ajcn.114.100461. - DOI - PMC - PubMed
Publication types
MeSH terms
Substances
Grants and funding
- HL121324-S02/NH/NIH HHS/United States
- R01 HL121324/HL/NHLBI NIH HHS/United States
- M01 RR001271/RR/NCRR NIH HHS/United States
- P30 DK098722/DK/NIDDK NIH HHS/United States
- T32 HL007444/HL/NHLBI NIH HHS/United States
- R01 DK095960/DK/NIDDK NIH HHS/United States
- S10 OD010417/OD/NIH HHS/United States
- R01 HL107256/HL/NHLBI NIH HHS/United States
- K12 HD051958/NH/NIH HHS/United States
- U24 DK092993/DK/NIDDK NIH HHS/United States
- R01 HL121324-S01/NH/NIH HHS/United States
- R25 HL145817/HL/NHLBI NIH HHS/United States
- P30 ES023513/ES/NIEHS NIH HHS/United States
- 142691/University of California Office of the President award to the University of California, San Fran-cisco Sugar, Stress, Environment and Weight Center
- K23 HL133442/HL/NHLBI NIH HHS/United States
LinkOut - more resources
Full Text Sources
Other Literature Sources
