

Induction of Apoptosis and Regulation of MicroRNA Expression by (2 E,6 E)-2,6- bis-(4-hydroxy-3-methoxybenzylidene)-cyclohexanone (BHMC) Treatment on MCF-7 Breast Cancer Cells
- PMID: 33652854
- PMCID: PMC7956517
- DOI: 10.3390/molecules26051277
Induction of Apoptosis and Regulation of MicroRNA Expression by (2 E,6 E)-2,6- bis-(4-hydroxy-3-methoxybenzylidene)-cyclohexanone (BHMC) Treatment on MCF-7 Breast Cancer Cells
Abstract
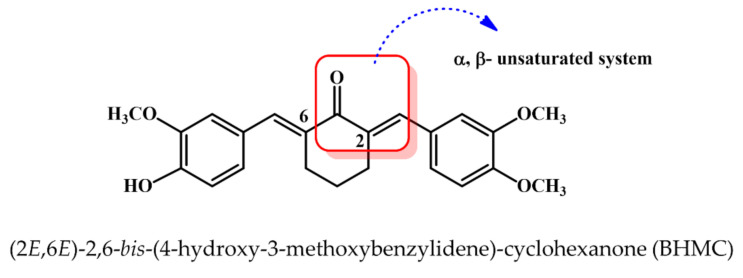
(2E,6E)-2,6-bis-(4-hydroxy-3-methoxybenzylidene)-cyclohexanone (BHMC) is a synthetic curcumin analogue, which has been reported to possess anti-tumor, anti-metastatic, and anti-invasion properties on estrogen receptor (ER) negative breast cancer cells in vitro and in vivo. However, the cytotoxic effects of BHMC on ER positive breast cancer cells were not widely reported. This study was aimed to investigate the cytotoxic potential of BHMC on MCF-7 cells using cell viability, cell cycle, and apoptotic assays. Besides, microarray and quantitative polymerase chain reaction (qPCR) were performed to identify the list of miRNAs and genes, which could be dysregulated following BHMC treatment. The current study discovered that BHMC exhibits selective cytotoxic effects on ER positive MCF-7 cells as compared to ER negative MDA-MB-231 cells and normal breast cells, MCF-10A. BHMC was shown to promote G2/M cell cycle arrest and apoptosis in MCF-7 cells. Microarray and qPCR analysis demonstrated that BHMC treatment would upregulate several miRNAs like miR-3195 and miR-30a-3p and downregulate miRNAs such as miR-6813-5p and miR-6132 in MCF-7 cells. Besides, BHMC administration was also found to downregulate few tumor-promoting genes like VEGF and SNAIL in MCF-7. In conclusion, BHMC induced apoptosis in the MCF-7 cells by altering the expressions of apoptotic-regulating miRNAs and associated genes.
Keywords: 2,6-bis-(4-hydroxy-3-methoxybenzylidene)-cyclohexanone (BHMC); MCF-7; apoptosis; breast cancer; miRNA.
Conflict of interest statement
The authors declare no conflict of interest.
Figures


Similar articles
-
The Molecular Targets and Anti-Invasive Effects of 2,6-bis-(4-hydroxyl-3methoxybenzylidine) cyclohexanone or BHMC in MDA-MB-231 Human Breast Cancer Cells.Molecules. 2018 Apr 10;23(4):865. doi: 10.3390/molecules23040865. Molecules. 2018. PMID: 29642589 Free PMC article.
-
Flavokawain derivative FLS induced G2/M arrest and apoptosis on breast cancer MCF-7 cell line.Drug Des Devel Ther. 2016 Jun 10;10:1897-907. doi: 10.2147/DDDT.S102164. eCollection 2016. Drug Des Devel Ther. 2016. PMID: 27358555 Free PMC article.
-
Antinociceptive activity of a synthetic curcuminoid analogue, 2,6-bis-(4-hydroxy-3-methoxybenzylidene)cyclohexanone, on nociception-induced models in mice.Basic Clin Pharmacol Toxicol. 2012 Mar;110(3):275-82. doi: 10.1111/j.1742-7843.2011.00804.x. Epub 2011 Nov 4. Basic Clin Pharmacol Toxicol. 2012. PMID: 21967232
-
Curcumin as an Adjunct Therapy and microRNA Modulator in Breast Cancer.Curr Pharm Des. 2018;24(2):171-177. doi: 10.2174/1381612824666171129203506. Curr Pharm Des. 2018. PMID: 29189128 Review.
-
Modification of miRNA Expression through plant extracts and compounds against breast cancer: Mechanism and translational significance.Phytomedicine. 2020 Mar;68:153168. doi: 10.1016/j.phymed.2020.153168. Epub 2020 Jan 8. Phytomedicine. 2020. PMID: 31982837 Review.
Cited by
-
Curcumin for Treating Breast Cancer: A Review of Molecular Mechanisms, Combinations with Anticancer Drugs, and Nanosystems.Pharmaceutics. 2024 Jan 5;16(1):79. doi: 10.3390/pharmaceutics16010079. Pharmaceutics. 2024. PMID: 38258090 Free PMC article. Review.
-
Curcuminoids as Modulators of EMT in Invasive Cancers: A Review of Molecular Targets With the Contribution of Malignant Mesothelioma Studies.Front Pharmacol. 2022 Jul 8;13:934534. doi: 10.3389/fphar.2022.934534. eCollection 2022. Front Pharmacol. 2022. PMID: 35873564 Free PMC article. Review.
-
MASP2 inhibition by narsoplimab suppresses endotheliopathies characteristic of transplant-associated thrombotic microangiopathy: in vitro and ex vivo evidence.Clin Exp Immunol. 2023 Jul 21;213(2):252-264. doi: 10.1093/cei/uxad055. Clin Exp Immunol. 2023. PMID: 37191586 Free PMC article.
-
A purified and lyophilized Pseudomonas aeruginosa derived pyocyanin induces promising apoptotic and necrotic activities against MCF-7 human breast adenocarcinoma.Microb Cell Fact. 2022 Dec 17;21(1):262. doi: 10.1186/s12934-022-01988-x. Microb Cell Fact. 2022. PMID: 36528623 Free PMC article.
-
Updated Review on Natural Polyphenols: Molecular Mechanisms, Biological Effects, and Clinical Applications for Cancer Management.Biomolecules. 2025 Apr 28;15(5):629. doi: 10.3390/biom15050629. Biomolecules. 2025. PMID: 40427522 Free PMC article. Review.
References
-
- World Cancer Research Fund Breast Cancer Statistics. [(accessed on 28 April 2020)]; Available online: https://www.wcrf.org/dietandcancer/cancer-trends/breast-cancer-statistics.
MeSH terms
Substances
Grants and funding
LinkOut - more resources
Full Text Sources
Other Literature Sources
Medical
Molecular Biology Databases
Research Materials
Miscellaneous
