Observational Study
. 2021 Mar 16;10(6):e018835.
doi: 10.1161/JAHA.120.018835. Epub 2021 Mar 3.

County-Level Factors Associated With Cardiovascular Mortality by Race/Ethnicity

Affiliations
Observational Study

County-Level Factors Associated With Cardiovascular Mortality by Race/Ethnicity

Bongeka Z Zuma et al. J Am Heart Assoc. .

Abstract

Background Persistent racial/ethnic disparities in cardiovascular disease (CVD) mortality are partially explained by healthcare access and socioeconomic, demographic, and behavioral factors. Little is known about the association between race/ethnicity-specific CVD mortality and county-level factors. Methods and Results Using 2017 county-level data, we studied the association between race/ethnicity-specific CVD age-adjusted mortality rate (AAMR) and county-level factors (demographics, census region, socioeconomics, CVD risk factors, and healthcare access). Univariate and multivariable linear regressions were used to estimate the association between these factors; R2 values were used to assess the factors that accounted for the greatest variation in CVD AAMR by race/ethnicity (non-Hispanic White, non-Hispanic Black, and Hispanic/Latinx individuals). There were 659 740 CVD deaths among non-Hispanic White individuals in 2698 counties; 100 475 deaths among non-Hispanic Black individuals in 717 counties; and 49 493 deaths among Hispanic/Latinx individuals across 267 counties. Non-Hispanic Black individuals had the highest mean CVD AAMR (320.04 deaths per 100 000 individuals), whereas Hispanic/Latinx individuals had the lowest (168.42 deaths per 100 000 individuals). The highest CVD AAMRs across all racial/ethnic groups were observed in the South. In unadjusted analyses, the greatest variation (R2) in CVD AAMR was explained by physical inactivity for non-Hispanic White individuals (32.3%), median household income for non-Hispanic Black individuals (24.7%), and population size for Hispanic/Latinx individuals (28.4%). In multivariable regressions using county-level factor categories, the greatest variation in CVD AAMR was explained by CVD risk factors for non-Hispanic White individuals (35.3%), socioeconomic factors for non-Hispanic Black (25.8%), and demographic factors for Hispanic/Latinx individuals (34.9%). Conclusions The associations between race/ethnicity-specific age-adjusted CVD mortality and county-level factors differ significantly. Interventions to reduce disparities may benefit from being designed accordingly.

Keywords: cardiovascular disease mortality; disparities; race/ethnicity; social determinants.


Conflict of interest statement

None.

Figures
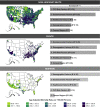
Figure 1
Figure 1. Differences across racial/ethnic groups in the county‐level factors most strongly associated with age‐adjusted cardiovascular disease (CVD) mortality.
Maps show variation in county‐level age‐adjusted cardiovascular mortality rate across the United States. There were 698 overlapping counties between non‐Hispanic White (NHW) and Black county cohorts, 258 between NHW and Hispanic/Latinx county cohorts, and 179 between Black and Hispanic/Latinx county cohorts. Categories of factors that were included in multivariable analysis are shown ranked by the amount of variance in age‐adjusted cardiovascular mortality rate that they explain (R 2). The width of the colored boxes is the R 2 relative to a reference of the maximum R 2 for each race/ethnicity. Factor categories and included county‐level factors: demographic factors (population size, percentage rural, percentage women, percentage Black individuals, percentage Asian individuals, and percentage Hispanic individuals); census region (Northeast, Midwest, South, and West); socioeconomic factors (percentage some college, percentage unemployed, percentage food insecure, and median household income); CVD risk factors (percentage smokers, percentage physically inactive, percentage diabetic individuals, and percentage obese individuals); and healthcare factors (primary care provider rate and percentage uninsured adults).
Figure 2
Figure 2. Multivariable regression model results for race/ethnicity‐specific cardiovascular disease (CVD) age‐adjusted mortality rate (AAMR).
Multivariable regression models including all county‐level factors (percentage food insecure, percentage physically inactive, percentage smokers, percentage women, percentage obese, percentage unemployed, percentage Asian individuals, percentage diabetic, percentage uninsured, percentage Hispanic individuals, percentage Black individuals, primary care provider (PCP) rate, percentage rural, percentage some college, median household income, and population) for each of the county cohorts: non‐Hispanic White, Black, and Hispanic/Latinx individuals. Point estimates are ß coefficients, and error bars indicate CIs. Blue signifies covariates with significant associations with CVD AAMR (P<0.01), whereas red signifies nonsignificant associations. aR2 indicates adjusted R 2.

References

    1. Dwyer‐Lindgren L, Bertozzi‐Villa A, Stubbs RW, Morozoff C, Kutz MJ, Huynh C, Barber RM, Shackelford KA, Mackenbach JP, van Lenthe FJ, et al. US county‐level trends in mortality rates for major causes of death, 1980–2014. JAMA. 2016;316:2385–2401.DOI: 10.1001/jama.2016.13645. - DOI - PMC - PubMed
    1. Heron M. Deaths: leading causes for 2017. Natl Vital Stat Rep. 2017;68:77. - PubMed
    1. Graham G. Disparities in cardiovascular disease risk in the United States. Curr Cardiol Rev. 2015;11:238–245. DOI: 10.2174/1573403X11666141122220003. - DOI - PMC - PubMed
    1. Kurian AK, Cardarelli KM. Racial and ethnic differences in cardiovascular disease risk factors: a systematic review. Ethn Dis. 2007;17:143–152. - PubMed
    1. Patel SA, Ali MK, Narayan KMV, Mehta NK. County‐level variation in cardiovascular disease mortality in the United States in 2009–2013: comparative assessment of contributing factors. Am J Epidemiol. 2016;184:933–942.DOI: 10.1093/aje/kww081. - DOI - PubMed

Publication types