

Dark extinction: the problem of unknown historical extinctions
- PMID: 33653097
- PMCID: PMC8086982
- DOI: 10.1098/rsbl.2021.0007
Dark extinction: the problem of unknown historical extinctions
Abstract
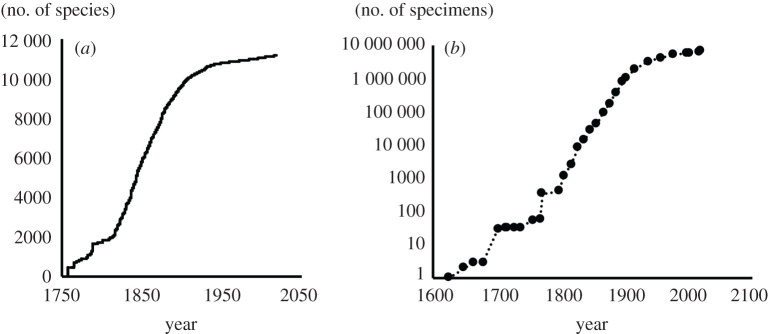
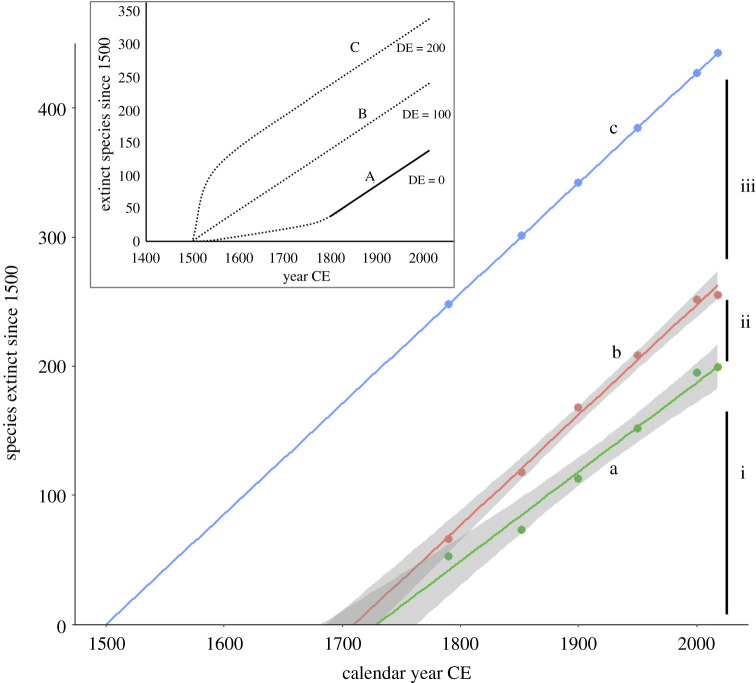
The extinction of species before they are discovered and named (dark extinction, DE) is widely inferred as a significant part of species loss in the 'pre-taxonomic' period (approx. 1500-1800 CE) and, to some extent, in the 'taxonomic period' (approx. 1800-present) as well. The discovery of oceanic islands and other pristine habitats by European navigators and the consequent introduction of destructive mammals, such as rats and goats, started a process of anthropogenic extinction. Much ecosystem change happened before systematic scientific recording, so has led to DE. Statistical methods are available to robustly estimate DE in the 'taxonomic period'. For the 'pre-taxonomic period', simple extrapolation can be used. The application of these techniques to world birds, for example, suggests that approximately 56 DEs occurred in the 'taxonomic period' (1800-present) and approximately 180 in the 'pre-taxonomic period' (1500-1800). Targeting collection activities in extinction hotspots, to make sure organisms are represented in collections before their extinction, is one way of reducing the number of extinct species without a physical record (providing that collection efforts do not themselves contribute to species extinction).
Keywords: St Helena; dark extinction; extinction debt; extinction rate; island extinction; oceanic island.
Figures
References
-
- Lyell C. 1832. Changes caused by the progress of human population. In Principles of geology: being an attempt to explain the former changes of the Earth's surface, by reference to causes now in operation. London: John Murray.
-
- Bartlett LJ, Williams DR, Prescott GW, Balmford A, Green RE, Eriksson A, Valdes PJ, Singarayer JS, Manica A. 2016. Robustness despite uncertainty: regional climate data reveal the dominant role of humans in explaining global extinctions of Late Quaternary megafauna. Ecography 39, 152-161. ( 10.1111/ecog.01566) - DOI
-
- Martin PS. 1984. Prehistoric overkill: the global model. In Quaternary extinctions: a prehistoric revolution (eds Martin PS, Klein RG), pp. 354-403. Tucson, AZ: University of Arizona Press.
-
- Gillespie R. 2008. Updating Martin's global extinction model. Q. Sci. Rev. 27, 2522-2529. ( 10.1016/j.quascirev.2008.09.007) - DOI
Publication types
MeSH terms
LinkOut - more resources
Full Text Sources