. 2021 Mar 10;288(1946):20210177.
doi: 10.1098/rspb.2021.0177. Epub 2021 Mar 3.

Genotype by environment interactions in coral bleaching

Affiliations

Genotype by environment interactions in coral bleaching

Crawford Drury et al. Proc Biol Sci. .

Abstract

Climate-driven reef decline has prompted the development of next-generation coral conservation strategies, many of which hinge on the movement of adaptive variation across genetic and environmental gradients. This process is limited by our understanding of how genetic and genotypic drivers of coral bleaching will manifest in different environmental conditions. We reciprocally transplanted 10 genotypes of Acropora cervicornis across eight sites along a 60 km span of the Florida Reef Tract and documented significant genotype × environment interactions in bleaching response during the severe 2015 bleaching event. Performance relative to site mean was significantly different between genotypes and can be mostly explained by ensemble models of correlations with genetic markers. The high explanatory power was driven by significant enrichment of loci associated DNA repair, cell signalling and apoptosis. No genotypes performed above (or below) bleaching average at all sites, so genomic predictors can provide practitioners with 'confidence intervals' about the chance of success in novel habitats. These data have important implications for assisted gene flow and managed relocation, and their integration with traditional active restoration.

Keywords: coral bleaching; coral restoration; genotype-by-environment interactions.


Figures
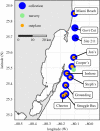
Figure 1.
Figure 1.
Map of collection and outplant sites. Acropora cervicornis colonies were collected from each of 10 sites, common gardened in a nursery for 1 year and returned to eight of the original collection sites. Sites span approximately 60 km of the Florida Reef Tract. (Online version in colour.)
Figure 2.
Figure 2.
Bleaching response. (a) Temperature records from seven sites during the 2015 bleaching event, with the overall mean. Dashed line denotes the local bleaching threshold of 30.5°C. (b) Mean visual bleaching score over three timepoints (May, June, August) for all genotype × site combinations. Black points denote ‘home sites' for eight of 10 genotypes (figure 1). No corals from Jon's genotype were outplanted at Cooper's Reef. (c) Site-corrected bleaching residuals (Relative Heat Tolerance) for each genotype. We took the average bleaching score of every fragment and subtracted the site average to correct for environmental differences. Points are visualized as the average at each site for each genotype, showing that no genotypes had absolute performance better or worse than average. Points greater than 0 represent a genotype that underwent more bleaching than average at a given site, while points less than 0 represent less bleaching than average. (Online version in colour.)
Figure 3.
Figure 3.
Gene ontologies highly correlated with bleaching residuals. Gene ontology enrichments in genes highly correlated with bleaching residuals. Enrichment was calculated from one-way Mann–Whitney U tests on ranked correlation coefficients between bleaching residual for all 13 337 loci using GO_MWU for (a) biological processes and (b) molecular functions. No cellular compartment ontologies were enriched. Ontologies in black have FDR-adjusted p < 0.05 and grey have p < 0.1.
Figure 4.
Figure 4.
Predicted bleaching residuals. We applied the model generated from the reciprocal transplant to genomic data from an additional set of samples with no phenotypic information (n = 173). (a) Comparison of validation data from the Lower Keys and predicted bleaching residuals. (b) Predicted tolerant and susceptible corals were found in every region, with the most resilient individuals found in Miami Beach. (c) Map of values, offset to avoid overplotting. (Online version in colour.)

References

    1. LaJeunesse TC, Parkinson JE, Gabrielson PW, Jeong HJ, Reimer JD, Voolstra CR, Santos SR. 2018. Systematic revision of symbiodiniaceae highlights the antiquity and diversity of coral endosymbionts. Curr. Biol. 28, 2570-2580. (10.1016/j.cub.2018.07.008) - DOI - PubMed
    1. Brown BE. 1997. Coral bleaching: causes and consequences. Coral Reefs 16, S129-S138. (10.1007/s003380050249) - DOI
    1. Hughes TP, et al. 2018. Spatial and temporal patterns of mass bleaching of corals in the Anthropocene. Science 359, 80-83. (10.1126/science.aan8048) - DOI - PubMed
    1. Van Hooidonk R, Maynard J, Planes S.. 2013. Temporary refugia for coral reefs in a warming world. Nat. Clim. Change 3, 508. (10.1038/nclimate1829) - DOI
    1. Donovan MK, Adam TC, Shantz AA, Speare KE, Munsterman KS, Rice MM, Schmitt RJ, Holbrook SJ, Burkepile DE. 2020. Nitrogen pollution interacts with heat stress to increase coral bleaching across the seascape. Proc. Natl Acad. Sci. USA 117, 5351-5357. (10.1073/pnas.1915395117) - DOI - PMC - PubMed

Publication types

LinkOut - more resources