. 2021 Mar 2;22(1):102.
doi: 10.1186/s12859-021-04040-8.

A machine learning-based gene signature of response to the novel alkylating agent LP-184 distinguishes its potential tumor indications

Affiliations

A machine learning-based gene signature of response to the novel alkylating agent LP-184 distinguishes its potential tumor indications

Umesh Kathad et al. BMC Bioinformatics. .

Abstract

Background: Non-targeted cytotoxics with anticancer activity are often developed through preclinical stages using response criteria observed in cell lines and xenografts. A panel of the NCI-60 cell lines is frequently the first line to define tumor types that are optimally responsive. Open data on the gene expression of the NCI-60 cell lines, provides a unique opportunity to add another dimension to the preclinical development of such drugs by interrogating correlations with gene expression patterns. Machine learning can be used to reduce the complexity of whole genome gene expression patterns to derive manageable signatures of response. Application of machine learning in early phases of preclinical development is likely to allow a better positioning and ultimate clinical success of molecules. LP-184 is a highly potent novel alkylating agent where the preclinical development is being guided by a dedicated machine learning-derived response signature. We show the feasibility and the accuracy of such a signature of response by accurately predicting the response to LP-184 validated using wet lab derived IC50s on a panel of cell lines.

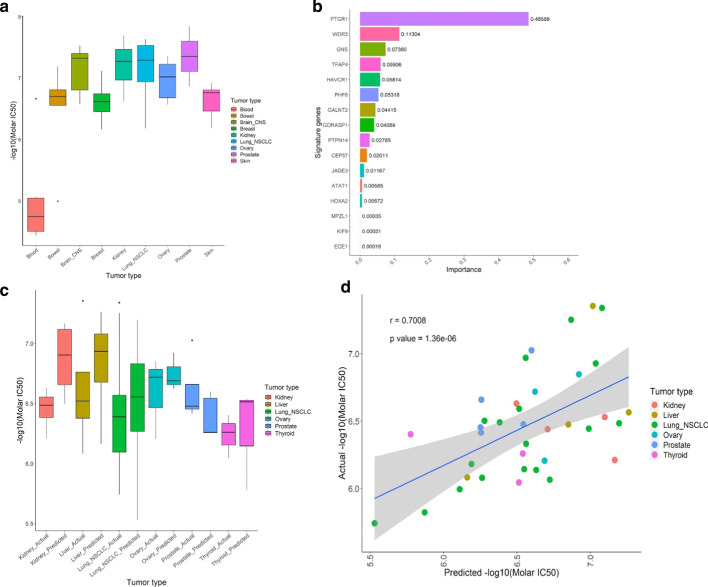
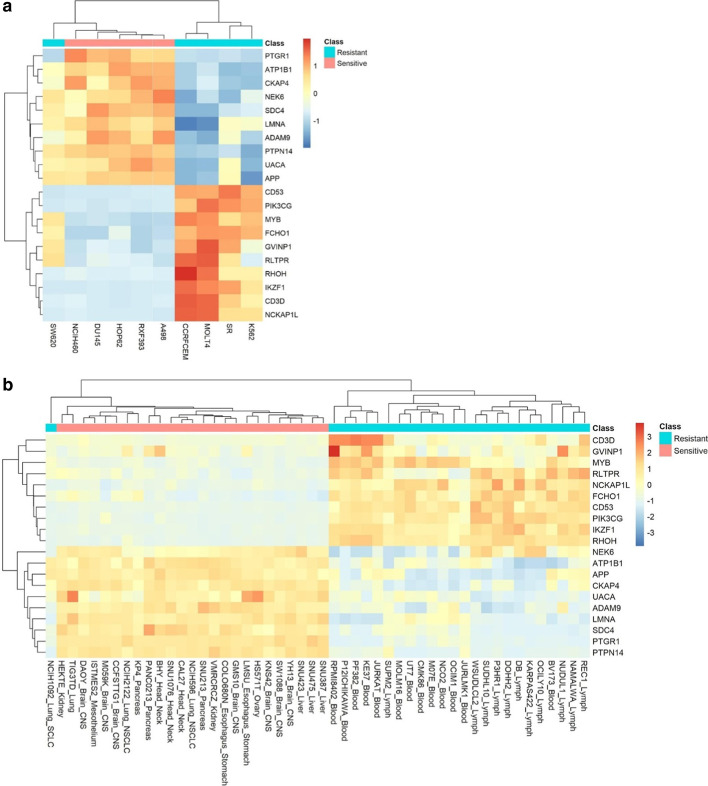
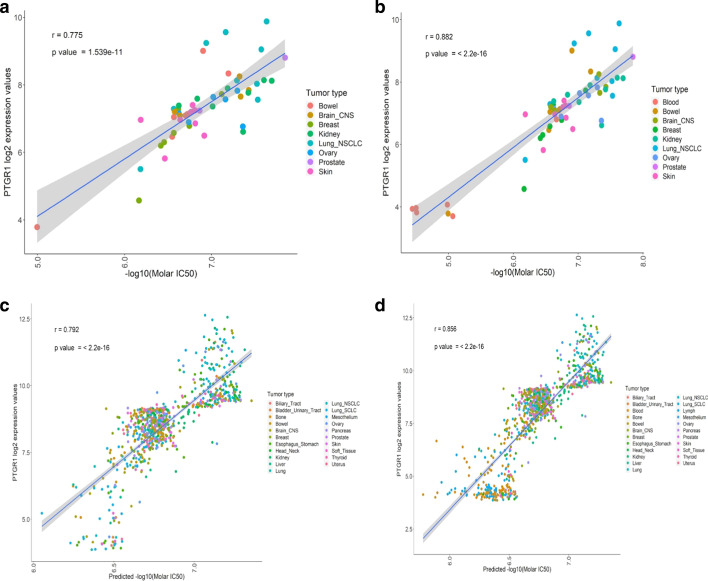
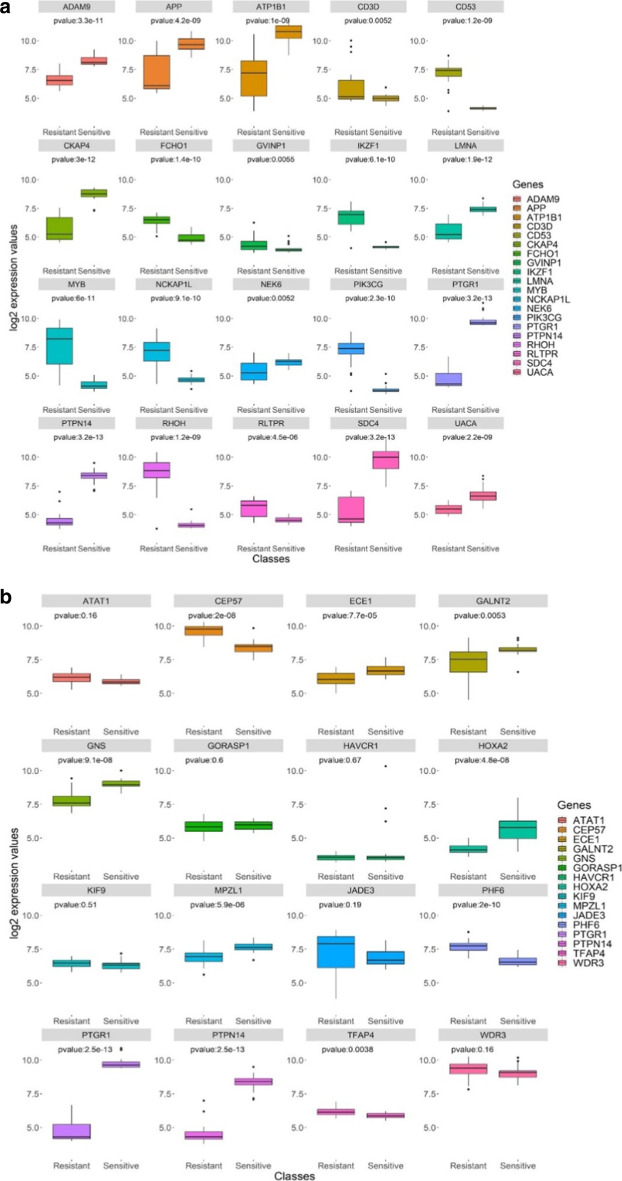
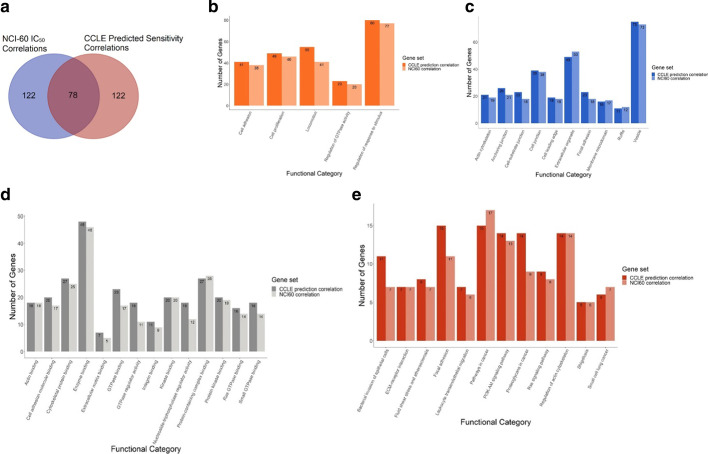
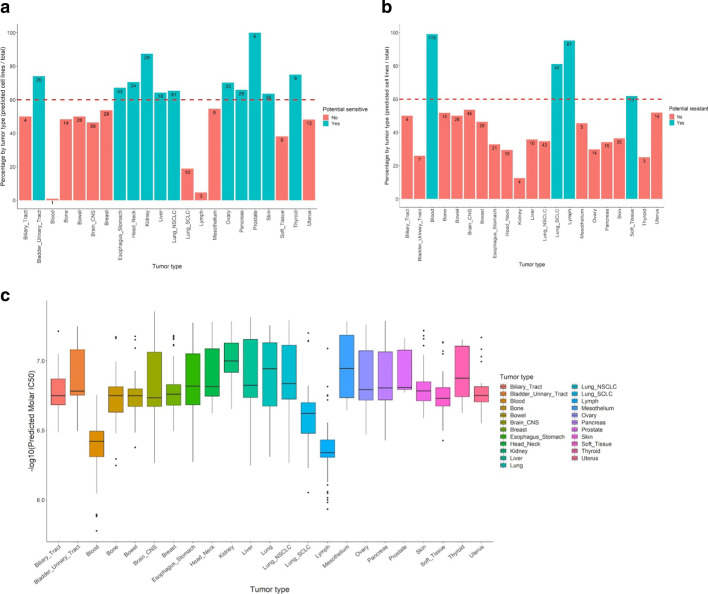
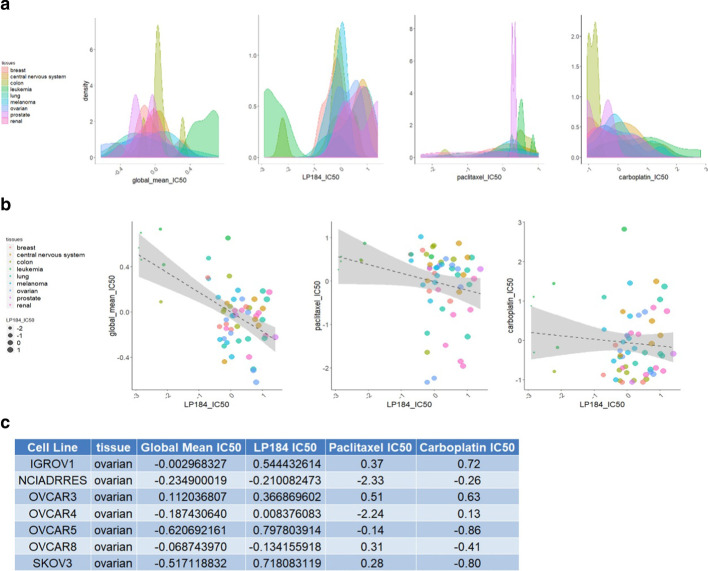
Results: We applied our proprietary RADR® platform to an NCI-60 discovery dataset encompassing LP-184 IC50s and publicly available gene expression data. We used multiple feature selection layers followed by the XGBoost regression model and reduced the complexity of 20,000 gene expression values to generate a 16-gene signature leading to the identification of a set of predictive candidate biomarkers which form an LP-184 response gene signature. We further validated this signature and predicted response to an additional panel of cell lines. Considering fold change differences and correlation between actual and predicted LP-184 IC50 values as validation performance measures, we obtained 86% accuracy at four-fold cut-off, and a strong (r = 0.70) and significant (p value 1.36e-06) correlation between actual and predicted LP-184 sensitivity. In agreement with the perceived mechanism of action of LP-184, PTGR1 emerged as the top weighted gene.

Conclusion: Integration of a machine learning-derived signature of response with in vitro assessment of LP-184 efficacy facilitated the derivation of manageable yet robust biomarkers which can be used to predict drug sensitivity with high accuracy and clinical value.

Keywords: Acylfulvene; Biomarker; Cancer; Gene signature; LP-184; Machine learning; PTGR1; Response prediction.


Conflict of interest statement

Financial competing interests: U.K., A.K., J.R.M., J.W., N.B., P.S. and K.B. are or have been salaried employees of or consultants to the pharmaceutical company Lantern Pharma Inc. U.K., A.K., P.S., and K.B. hold options to purchase common stock of Lantern Pharma Inc. and are also included as inventors on patent applications filed by Lantern Pharma Inc. J.-P.R. and R.M. are employees of REPROCELL USA, Inc., a commercial contract research organization providing services to Lantern Pharma Inc. Non-financial competing interests: The authors declare that they have no competing interests.

Figures

Fig. 1
Fig. 1
Comparison between actual and predicted LP-184 IC50 values. a Sensitivity profile of LP-184 in the 52 cell lines grouped by tumor type from NCI-60 panel. b Gene signature predictive of LP-184 response. c This boxplot shows proximity between actual and predicted LP-184 IC50 values (− log10 (Molar IC50)) on Y axis for individual tumor types on X axis from the blind test set of 37 solid tumor cell lines. d This graph shows Pearson correlation between actual and predicted LP-184 IC50 values from the blind test set of 37 solid tumor cell lines, covering 6 tumor types
Fig. 2
Fig. 2
Co-clustering between genes highly correlated with LP-184 sensitivity in training set and cell lines subgroups. a This heat map displays the clustering pattern across the top 5 cell lines known to be sensitive and resistant to LP-184 (from actual IC50 in NCI-60 data) arranged in vertical columns and the top 20 correlated genes (10 positively correlated and 10 negatively correlated) with actual known LP-184 sensitivity arranged in horizontal rows. b This heat map displays the clustering pattern across the top 25 cell lines predicted sensitive and resistant to LP-184 (from predicted IC50 in CCLE testing data) arranged in vertical columns and the top 20 correlated genes (10 positively correlated and 10 negatively correlated) with actual known LP-184 sensitivity arranged in horizontal rows
Fig. 3
Fig. 3
Correlation between PTGR1 transcript level (Y axis) and observed or predicted LP-184 IC50s (X axis). a PTGR1 gene expression correlation with actual IC50 from NCI-60 solid tumor cell lines (excluding blood) PTGR1 expression correlation from 52 NCI-60 solid tumor cell lines with LP184 drug sensitivity shows strong and significant (p value 1.539e−11) Pearson correlation (correlation coefficient r = 0.775). b PTGR1 gene expression correlation with actual IC50 from all NCI-60 cancer cell lines (including blood). c PTGR1 gene expression correlation with predicted IC50 from CCLE solid tumor cell lines (excluding blood and lymph). d PTGR1 gene expression correlation with predicted IC50 from all CCLE cell lines (including blood and lymph)
Fig. 4
Fig. 4
Classifying cancer cell lines into predicted LP-184 sensitivity groups based on gene expression levels. a This panel of box plots shows the differential expression of each of the top 20 correlated genes (10 positively correlated and 10 negatively correlated) with actual known LP-184 sensitivity in NCI-60 training data across the top 25 predicted sensitive and top 25 predicted resistant cell lines in the CCLE testing data. b This panel of box plots shows the differential expression of each of the 16 signature genes of LP-184 response across the top 25 predicted sensitive and top 25 predicted resistant cell lines in the CCLE testing data
Fig. 5
Fig. 5
Overlap between and functional enrichment of LP-184 correlated genes from training and test sets. a This Venn diagram shows common genes between NCI-60 correlation with actual LP-184 sensitivity, and CCLE correlation with predicted LP-184 sensitivity. Bar charts show common GO enriched categories from b biological process, c cellular component, d molecular function aspects and e signaling pathway from KEGG (Kyoto Encyclopedia of Genes and Genomes), between NCI-60 top correlated genes and CCLE top correlated genes. Top 20 significant (FDR <  = 0.05) GO enrichments were selected for comparison
Fig. 6
Fig. 6
Potential LP-184 sensitive and resistant tumor types from the test set predictions. a This bar chart shows tumor types potentially sensitive to LP-184, highlighted in green. Y axis represents the percentage of cell lines by tumor type predicted as sensitive to LP-184, and X axis shows various tumor types. b This bar chart shows tumor types potentially resistant to LP-184, highlighted in red. Y axis represents the percentage of cell lines by tumor type predicted as resistant to LP-184, and X axis shows various tumor types. c This box plot shows the spread of predicted LP-184 IC50 values across multiple tumor types represented in the CCLE
Fig. 7
Fig. 7
Comparison of LP184 drug sensitivity profile with other drugs. a The frequency of different sensitivity levels is shown for each tissue for different drug groups. The IC50 is shown as a z-score, with the higher score indicating greater sensitivity of the corresponding cell lines or tissues. The global mean IC50 refers to the average z-score of each of the > 20,000 compounds in the NCI-60 dataset. b Pairwise comparisons of drug sensitivity in individual cell lines. For distinguishing points of interest, the point size is proportional to LP184 drug sensitivity. LP-184 shows higher z-scores for ovarian cancer, compared to the global average, and, in some lines, to individual drugs used clinically in ovarian cancer. c Table of IC50 z-score values for LP-184, paclitaxel, and carboplatin drugs, and the average of > 20,000 compounds, in 7 ovarian cancer lines from the NCI-60 panel

References

    1. McMorris TC, Kelner MJ, Chadha RK, Siegel JS, Moon SS, Moya MM. Structure and reactivity of illudins. Tetrahedron. 1989;45:5433–5440. doi: 10.1016/S0040-4020(01)89489-8. - DOI
    1. Kelner MJ, McMorris TC, Montoya MA, Estes L, Rutherford M, Samson KM, et al. Characterization of cellular accumulation and toxicity of illudin S in sensitive and nonsensitive tumor cells. Cancer Chemother Pharmacol. 1997;40:65–71. doi: 10.1007/s002800050627. - DOI - PubMed
    1. MacDonald JR, Muscoplat CC, Dexter DL, Mangold GL, Chen SF, Kelner MJ, et al. Preclinical antitumor activity of 6-hydroxymethylacylfulvene, a semisynthetic derivative of the mushroom toxin illudin S. Cancer Res. 1997;57:279–283. - PubMed
    1. McMorris TC, Kelner MJ, Wang W, Yu J, Estes LA, Taetle R. (Hydroxymethyl)acylfulvene: an illudin derivative with superior antitumor properties. J Nat Prod. 1996;59:896–899. doi: 10.1021/np960450y. - DOI - PubMed
    1. Koeppel F, Poindessous V, Lazar V, Raymond E, Sarasin A, Larsen AK. Irofulven cytotoxicity depends on transcription-coupled nucleotide excision repair and is correlated with XPG expression in solid tumor cells. Clin Cancer Res. 2004;10:5604–5613. doi: 10.1158/1078-0432.CCR-04-0442. - DOI - PubMed