Review
. 2021 Mar 2;13(1):24.
doi: 10.1186/s13098-021-00640-9.

The effect of vitamin C supplementation on lipid profile of type 2 diabetic patients: a systematic review and meta-analysis of clinical trials

Affiliations
Review

The effect of vitamin C supplementation on lipid profile of type 2 diabetic patients: a systematic review and meta-analysis of clinical trials

Amare Abera Tareke et al. Diabetol Metab Syndr. .

Abstract

Background and aims: We conducted a systematic review and meta-analysis of clinical trials evaluating the role of vitamin C supplementation on lipid profiles among diabetic patients to summarize the available findings.

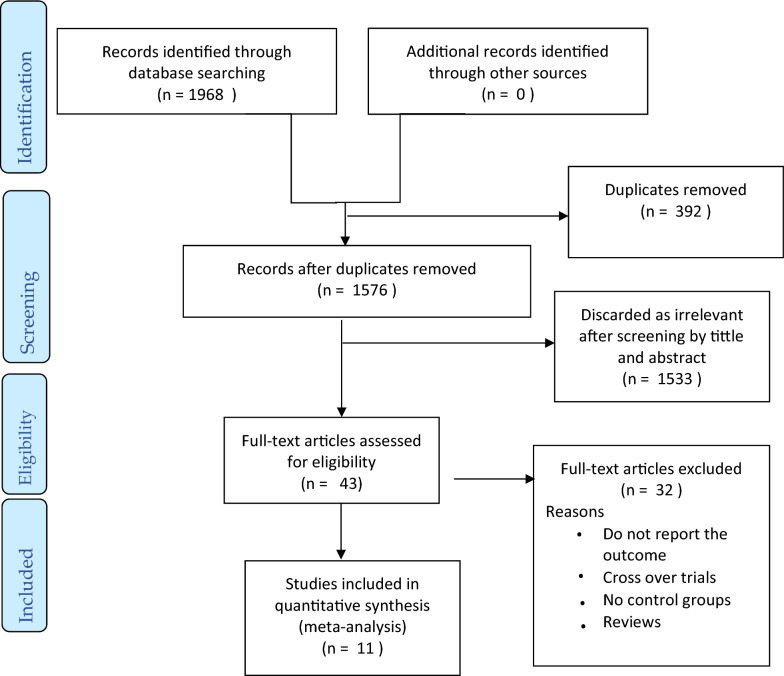
Methods: A comprehensive search of PubMed, ScienceDirect, Google Scholar, and Cochrane Library databases was performed. Clinical trials conducted on adult type 2 diabetic patients evaluating the effect of vitamin C supplementation and reported lipid profiles (cholesterol (TC), triglycerides (TG), low density lipoprotein (LDL), high density lipoprotein (HDL)) were included. Weighted mean difference (WMD) was calculated.

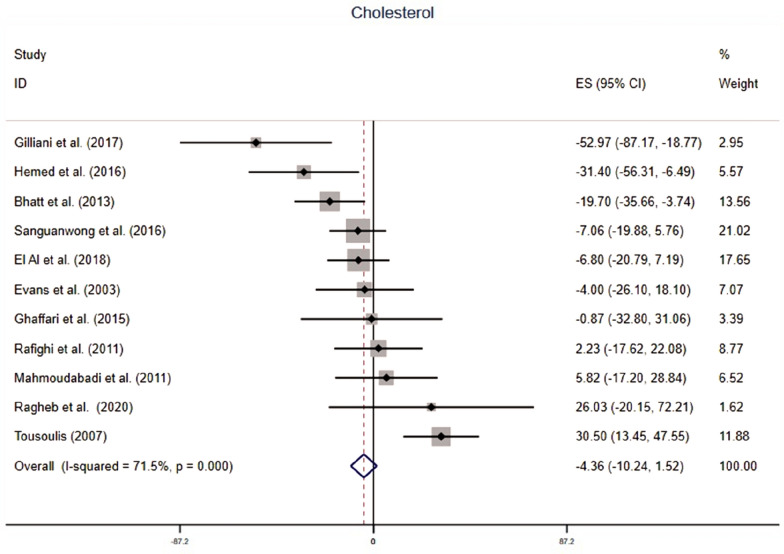
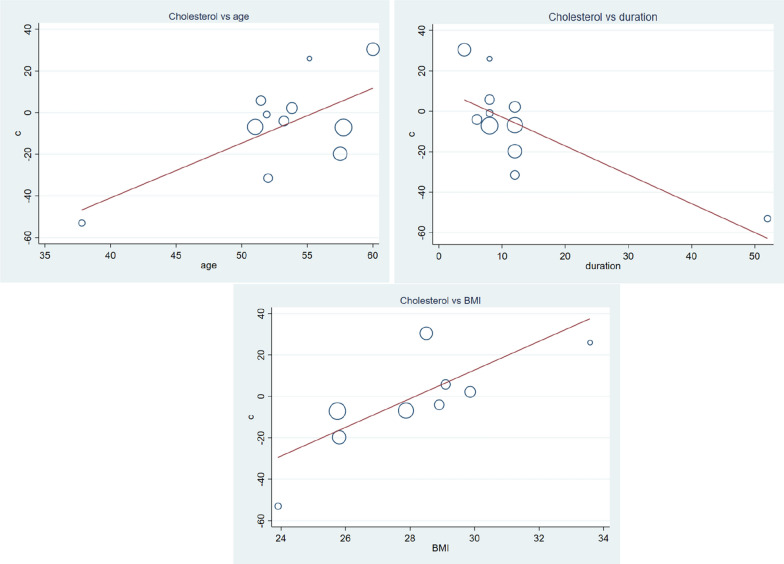
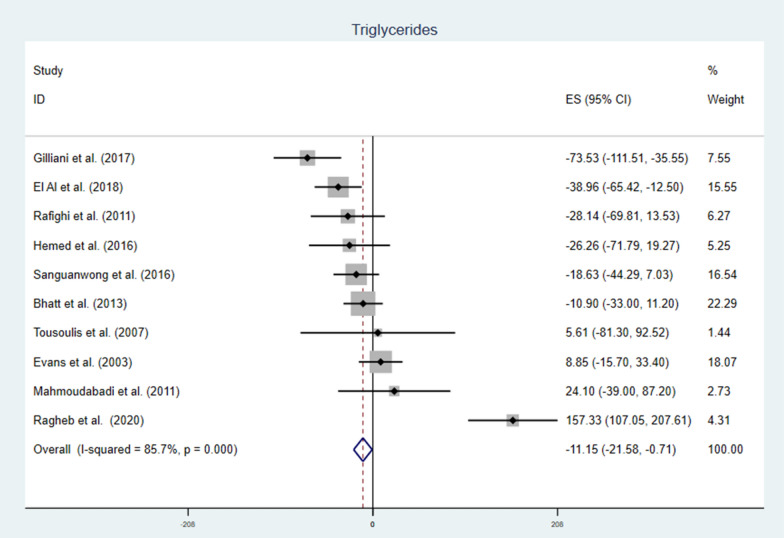
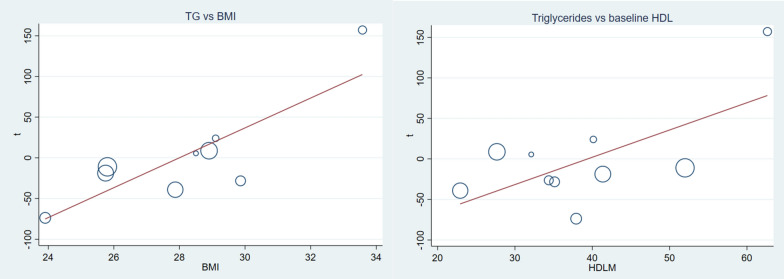
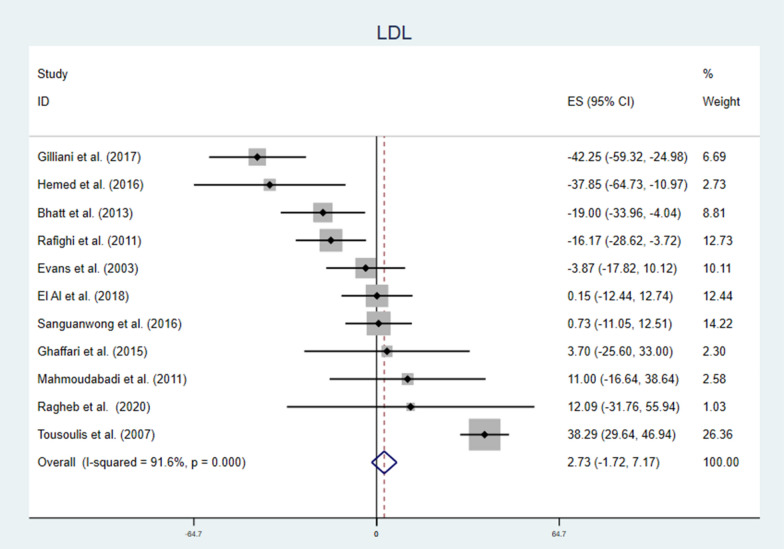
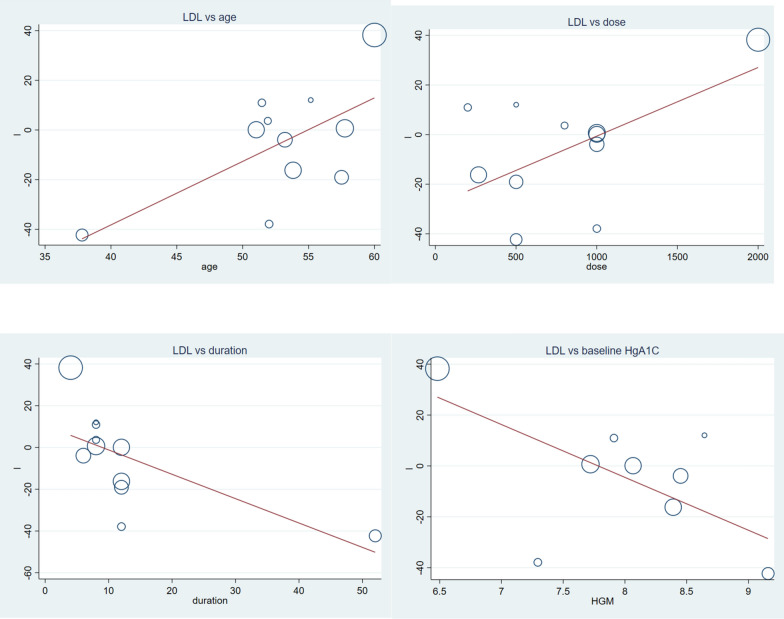
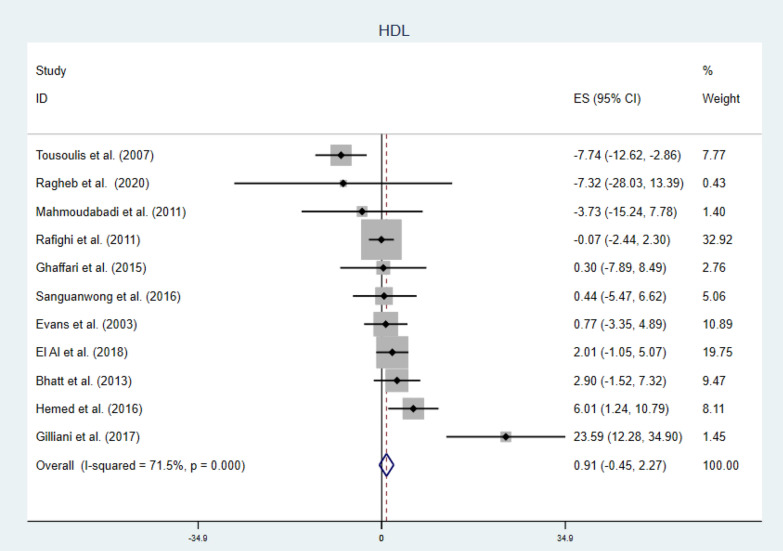
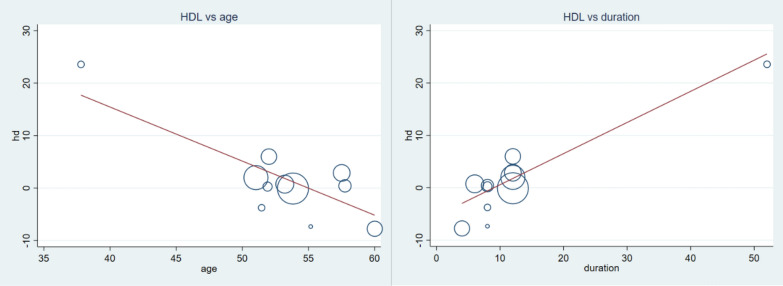
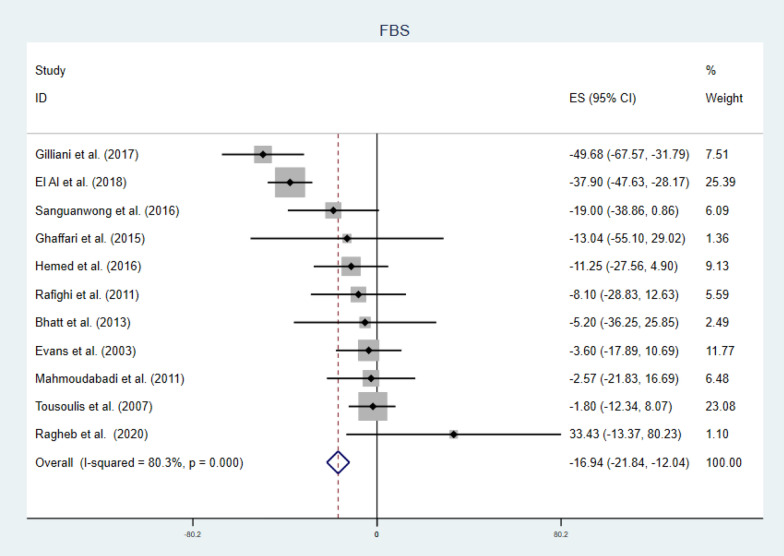
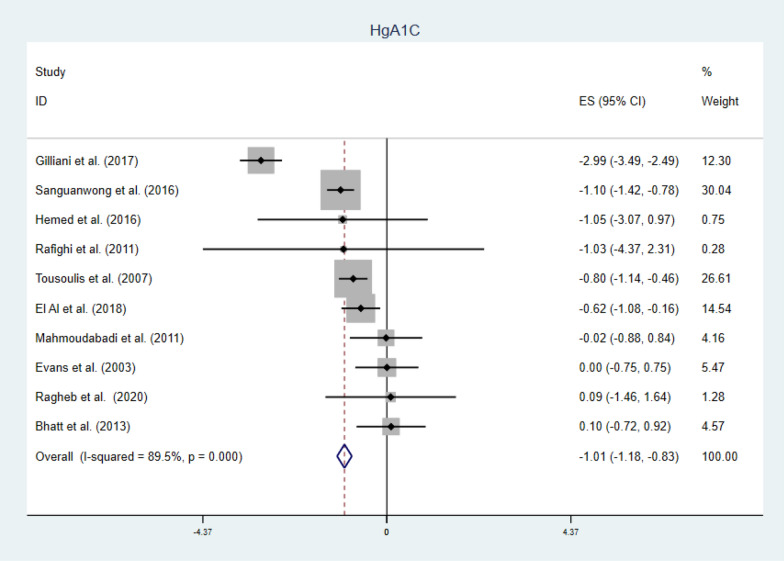
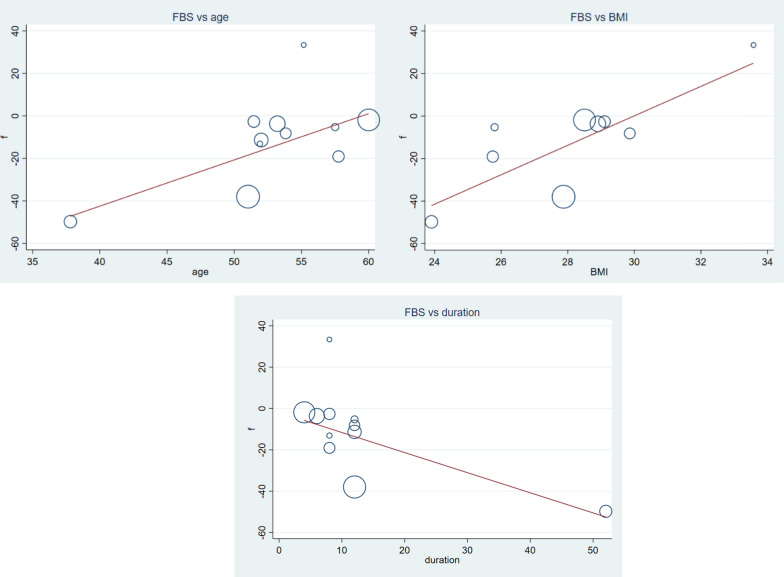
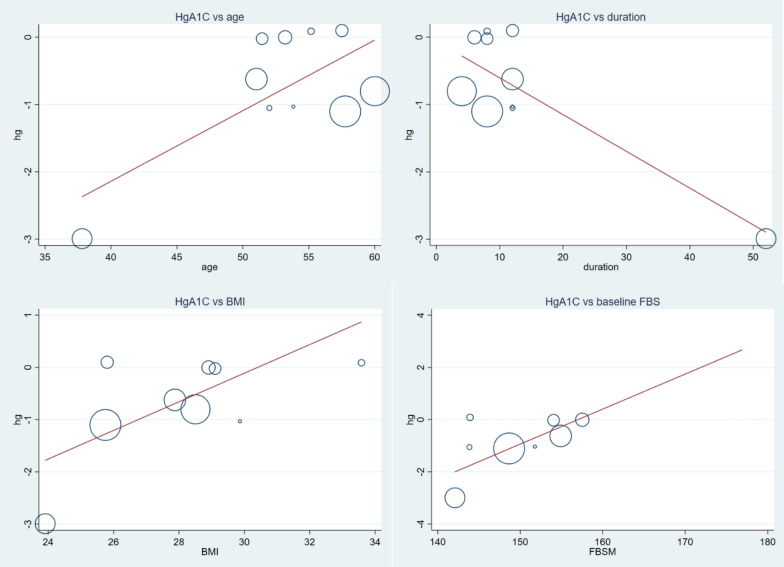
Results: Vitamin C supplementation had no significant effect on TC (WMD = - 4.36 mg/dl (95% CI - 10.24, 1.52) p-value = 0.146), LDL level (WMD = 2.73 mg/dl (95% CI - 1.72, 7.17) p-value = 0.229), and HDL level (WMD = 0.91 mg/dl (CI - 0.45, 2.27) p-value = 0.191). However, it reduced TG and secondary outcomes (FBS and HgA1C): TG (WMD = - 11.15 mg/dl (95% CI - 21.58, - 0.71) p-value = 0.036), FBS (WMD = - 16.94 mg/dl CI - 21.84, - 12.04, p-value = 0.000), and HgA1C (WMD = - 1.01% CI - 1.18, - 0.83, p-value = 0.001. Subgroup analysis also depicted younger patients, longer duration of treatment and higher dose were important factors. In addition, meta-regression analysis indicated the significant role of patient age, duration of treatment, supplementation dose, BMI and other baseline variables.

Conclusion: There is no adequate evidence to support vitamin C supplementation for dyslipidemias in diabetic patients. Specific group of patients might have benefited including younger diabetic patients. Future researches should give emphasis on the duration of treatment, the dose of vitamin C and baseline values.

Keywords: Diabetes mellitus; Dyslipidemia; Lipid profiles; Meta-analysis; Vitamin C.


Conflict of interest statement

The authors have declared that there are no competing interests.

Figures

Fig. 1
Fig. 1
PRISMA flow diagram of study selection to determine the effect of vitamin C on lipid profile among diabetic patients
Fig. 2
Fig. 2
The effect of vitamin C supplementation of serum cholesterol among type 2 diabetic patients. There was no significant reduction in total cholesterol due to vitamin C. With moderate heterogeneity, the weighted mean difference was − 4.36 mg/dl CI − 10.24–1.52 and p-value = 0.146
Fig. 3
Fig. 3
Meta-regression analysis of the effect of vitamin C supplementation on serum cholesterol of type 2 diabetic patients; the influence of covariates patients mean age, duration of supplementation and baseline BMI. As indicated, WMD increases with increment in age, BMI and decrement in duration. The higher reduction was observed in younger type 2 DM patients (β = 2.63, CI 0.22–5.04, p-value = 0.036), longer duration of treatment (β = -1.42, CI − 2.48, − 0.36, p-value = 0.014), and lower BMI (β = 6.92, CI 1.02–12.82, p-value = 0.028)
Fig. 4
Fig. 4
The effect of vitamin C supplementation of serum triglycerides among type 2 diabetic patients. There was a significant reduction in triglyceride level due to vitamin C. With significant heterogeneity, the weighted mean difference was -11.15 mg/dl CI − 21.58, − 0.71 and p-value = 0.036
Fig. 5
Fig. 5
Covariate affecting WMD of triglycerides; baseline BMI and baseline HDL level. HDL (β = 3.36 CI 0.09, 6.63: p-value = 0.045) and BMI (β = 18.35 CI 6.83, 29.88 p-value = 0.007). the reduction was pronounced in lower baseline HDL and BMI
Fig. 6
Fig. 6
Forest plot showing the effect of vitamin C supplementation on serum LDL among diabetic patients. There was no significant change in serum LDL, there was also significant heterogeneity
Fig. 7
Fig. 7
The association between LDL concentration measured as weighted mean difference and various factors. Younger age (β = 2.85 CI 0.29, 4.82: p-value = 0.031), lower dose (β = 0.02 CI: 0.00, 0.05: p-value = 0.039), longer duration (β = − 1.16 CI − 2.17, -0.16: p-value = 0.027) and higher baseline HgA1C (β = − 20.77 CI − 41.32, − 0.22: p-value = 0.048) were advantageous circumstances for vitamin C effect
Fig. 8
Fig. 8
Forest plot showing no significant change in serum HDL in diabetic patients by vitamin C supplementation
Fig. 9
Fig. 9
Meta-regression analysis showing the association of HDL concentration (WMD), and mean age and supplementation duration. Increment in HDL was associated with younger (β = − 1.03 CI − 1.63, − 0.42: p-value = 0.004) and longer duration (β = 0.59 CI 0.29, 0.89: p-value = 0.001) of treatment
Fig. 10
Fig. 10
Forest plot of WMD of FBS, indicating significant reduction by vitamin C supplementation in type 2 DM
Fig. 11
Fig. 11
Forest plot of WMD of HgA1C (%), indicating significant reduction by vitamin C supplementation in type 2 DM
Fig. 12
Fig. 12
The association between FBS and covariates; age, duration of treatment and BMI. Reduction in FBS was associated with younger (β = 2.17 CI 0.47, 3.87: p-value = 0.018) and longer duration (β = − 0.97 CI − 1.73, − 0.21: p-value = 0.018) of treatment and lower BMI (β = 6.29 CI 1.23, 12.61: p-value = 0.024)
Fig. 13
Fig. 13
Meta-regression analysis showing the association of HgA1C concentration (WMD), and mean age, supplementation duration, BMI and baseline FBS. Decrement in HgA1C was associated with younger (β = 0.10 CI 0.01, 0.19: p-value = 0.032) and longer duration (β = − 0.05 CI − 0.08, − 0.02: p-value = 0.003) of treatment, lower BMI (β = 0.27 CI 0.00, 0.54: p-value = 0.049) and lower baseline FBS (β = 0.13 CI 0.005, 0.262: p-value = 0.044)

References

    1. Howard BV. Insulin resistance and lipid metabolism. Am J Cardiol. 1999;84:28–32. doi: 10.1016/S0002-9149(99)00355-0. - DOI - PubMed
    1. Steinberger J, Moorehead C, Katch V, Rocchini AP. Relationship between insulin resistance and abnormal lipid profile in obese adolescents. J Pediatr. 1995;126:690–695. doi: 10.1016/S0022-3476(95)70394-2. - DOI - PubMed
    1. Suryawanshi NP, Bhutey AK, Nagdeote AN, Jadhav AA, Manoorkar GS. Study of lipid peroxide and lipid profile in diabetes mellitus. Indian J Clin Biochem. 2006;21:126. doi: 10.1007/BF02913080. - DOI - PMC - PubMed
    1. Reaven GM, Chen YD, Jeppesen J, Maheux P, Krauss RM. Insulin resistance and hyperinsulinemia in individuals with small, dense low density lipoprotein particles. J Clin Invest. 1993;92:141–146. doi: 10.1172/JCI116541. - DOI - PMC - PubMed
    1. Katz LEL, Bacha F, Gidding SS, Weinstock RS, Ghormli LE, Libman I, et al. Lipid profiles, inflammatory markers, and insulin therapy in youth with type 2 diabetes. J Pediatr. 2018;196(208–216):e2. doi: 10.1016/j.jpeds.2017.12.052. - DOI - PMC - PubMed

LinkOut - more resources