. 2021 Mar 2;12(2):e03419-20.
doi: 10.1128/mBio.03419-20.

Chitosan and Chitin Deacetylase Activity Are Necessary for Development and Virulence of Ustilago maydis

Affiliations

Chitosan and Chitin Deacetylase Activity Are Necessary for Development and Virulence of Ustilago maydis

Yanina S Rizzi et al. mBio. .

Abstract

The biotrophic fungus Ustilago maydis harbors a chitin deacetylase (CDA) family of six active genes as well as one pseudogene which are differentially expressed during colonization. This includes one secreted soluble CDA (Cda4) and five putatively glycosylphosphatidylinositol (GPI)-anchored CDAs, of which Cda7 belongs to a new class of fungal CDAs. Here, we provide a comprehensive functional study of the entire family. While budding cells of U. maydis showed a discrete pattern of chitosan staining, biotrophic hyphae appeared surrounded by a chitosan layer. We purified all six active CDAs and show their activity on different chitin substrates. Single as well as multiple cda mutants were generated and revealed a virulence defect for mutants lacking cda7 We implicated cda4 in production of the chitosan layer surrounding biotrophic hyphae and demonstrated that the loss of this layer does not reduce virulence. By combining different cda mutations, we detected redundancy as well as specific functions for certain CDAs. Specifically, certain combinations of mutations significantly affected virulence concomitantly with reduced adherence, appressorium formation, penetration, and activation of plant defenses. Attempts to inactivate all seven cda genes simultaneously were unsuccessful, and induced depletion of cda2 in a background lacking the other six cda genes illustrated an essential role of chitosan for cell wall integrity.IMPORTANCE The basidiomycete Ustilago maydis causes smut disease in maize, causing substantial losses in world corn production. This nonobligate pathogen penetrates the plant cell wall with the help of appressoria and then establishes an extensive biotrophic interaction, where the hyphae are tightly encased by the plant plasma membrane. For successful invasion and development in plant tissue, recognition of conserved fungal cell wall components such as chitin by the plant immune system needs to be avoided or suppressed. One strategy to achieve this lies in the modification of chitin to chitosan by chitin deacetylases (CDAs). U. maydis has seven cda genes. This study reveals discrete as well as redundant contributions of these genes to virulence as well as to cell wall integrity. Unexpectedly, the inactivation of all seven genes is not tolerated, revealing an essential role of chitosan for viability.

Keywords: Ustilago maydis; Zea mays; chitin; chitin deacetylase; chitosan; viability; virulence.


Figures

FIG 1
FIG 1
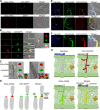
Chitosan and chitin accessibility during different phases of development of U. maydis strain SG200. (A) Budding cells were stained with CAP-sfGFP and WGA-AF594 (top) or with sfGFP and WGA-AF594 as control (bottom). Cells were observed by fluorescence microscopy (left, chitin in red; middle, chitosan in green; right, merge of bright field, chitin, and chitosan staining). Scale bars, 10 μm. Representative pictures are from at least three independent experiments. (B) Enlargements of the stippled boxes marked in panel A, except for the rightmost picture showing the division zone of a budding cell where the daughter cell is almost mature. Scale bars, 5 μm. (C) Three-dimensional (3D) reconstruction of the bud scar region (left) as well as the division zone in budding cell (right) stained with CAP-sfGFP and WGA-AF594 by confocal microscopy. The stippled zones in the left panels are enlarged on the right and shown as top view in addition (far right). Scale bars, 5 μm. (D) Scheme showing the distribution of chitin (WGA-AF594, red; left), chitosan (CAP-sfGFP, green; middle), and merged in budding cells with and without a bud. (E) Staining of hyphae during infection at 2 dpi: calcofluor staining (blue) of hyphae on the surface of the plant leaves, WGA-AF488 staining of chitin (green), CAP-mKATE2 staining of chitosan (red), and merged with bright field are shown at the top. Staining in the bottom images was as for the top except that CAP-mKATE2 was replaced with mKATE2 as a nonbinding control. White arrowheads indicate appressoria. The samples were observed by confocal microscopy and all images are projections of multiple z-stacks. Scale bars, 10 μm. Representative pictures from at least three independent experiments are shown. (F) Enlargements of the stippled boxes marked in panel E. White arrowheads indicate appressoria. Scale bar, 10 μm. (G) Scheme showing the staining of hyphae on the leaf surface with calcofluor (blue, top left), distribution of chitin (WGA-AF488, green; bottom left), chitosan (CAP-mKATE2, red; top right), and merged (bottom right).
FIG 2
FIG 2
The CDA gene family in U. maydis. (A) Schematic of the seven putative CDA proteins indicating a predicted signal peptide (orange), a predicted GPI anchor (green), and the NodB homology domain (blue). The numbers on the right refer to amino acids. Brackets indicate that cda6 is likely a pseudogene, and the protein annotated in NCBI under accession number 23565582 might be incorrect. (B) Expression pattern of cda genes during growth in axenic culture and at different time points (0.5, 1, 2, 4, 6, 8, and 12 days) during plant infection with FB1 × FB2. Data were retrieved from an RNA-seq analysis (29). Error bars indicate ± standard deviation (SD).
FIG 3
FIG 3
Colony morphology and chitin and chitosan staining of strains lacking single cda genes. (A) Cultures of the indicated U. maydis strains were spotted onto PD-agar for growth as budding cells (top) and on PD-charcoal for growth as cells producing aerial filaments (bottom). Pictures were taken after 2 days of incubation (top) and 1 day of incubation (bottom). Representative pictures from three independent experiments are shown. (B) Budding cells in exponential phase were stained with WGA-AF594 to detect chitin (red; top) or CAP-sfGFP to detect chitosan (green; middle); at the bottom, channels are merged with the bright-field channel. Scale bars, 10 μm. Representative pictures from three experiments are shown. (C) Enlargements of the stippled boxes marked in panel B. Scale bars, 10 μm.
FIG 4
FIG 4
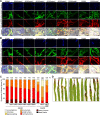
Chitin and chitosan staining of biotrophic hyphae and virulence of single cda mutant strains. (A) Staining of hyphae during colonization at 2 dpi. Hyphae of the indicated strains on the surface of the plant leaf are stained with calcofluor (blue; top), chitin is visualized by WGA-AF488 staining (green; second row), and chitosan with CAP-mKATE2 staining (red; third row). In the bottom row, channels are merged with the bright-field channel. Samples were observed by confocal microscopy, and all images are projections of multiples z-stacks. Scale bars, 10 μm. Representative pictures from three independent experiments are shown. (B) Enlargements of the stippled boxes marked in panel A. Scale bars, 10 μm. (C) Virulence assay for the strains shown in panel A as well as the complementation strain for Δcda7, SG200 Δcda7-cda7. Disease symptoms were scored at 12 dpi according to severity using the color code at the bottom. Three independent experiments were performed, and average values are expressed as a percentage of the total number of infected plants (n), which is given at the top of each column. Significant differences (Games-Howell test) in virulence compared with SG200 are indicated. ***, P < 0.001. (D) Macroscopic symptoms of plant leaves infected with the indicated strains at 12 dpi.
FIG 5
FIG 5
Chitin and chitosan staining and colony morphology of strains lacking multiple cda genes. (A) Budding cells in exponential phase of the indicated strains were stained with WGA-AF594 to detect chitin (red; top) and with CAP-sfGFP to detect chitosan (green; middle); at the bottom, channels are merged with the bright-field channel. Scale bars, 10 μm. Representative pictures from two or more experiments are shown. (B) Enlargements of the stippled boxes marked in panel A. Scale bars, 10 μm. (C) Cultures of the indicated U. maydis strains were spotted onto PD-agar for growth as budding cells (top) and on PD-charcoal for growth as cells producing aerial filaments (bottom). Pictures were taken after 2 days of incubation (top) and 1 day of incubation (bottom). (D) Pedigree of strains containing multiple inactivated cda genes.
FIG 6
FIG 6
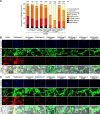
Virulence and chitin and chitosan staining of biotrophic hyphae of multiple cda gene mutants. (A) Virulence assay for the indicated strains. Symptoms were scored at 12 dpi according to severity using the color code on the right. Three independent experiments were performed, and average values are expressed as a percentage of the total number of infected plants (n), which is given at the top of each column. Significant differences (Games-Howell test) in virulence compared with SG200 are indicated. **, P < 0.005; ***, P < 0.001. (B) Staining of hyphae of the indicated mutants during colonization at 2 dpi. Hyphae on the surface of the plant leaf are stained with calcofluor (blue; top), chitin is visualized by WGA-AF488 staining (green; second row), and chitosan with CAP-mKATE2 staining (red; third row). In the bottom row, all channels are merged with the bright-field channel. Samples were observed by confocal microscopy, and all images are projections of multiple z-stacks. Scale bars, 10 μm. Representative pictures from at least two independent experiments are shown. (C) Enlargements of the stippled boxes marked in panel B. Scale bars, 10 μm.
FIG 7
FIG 7
Viability of U. maydis strains lacking all cda genes. (A) Growth of strains indicated on top was assessed on CM-arabinose (left) and on CM-glucose (right). Plates were incubated for 4 days at 28°C. (B) Morphological changes in cell shape after the depletion of cda2 in SG200 cda1,3,4,5,6emΔ7,Pcrg:cda2. Indicated strains were initially grown in liquid CM containing 1% arabinose and, after adjusting the OD600 to 0.2, shifted to liquid CM containing 1% arabinose as control (left) or to liquid CM containing 1% glucose, where cda2 is successively depleted (right). The cultures were observed microscopically at 2, 4, 8, and 24 h postshift. White arrows show bipolar growth. (C) DAPI staining of SG200 cda1,3,4,5,6emΔ7,Pcrg:cda2, after 24 h of shift to liquid CM containing 1% arabinose as a control or liquid CM containing 1% glucose. Consecutive pictures were taken in one stack, and maximal projections are shown. DAPI and bright-field (BF) pictures are shown. On the right, enlarged pictures of the stippled areas are displayed.

References

    1. Akamatsu A, Wong HL, Fujiwara M, Okuda J, Nishide K, Uno K, Imai K, Umemura K, Kawasaki T, Kawano Y, Shimamoto K. 2013. An OsCEBiP/OsCERK1-OsRacGEF1-OsRac1 module is an essential early component of chitin-induced rice immunity. Cell Host Microbe 13:465–476. doi:10.1016/j.chom.2013.03.007. - DOI - PubMed
    1. Hayafune M, Berisio R, Marchetti R, Silipo A, Kayama M, Desaki Y, Arima S, Squeglia F, Ruggiero A, Tokuyasu K, Molinaro A, Kaku H, Shibuya N. 2014. Chitin-induced activation of immune signaling by the rice receptor CEBiP relies on a unique sandwich-type dimerization. Proc Natl Acad Sci U S A 111:E404–E413. doi:10.1073/pnas.1312099111. - DOI - PMC - PubMed
    1. Liu T, Liu Z, Song C, Hu Y, Han Z, She J, Fan F, Wang J, Jin C, Chang J, Zhou JM, Chai J. 2012. Chitin-induced dimerization activates a plant immune receptor. Science 336:1160–1164. doi:10.1126/science.1218867. - DOI - PubMed
    1. Gubaeva E, Gubaev A, Melcher RLJ, Cord-Landwehr S, Singh R, El Gueddari NE, Moerschbacher BM. 2018. 'Slipped sandwich' model for chitin and chitosan perception in arabidopsis. Mol Plant Microbe Interact 31:1145–1153. doi:10.1094/MPMI-04-18-0098-R. - DOI - PubMed
    1. Fujikawa T, Kuga Y, Yano S, Yoshimi A, Tachiki T, Abe K, Nishimura M. 2009. Dynamics of cell wall components of Magnaporthe grisea during infectious structure development. Mol Microbiol 73:553–570. doi:10.1111/j.1365-2958.2009.06786.x. - DOI - PubMed

Publication types

Supplementary concepts