. 2021 Mar 9;118(10):e2003014118.
doi: 10.1073/pnas.2003014118.

Adaptation of pancreatic cancer cells to nutrient deprivation is reversible and requires glutamine synthetase stabilization by mTORC1

Affiliations

Adaptation of pancreatic cancer cells to nutrient deprivation is reversible and requires glutamine synthetase stabilization by mTORC1

Pei-Yun Tsai et al. Proc Natl Acad Sci U S A. .

Abstract

Pancreatic ductal adenocarcinoma (PDA) is a lethal, therapy-resistant cancer that thrives in a highly desmoplastic, nutrient-deprived microenvironment. Several studies investigated the effects of depriving PDA of either glucose or glutamine alone. However, the consequences on PDA growth and metabolism of limiting both preferred nutrients have remained largely unknown. Here, we report the selection for clonal human PDA cells that survive and adapt to limiting levels of both glucose and glutamine. We find that adapted clones exhibit increased growth in vitro and enhanced tumor-forming capacity in vivo. Mechanistically, adapted clones share common transcriptional and metabolic programs, including amino acid use for de novo glutamine and nucleotide synthesis. They also display enhanced mTORC1 activity that prevents the proteasomal degradation of glutamine synthetase (GS), the rate-limiting enzyme for glutamine synthesis. This phenotype is notably reversible, with PDA cells acquiring alterations in open chromatin upon adaptation. Silencing of GS suppresses the enhanced growth of adapted cells and mitigates tumor growth. These findings identify nongenetic adaptations to nutrient deprivation in PDA and highlight GS as a dependency that could be targeted therapeutically in pancreatic cancer patients.

Keywords: epigenetics; glutamine synthetase; mTORC1; nutrient deprivation; pancreatic cancer.


Conflict of interest statement

The authors declare no competing interest.

Figures
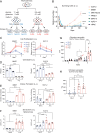
Fig. 1.
Fig. 1.
PDA cells adapted to nutrient deprivation exhibit enhanced growth in vitro and in vivo. (A) Schematic depicting the adaptation process to glucose and glutamine deprivation, followed by selection of adapted “A” clones (C4 to C6) derived from SUIT-2 or 8988T human PDA cells that survived and grew in low glucose-low glutamine (L-L) medium, and control nonadapted “NA” clones (C1 to C3) derived from parental cells plated at low dilution in high glucose-high glutamine (H-H) medium. (B) Relative number of surviving cells from all seven PDA cell lines that were subjected to L-L medium for a period of 65 d (n = 3). (C) Proliferation curves of clonal cells described in A that were grown in L-L medium for 7 d (n = 5 for SUIT-2 and n = 8 for 8988T). (D) Percent cell death in clones described in A (n = 5 for SUIT-2 and n = 8 for 8988T) that was quantified on day 4 (SUIT-2) or day 5 (8988T) of growth in L-L medium. (E) Colony formation assay showing number of colonies formed by SUIT-2 or 8988T clones described in A that were grown in L-L medium for 7 d (n = 6 for SUIT-2 and n = 3 for 8988T). (F) Three-dimensional growth assay showing area of spheres formed by SUIT-2 or 8988T cells described in A that were grown for 7 d or 10 d, respectively, in L-L medium supplemented with 4% Matrigel (n = 6 for SUIT-2 and n = 8 for 8988T). (G) Volumes of orthotopic xenograft PDA tumors quantified by ultrasound that were derived from SUIT-2 clones described in A and injected (750 × 103 cells) into the pancreas of 4- to 6-wk-old Rag1−/− mice. Tumors were grown for 43 d (n = 7 except for NA-C1, n = 6); red arrow points at the two largest A-C5 tumors at week 4 from mice that died before the week 6 endpoint. (H) Weights of orthotopic xenograft SUIT-2 tumors described in G that were analyzed at the endpoint, 6 wk posttumor cell injection. Data represent the mean ± SEM in B and C, or mean ± SD in DH. *P < 0.05; **P < 0.01; ***P < 0.001; ****P < 0.0001, two-way ANOVA for B, C, and G and one-way ANOVA for (D, F, and H) followed by a Tukey test.
Fig. 2.
Fig. 2.
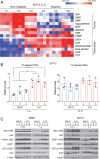
Adapted PDA clones display enhanced de novo DNA synthesis and mTORC1 signaling under nutrient-deprived conditions. (A) Heatmap listing in descending order of statistical significance (P < 0.05 by t test) metabolites in the purine and pyrimidine synthesis pathways for nonadapted (C1 to C3) or adapted (C4 to C5) SUIT-2 clones that were treated for 24 h with L-L medium (n = 4 replicates per clone). Red indicates higher level and blue lower level, relative to the median for each metabolite across all groups. (B) Relative incorporation of radiolabeled U-14C-aspartate into DNA synthesis in nonadapted (NA-C) and adapted (AC) SUIT-2 clones treated with either L-L or H-H medium for 40 h. Data are presented as relative fold change normalized to NA-C1 under L-L conditions and represent the mean ± SD (n = 3 replicates per clone). *P < 0.05; **P < 0.01, one-way ANOVA followed by a Tukey test. (C) Immunoblots of pT389-S6K, pS65-4EBP1, pS1859-CAD, and total S6K, 4EBP1, CAD in SUIT-2 or 8988T clones treated with H-H or L-L medium for 24 h. β-Actin was used as loading control.
Fig. 3.
Fig. 3.
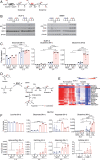
Adapted PDA cells induce GS and have enhanced incorporation of nitrogen from amino acids into glutamine and nucleotide synthesis. (A) Schematic illustrating glutamate synthesis from α-ketoglutarate (α-KG) and ammonia by glutamate dehydrogenase (GDH) and glutamine synthesis from glutamate and ammonia by glutamine synthetase (GS). In red, are ammonia nitrogens incorporating into glutamate and then glutamine. (B) Immunoblots of GS (low and high exposures) and GDH in SUIT-2 or 8988T clones treated with H-H or L-L medium for 24 h. β-Actin was used as loading control. (C) Fractional labeling of 15N-glutamate and glutamine in SUIT-2 cells treated for 24 h with H-H or L-L medium supplemented with 0.8 mM 15N-ammonium chloride. Data are corrected for natural abundance and represent the average of four replicates per clone per condition ± SD. (D) Schematic illustrating the incorporation of leucine nitrogen (red) into glutamate and then aspartate via transamination reactions catalyzed by branched chain amino acid transaminase BCAT and aspartate transaminase GOT. Glutamate is used to synthesize glutamine via GS and aspartate nitrogen incorporates into newly synthesized nucleotides. (E) Heatmap listing in descending order of statistical significance (P < 0.05 by t test) amino acids in nonadapted or adapted SUIT-2 clones that were treated for 24 h with L-L medium (n = 4 per clone per condition). Red indicates higher level and blue lower level, relative to the median for each metabolite across all groups. (F) Fractional labeling of metabolites in glutamine and nucleotide synthesis pathways in cells described in B grown in media supplemented with 0.4 mM 15N-leucine for 24 h. Data represent the average of four replicates per clone per condition ± SD *P < 0.05; **P < 0.01; ****P < 0.0001, two-way ANOVA for C, one-way ANOVA for F except for “glutamine” (two-way ANOVA), followed by a Tukey test.
Fig. 4.
Fig. 4.
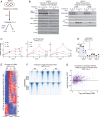
PDA adaptation to nutrient deprivation is reversible and associated with changes in open chromatin. (A) Schematic depicting the adaptation reversal process where adapted PDA SUIT-2 clones are grown in nutrient replete (H-H) conditions for at least 4 passages, prior to treatment with H-H or L-L medium for 24 h. (B) Immunoblots of pT389-S6K (low and high exposures), pS65-4EBP1, pS1859-CAD, and total S6K, 4EBP1, CAD, and GS (low and high exposures) in SUIT-2 clones (C5, C4, and C6) that were reverse adapted for over 4 passages and then treated with H-H or L-L medium for 24 h. β-Actin or GAPDH was used as loading control. (C) Proliferation curves of SUIT-2 clones C5, C4, and C6 from B that are either adapted “A” or reverse adapted “RA” for 18 passages, as compared with nonadapted “NA” clones C2, C1, or C3. All clones were grown under L-L conditions for 7 d without media replenishment (n = 6). (D) Percent cell death in clones described in C that were grown under L-L medium for 5 d (n = 6). Data represent the mean ± SEM in C, and mean ± SD in D. *P < 0.05; **P < 0.01; ****P < 0.0001, two-way ANOVA for C and one-way ANOVA for D, followed by a Tukey test. In C, stars indicate statistical significance for A vs. NA; A vs. RA; RA vs. NA on the indicated days. (E) Relative mRNA levels of 1,842 genes that were either up-regulated or down-regulated (more than threefold, q < 0.05) in SUIT-2 adapted clones compared with nonadapted clones; mRNA levels of the corresponding genes in “RA” clones (reverse-adapted for 9 passages), are shown alongside. All clones were treated for 24 h with L-L medium. Differentially expressed genes were identified by unsupervised k-means clustering. Red, high expression; blue, reduced expression relative to mean expression levels for each gene across all groups (n = 3 clones per group). (F) ATAC-Seq data showing significant (more than twofold, q < 0.05) changes in chromatin access at enhancers (located >500 bp from transcription start sites) in each of two independent SUIT-2 clones that were either nonadapted (NA), adapted (A), or reverse-adapted (RA) for 5 passages. All clones were treated for 24 h with L-L medium. (G) Correlation of changes in gene expression and nearby (<25 kb) chromatin accessibility for the genes that were induced upon adaptation to nutrient deprivation in SUIT-2 cells. Each dot represents a gene. More gene-linked enhancers (<25 kb) show gains than show losses in accessibility.
Fig. 5.
Fig. 5.
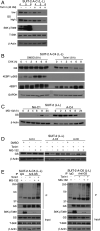
mTORC1 stabilizes GS protein levels under glutamine deprivation. (A) Immunoblots of GS (low and high exposures), pT389-S6K, and total S6K in SUIT-2 adapted clones (C4 to C6) that were treated with vehicle control dimethyl sulfoxide (DMSO) or Torin 1 (40 nM) in L-L medium for 24 h. (B) Immunoblots of GS, pS65-4EBP1, and total 4EBP1 in SUIT-2 adapted clonal cells (A-C4) that were pretreated under L-L medium with control DMSO (all six lanes on the Left) or Torin 1 (200 nM, all six lanes on the Right) for a total of 8 h. Cycloheximide (CHX, 20 μg ml−1) was either not added (0 h) or added as a cotreatment to the cells, for the indicated times (1, 2, 4, 6, or 8 h). (C) GS protein levels in nonadapted (C1) and adapted (C4) SUIT-2 clones treated in L-L medium with MG-132 (10 μM) for the indicated times. (D) GS protein levels in SUIT-2 adapted clones treated in L-L medium with either Torin 1 (200 nM) or MG-132 (10 μM) alone, or in combination for 12 h (C4) or 8 h (C5, C6). (E) Coimmunoprecipitation (IP) blots showing the ubiquitination status of GS in SUIT-2 adapted clones treated in L-L medium, with either Torin 1 (200 nM) or MG-132 (10 μM) alone, or in combination for 8 h. Input refers to immunoblots of total GS, pT389-S6K, and total S6K levels in whole cell lysates. In AE, β-actin or GAPDH was used as loading control.
Fig. 6.
Fig. 6.
GS is required for the adaptation-induced growth fitness of PDA cells under nutrient deprivation. (A) Proliferation curves of adapted SUIT-2 clonal cells transfected with Dox-inducible shScrambled control or shGS hairpins 1 and 2, grown in L-L medium for 7 d in the absence or presence of 1 μg ml−1 Dox (n = 8). (B) Percent cell death in cells described in A (n = 8) that were grown in L-L medium for 7 d. (C) Colony formation assay for cells in A that were grown for 10 d, under L-L conditions (n = 6). (D) Weights of orthotopic xenograft PDA tumors derived from SUIT-2 adapted cells (C4) stably expressing Dox-inducible hairpins described in A that were injected (750 × 103 cells) into the pancreas of 4- to 6-wk-old Rag1−/− mice. Dox was supplemented in the drinking water (2 mg ml−1) 5 d postinjection of cells, and tumors were harvested 33 d later (n = 5 shScr −Dox; n = 7 shScr +Dox; n = 8 shGS#1; n = 7 shGS#2). Data represent the mean ± SEM in A and mean ± SD in BD. *P < 0.05; **P < 0.01; ****P < 0.0001, two-way ANOVA followed by a Tukey test. (E) Immunoblots of GS in cells used for xenografts in D showing decreased protein levels, 48 h following treatment with Dox (1 μg ml−1) for inducible knockdown. β-Actin was used as loading control. (F) Model illustrating a role for GS stabilization in PDA cell adaptation to nutrient deprivation, which leads to enhanced growth fitness. The sketch was created using Biorender.com.

Comment in

References

    1. Siegel R. L., Miller K. D., Jemal A., Cancer statistics, 2020. CA Cancer J. Clin. 70, 7–30 (2020). - PubMed
    1. Rahib L., et al. ., Projecting cancer incidence and deaths to 2030: The unexpected burden of thyroid, liver, and pancreas cancers in the United States. Cancer Res. 74, 2913–2921 (2014). - PubMed
    1. Perera R. M., Bardeesy N., Pancreatic cancer metabolism: Breaking it down to build it back up. Cancer Discov. 5, 1247–1261 (2015). - PMC - PubMed
    1. Ying H., et al. ., Genetics and biology of pancreatic ductal adenocarcinoma. Genes Dev. 30, 355–385 (2016). - PMC - PubMed
    1. Yang S., et al. ., Pancreatic cancers require autophagy for tumor growth. Genes Dev. 25, 717–729 (2011). - PMC - PubMed

Publication types

MeSH terms

Substances