. 2021 Mar 2;11(1):149.
doi: 10.1038/s41398-021-01274-1.

Exposure to maternal high-fat diet induces extensive changes in the brain of adult offspring

Affiliations

Exposure to maternal high-fat diet induces extensive changes in the brain of adult offspring

Darren J Fernandes et al. Transl Psychiatry. .

Abstract

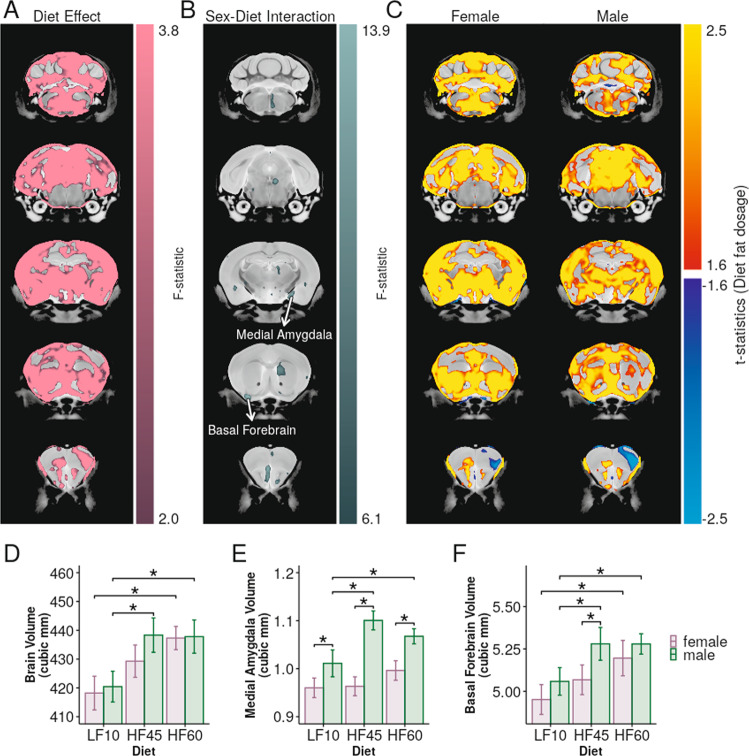
Maternal environmental exposures, such as high-fat diets, diabetes and obesity, can induce long-term effects in offspring. These effects include increased risk of neurodevelopmental disorders (NDDs) including autism spectrum disorder (ASD), depression and anxiety. The mechanisms underlying these late-life neurologic effects are unknown. In this article, we measured changes in the offspring brain and determined which brain regions are sensitive to maternal metabolic milieu and therefore may mediate NDD risk. We showed that mice exposed to a maternal high-fat diet display extensive brain changes in adulthood despite being switched to a low-fat diet at weaning. Brain regions impacted by early-life diet include the extended amygdalar system, which plays an important role in reward-seeking behaviour. Genes preferentially expressed in these regions have functions related to feeding behaviour, while also being implicated in human NDDs, such as autism. Our data demonstrated that exposure to maternal high-fat diet in early-life leads to brain alterations that persist into adulthood, even after dietary modifications.


Conflict of interest statement

The authors declare no competing interests.

Figures

Fig. 1
Fig. 1. High-fat diet induced metabolic changes in dams.
A Body weights were significantly affected by diet (χ28 = 41.8, p < 10−5), primarily driven by a diet-time interaction (χ26 = 36.9, p < 10−5). A significant difference between LF10 and HF60 groups emerged at ~2–3 weeks after the experimental diet was introduced. B Average body-fat percentage was significantly affected by diet (HF45-LF10 difference = 16.6%, p < 10−3; HF60-LF10 difference = 13.5%, p < 10−3). C GTT showed a significant difference in glucose levels 30 min. (difference = 8.04 mM, p < 10−8) and 60 min. (difference= 4.25 mM, p < 10−2) between the LF10 and the HF60 groups. All bars represent 95% confidence intervals. Asterisks represent a significant difference from LF10 (p < 0.05).
Fig. 2
Fig. 2. High-fat diet did not have a significant effect on the brain structure of dams.
A Regional volume did not show significant negative or positive correlations with dietary fat-percentage (blue/turquoise and red/yellow colour scale, respectively). B Total brain volume was not significantly affected by diet (F1,22 = 0.003, p = 0.96). Cingulate cortex area 24b and White matter of cerebellar lobule 8 had the largest effects, but were not significant (ns). C Cingulate cortex area 24b showed increased volume with increased fat-percentage (t22 = 2.5, p = 0.02,FDR = 0.92, ns). D White matter of cerebellar lobule 8 showed decreased volume with increased fat-percentage (t22 = −2.13, p = 0.045,FDR = 0.98, ns).
Fig. 3
Fig. 3. Offspring exposed to maternal high-fat diets showed amelioration of metabolic effects when weaned to a low-fat diet.
A Body weights of HF45/HF60 mice normalised after being weaned onto the low-fat diet. There was a significant diet-time interaction (χ212 = 71, p < 10−9) and confidence intervals of HF45/HF60 overlapped with LF10 mice after 2 weeks. B Body-fat composition, measured at P65, showed no significant effect of early-life diet (F2,63 = 1.20, p = 0.3). C GTT also showed no significant effect of early-life diet (χ2,16 = 23.6, p = 0.1). There was a decrease in blood glucose concentration 30 min after IP glucose administration in HF45 vs LF10 male offspring (difference = 6.63, p < 0.01). No significant decrease was found between the HF60 vs LF10 male offspring, and all female groups. All bars represent 95% confidence intervals. Asterisks represent a significant difference from LF10 (p < 0.05).
Fig. 4
Fig. 4. Offspring exposed to early-life high-fat diet exhibit extensive structural brain changes in adulthood.
A Early-life high-fat diet was found to affect the volume of several regions throughout the brain. B In some brain regions, the effect of diet was modulated by sex. C Regional brain volume was largely correlated with early-life dietary fat-percentage (red/yellow colour scale), with some regions, such as the primary motor cortex, showing negative correlations (blue/turquoise colour scale). D Total brain volume was affected by early-life diet (F2,95 = 24, p < 10−8). Volumes of the medial amygdala (E) and the basal forebrain (F) were strongly impacted by diet (F2,95 = 13, p < 10−4, FDR < 10−4 and F2,95 = 14, p < 10−5, FDR < 10−4 respectively). The medial amygdala as a whole did not have significant sex-diet interactions (F2,95 = 8.9, p < 10−3, FDR = 0.051). Colour bars show 5% FDR at saturation and extend to 20% FDR to allow visualisation of cluster extent. Error bars represent 95% confidence intervals. Asterisks represent significant group comparisons (p < 0.05). Volume and effect-sizes for all brain structures are reported in Table S1.
Fig. 5
Fig. 5. Genes expressed in brain regions sensitive to early-life diet over the course of mouse development.
Brain regions where early-life diet had a highly significant effect (FDR < 0.01) on adult neuroanatomy define the ROI (B first row). The ROI was transformed to the nissl atlases defining the ABI gene expression dataset (background images in B) and the spatial expression of genes were quantified throughout the course of postnatal development. A Three clusters of spatio-temporal gene expression were found: genes with low expression in ROI during neonatal life and increased ~P28 (Cluster 1), and genes with high expression during neonatal life and decreased during ~P28 and ~P14 (Cluster 2 and 3, respectively). Oxt (Cluster 1) was chosen as a representative example of an ASD-associated gene (image row 2 in B). Shbg and Lman1l had the highest expression in Cluster 2 and 3 respectively and shown as representative examples (image row 3 and 4 in B). Shaded regions represent 95% confidence intervals. Gene expression fold-change maps were expressed as a Z-score and masked by the ROI for visualisation.

References

    1. Stubert J, Reister F, Hartmann S, Janni W. The risks associated with obesity in pregnancy. Dtsch. Ärzteblatt Int. 2018;115:276. - PMC - PubMed
    1. Cedergren MI. Maternal morbid obesity and the risk of adverse pregnancy outcome. Obstet. Gynecol. 2004;103:219–224. doi: 10.1097/01.AOG.0000107291.46159.00. - DOI - PubMed
    1. Parlee SD, MacDougald OA. Maternal nutrition and risk of obesity in offspring: the Trojan horse of developmental plasticity. Biochim. Biophys. Acta. 2014;1842:495–506. doi: 10.1016/j.bbadis.2013.07.007. - DOI - PMC - PubMed
    1. Reynolds RM, et al. Maternal obesity during pregnancy and premature mortality from cardiovascular event in adult offspring: follow-up of 1 323 275 person years. BMJ. 2013;347:f4539. doi: 10.1136/bmj.f4539. - DOI - PMC - PubMed
    1. Grattan DR. Fetal programming from maternal obesity: eating too much for two? Endocrinology. 2008;149:5345–5347. doi: 10.1210/en.2008-1106. - DOI - PubMed

Publication types