. 2021 Mar 2;7(1):22.
doi: 10.1038/s41523-021-00229-5.

Ivermectin converts cold tumors hot and synergizes with immune checkpoint blockade for treatment of breast cancer

Affiliations

Ivermectin converts cold tumors hot and synergizes with immune checkpoint blockade for treatment of breast cancer

Dobrin Draganov et al. NPJ Breast Cancer. .

Abstract

We show that treatment with the FDA-approved anti-parasitic drug ivermectin induces immunogenic cancer cell death (ICD) and robust T cell infiltration into breast tumors. As an allosteric modulator of the ATP/P2X4/P2X7 axis which operates in both cancer and immune cells, ivermectin also selectively targets immunosuppressive populations including myeloid cells and Tregs, resulting in enhanced Teff/Tregs ratio. While neither agent alone showed efficacy in vivo, combination therapy with ivermectin and checkpoint inhibitor anti-PD1 antibody achieved synergy in limiting tumor growth (p = 0.03) and promoted complete responses (p < 0.01), also leading to immunity against contralateral re-challenge with demonstrated anti-tumor immune responses. Going beyond primary tumors, this combination achieved significant reduction in relapse after neoadjuvant (p = 0.03) and adjuvant treatment (p < 0.001), and potential cures in metastatic disease (p < 0.001). Statistical modeling confirmed bona fide synergistic activity in both the adjuvant (p = 0.007) and metastatic settings (p < 0.001). Ivermectin has dual immunomodulatory and ICD-inducing effects in breast cancer, converting cold tumors hot, thus represents a rational mechanistic partner with checkpoint blockade.


Conflict of interest statement

The authors declare no competing interests.

Figures
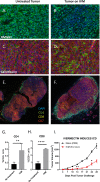
Fig. 1
Fig. 1. Treatment with ivermectin induces immunogenic cell death (ICD) in vivo and recruitment of T cells into tumors.
4T1 breast tumors were isolated from mice that were untreated (left panels) or ivermectin-treated (right panels) daily for 14 days. Panels A, B show staining for HMGB1 (green), a hallmark of ICD. Panels C, D show staining for calreticulin (green), another hallmark of ICD. Staining for CK7 (red) identifies 4T1 cells. Data are representative of two independent experiments. Panels E, F show staining for CD4+ (green), CD8+ T cells (yellow), and cancer cells via staining for CK7 (red). Data are representative of three independent experiments. Panels G, H display quantitative data on T cell infiltration shown in E, F. Data were obtained by quantifying five random fields from whole tumor images. Panel I demonstrates the protective effect of prophylactic subcutaneous vaccination with 1 million 4T1 cells treated with 12 μM ivermectin ex vivo (24 h), then challenged contralaterally with live 4T1 cells 1 week post vaccination (n = 4). Statistical significance was evaluated using the linear mixed effects model of log tumor volume; *p ≤ 0.05, **p ≤ 0.01, ***p ≤ 0.001, ****p ≤ 0.0001.
Fig. 2
Fig. 2. Immunomodulatory effects of ivermectin ex vivo.
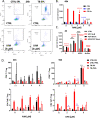
Splenocytes (SPL) were isolated from the spleens of aged-matched untreated and naïve non-tumor-bearing control mice (CTRL) or untreated 4T1 tumor bearing mice (TB), 1 month post tumor inoculation, then cultured on 96-well tissue culture-treated plates in complete R10 medium for 4h–48h and analyzed by flow cytometry for spontaneous and ivermectin-induced changes in various immune subpopulations. A Depletion of the expanded CD11b+ myeloid cells isolated from the spleens of tumor-bearing mice by ivermectin treatment ex vivo. B, C Splenocytes isolated from 4T1 tumor-bearing mice were exposed to increasing doses of ivermectin for 4 h or 48 h showing differential dose- and time-dependent sensitivity of different immune subpopulations (see also Fig. S2C). Depletion of CD11b+GR-1+ MDSCs, CD11b+GR-1 Monocytes/Macrophages, CD19+ B cells and CD3+ T cells by IVM could be reversed by an inhibitor of P2X7/CaMKII (KN62 at 10 μM). D Splenocytes from aged-matched untreated and naïve non-tumor-bearing control (CTRL) and 4T1 tumor-bearing (TB) mice were incubated for 24 h and 4 days with increasing doses of ivermectin (1–16 μM) with or without PHA to mimic TCR stimulation. Plots show averages and standard deviation based on triplicates; data representative of at least two independent experiments. Statistical significance versus (−) CTRL or as indicated was evaluated using the linear mixed effects model of log cell count adjusted for cell type: *p ≤ 0.05, **p ≤ 0.01, ***p ≤ 0.001, ****p ≤ 0.0001.
Fig. 3
Fig. 3. Ivermectin synergizes with anti-PD1 therapy to control tumor growth in vivo.
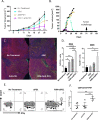
Mice were inoculated with 100,000 4T1 cells 4 days before initiating therapy with ivermectin alone (n = 20), anti-PD1 antibody alone (n = 10), both drugs (n = 15), or no treatment (n = 25). A Tumor volume in control and treated animals; *p ≤ 0.05, **p ≤ 0.01, ***p ≤ 0.001. B Tumor growth in individual animals treated with ivermectin plus anti-PD1 antibody (five individual mice from one representative of three experiments shown). Three of five combination-treated animals completely resolved their tumors. Animals that resolved tumors were re-challenged with 100,000 4T1 cells on the contralateral mammary fat pad 30 days after the termination of therapy. Mice were observed and palpated twice a week for an additional 30 days for the establishment of a tumor mass. CF Combination therapy with ivermectin and anti-PD1 recruits significantly more T cells into tumor sites and generates tumor-reactive CD8+ T cells. Tumors were isolated from mice at day 21. Staining was performed for nuclei (blue), CD4+ (green) cells, CD8+ cells (yellow), and tumor cells (red) (C). Percent positive for CD4 or CD8 was measured in five random fields in each group and divided by the number of nuclei in the field (D). Data are representative of two independent experiments; *p ≤ 0.05, **p ≤ 0.01, ****p ≤ 0.0001. Splenocytes isolated from tumor-bearing mice that received no treatment (n = 5), anti-PD1 alone (n = 5), or ivermectin with anti-PD1 (n = 4) were co-cultured with 4T1 cells. Reactive CD8+ cells were determined by CD107 mobilization and expression of IFNγ by flow cytometry. Representative flow plots for each treatment group are shown in E. F Percentage of CD8+ T cells reactive against 4T1 per mouse, grouped by treatment; **p ≤ 0.01.
Fig. 4
Fig. 4. Combination ivermectin and IP therapy in the neoadjuvant, adjuvant, and metastatic settings.
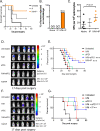
A Survival of animals following surgical resection of primary tumor (on day 16 post tumor inoculation). B Induction of protective immunity in treated mice that survived beyond day 80, then re-challenged with 4T1 cells on the contralateral mammary fat pad. C IFNγ ELISPOT analysis of 4T1-reactive splenocytes in treated animals. Mean ± s.d., n = 5 mice, pooled data from two independent experiments; *p ≤ 0.05, **p ≤ 0.01, ***p ≤ 0.001. D In vivo bioluminescence imaging of mice (on day 17 post surgery and after completion of the entire treatment schedule) treated with ivermectin, anti-PD1, ivermectin + anti-PD1 ± IL-2 (IP), or control in the adjuvant setting. Mean ± s.d., n = 5 mice, pooled data from two independent experiments. E Survival of animals in the adjuvant setting following surgical resection of primary tumor burden and treated starting 2 days after with ivermectin, anti-PD1, ivermectin + anti-PD1 ± IL-2 (IP), or control; n = 5 mice per group, two-tailed log-rank test; **p ≤ 0.01, ****p ≤ 0.0001. F In vivo bioluminescence imaging (on day 17 post surgery and after completion of the entire treatment schedule) of mice with documented metastasis, then treated with ivermectin, anti-PD1, ivermectin + anti-PD1 ± IL-2 (IP), or control. Mean ± s.d., n = 5 mice, pooled data from two independent experiments. G Kaplan–Meier survival analysis of mice in the metastatic setting treated with ivermectin, anti-PD1, ivermectin + anti-PD1 ± IL-2 (IP), or control; n = 5 mice per group, two-tailed log-rank test; *p ≤ 0.05, **p ≤ 0.01, ***p ≤ 0.001.

Similar articles

Cited by

References

    1. Pardoll DM. The blockade of immune checkpoints in cancer immunotherapy. Nat. Rev. Cancer. 2012;12:252–264. doi: 10.1038/nrc3239. - DOI - PMC - PubMed
    1. Sharma P, Allison JP. The future of immune checkpoint therapy. Science. 2015;348:56–61. doi: 10.1126/science.aaa8172. - DOI - PubMed
    1. Disis, M. L. & Stanton, S. E. Triple-negative breast cancer: immune modulation as the new treatment paradigm. in American Society of Clinical Oncology Educational Book. American Society of Clinical Oncology. Meeting, e25–e30 (American Society of Clinical Oncology, 2015). - PubMed
    1. Nanda R, et al. Pembrolizumab in patients with advanced triple-negative breast cancer: phase Ib KEYNOTE-012 study. J. Clin. Oncol. 2016;34:2460–2467. doi: 10.1200/JCO.2015.64.8931. - DOI - PMC - PubMed
    1. Cortés J, et al. LBA21 - KEYNOTE-119: phase III study of pembrolizumab (pembro) versus single-agent chemotherapy (chemo) for metastatic triple negative breast cancer (mTNBC) Ann. Oncol. 2019;30:v859–v860. doi: 10.1093/annonc/mdz394.010. - DOI