

Meta-analysis of neural systems underlying placebo analgesia from individual participant fMRI data
- PMID: 33654105
- PMCID: PMC7925520
- DOI: 10.1038/s41467-021-21179-3
Meta-analysis of neural systems underlying placebo analgesia from individual participant fMRI data
Abstract
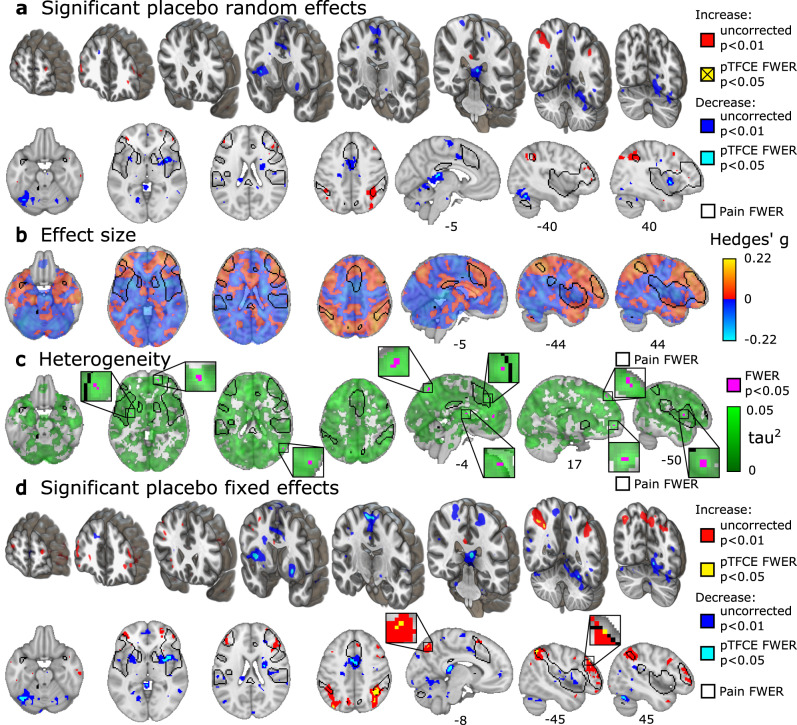
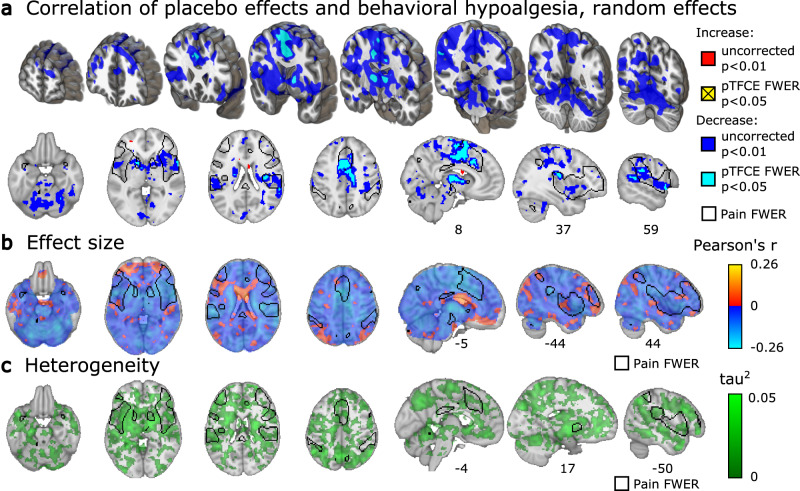
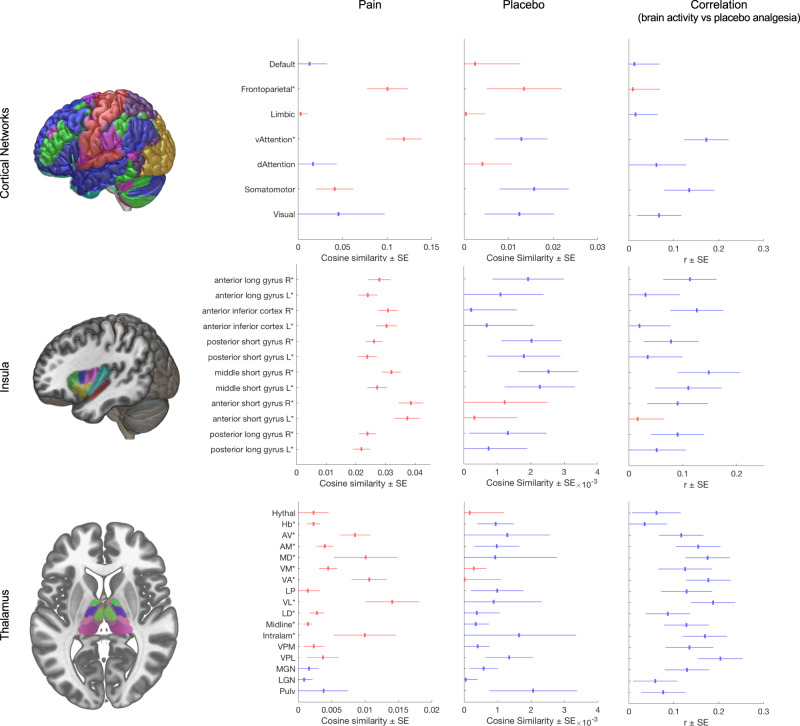
The brain systems underlying placebo analgesia are insufficiently understood. Here we performed a systematic, participant-level meta-analysis of experimental functional neuroimaging studies of evoked pain under stimulus-intensity-matched placebo and control conditions, encompassing 603 healthy participants from 20 (out of 28 eligible) studies. We find that placebo vs. control treatments induce small, widespread reductions in pain-related activity, particularly in regions belonging to ventral attention (including mid-insula) and somatomotor networks (including posterior insula). Behavioral placebo analgesia correlates with reduced pain-related activity in these networks and the thalamus, habenula, mid-cingulate, and supplementary motor area. Placebo-associated activity increases occur mainly in frontoparietal regions, with high between-study heterogeneity. We conclude that placebo treatments affect pain-related activity in multiple brain areas, which may reflect changes in nociception and/or other affective and decision-making processes surrounding pain. Between-study heterogeneity suggests that placebo analgesia is a multi-faceted phenomenon involving multiple cerebral mechanisms that differ across studies.
Conflict of interest statement
M.Z. is a full-time employee of Takeda Pharma; the present publication has been prepared independently and outside of the employment; the employer is not involved in any of the subjects dealt within this publication and did not provide any form of support. The authors declare no competing interests.
Figures

Similar articles
-
Placebo Effects on the Neurologic Pain Signature: A Meta-analysis of Individual Participant Functional Magnetic Resonance Imaging Data.JAMA Neurol. 2018 Nov 1;75(11):1321-1330. doi: 10.1001/jamaneurol.2018.2017. JAMA Neurol. 2018. PMID: 30073258 Free PMC article.
-
Activation likelihood estimation meta-analysis of brain correlates of placebo analgesia in human experimental pain.Hum Brain Mapp. 2013 Mar;34(3):738-52. doi: 10.1002/hbm.21471. Epub 2011 Nov 29. Hum Brain Mapp. 2013. PMID: 22125184 Free PMC article.
-
Placebo-induced pain reduction is associated with negative coupling between brain networks at rest.Neuroimage. 2020 Oct 1;219:117024. doi: 10.1016/j.neuroimage.2020.117024. Epub 2020 Jun 5. Neuroimage. 2020. PMID: 32512124 Clinical Trial.
-
Functional imaging of brain responses to pain. A review and meta-analysis (2000).Neurophysiol Clin. 2000 Oct;30(5):263-88. doi: 10.1016/s0987-7053(00)00227-6. Neurophysiol Clin. 2000. PMID: 11126640 Review.
-
Placebo analgesia is accompanied by large reductions in pain-related brain activity in irritable bowel syndrome patients.Pain. 2007 Jan;127(1-2):63-72. doi: 10.1016/j.pain.2006.08.001. Epub 2006 Sep 8. Pain. 2007. PMID: 16963184 Clinical Trial.
Cited by
-
Placebo effect involves unexpected brain regions.Nature. 2024 Aug;632(8027):990-991. doi: 10.1038/d41586-024-02373-x. Nature. 2024. PMID: 39174630 No abstract available.
-
A three-dimensional model of neural activity and phenomenal-behavioral patterns.Mol Psychiatry. 2024 Mar;29(3):639-652. doi: 10.1038/s41380-023-02356-w. Epub 2023 Dec 19. Mol Psychiatry. 2024. PMID: 38114633 Review.
-
Placebo, nocebo: Believing in the field of medicine.Front Pain Res (Lausanne). 2022 Jul 29;3:972169. doi: 10.3389/fpain.2022.972169. eCollection 2022. Front Pain Res (Lausanne). 2022. PMID: 35965595 Free PMC article. No abstract available.
-
Yoga and massage are associated with small experimental placebo effects in chronic orofacial pain.Eur J Pain. 2023 Aug;27(7):816-830. doi: 10.1002/ejp.2111. Epub 2023 Mar 30. Eur J Pain. 2023. PMID: 36932918 Free PMC article.
-
Pandora's Box.BJPsych Int. 2021 May;18(2):51-52. doi: 10.1192/bji.2021.9. BJPsych Int. 2021. PMID: 34287403 Free PMC article. Review.
References
-
- Hróbjartsson, A. & Gøtzsche, P. C. Placebo Interventions For All Clinical Conditions (Review) Placebo Interventions For All Clinical Conditions. Cochrane Database Syst. Rev. 10.1002/14651858 (2010). - PubMed
Publication types
MeSH terms
Substances
Grants and funding
LinkOut - more resources
Full Text Sources
Other Literature Sources
Medical
