. 2021 Mar 2;11(1):4970.
doi: 10.1038/s41598-021-84512-2.

Mice lacking PLAP-1/asporin counteracts high fat diet-induced metabolic disorder and alveolar bone loss by controlling adipose tissue expansion

Affiliations

Mice lacking PLAP-1/asporin counteracts high fat diet-induced metabolic disorder and alveolar bone loss by controlling adipose tissue expansion

Hiromi Sakashita et al. Sci Rep. .

Abstract

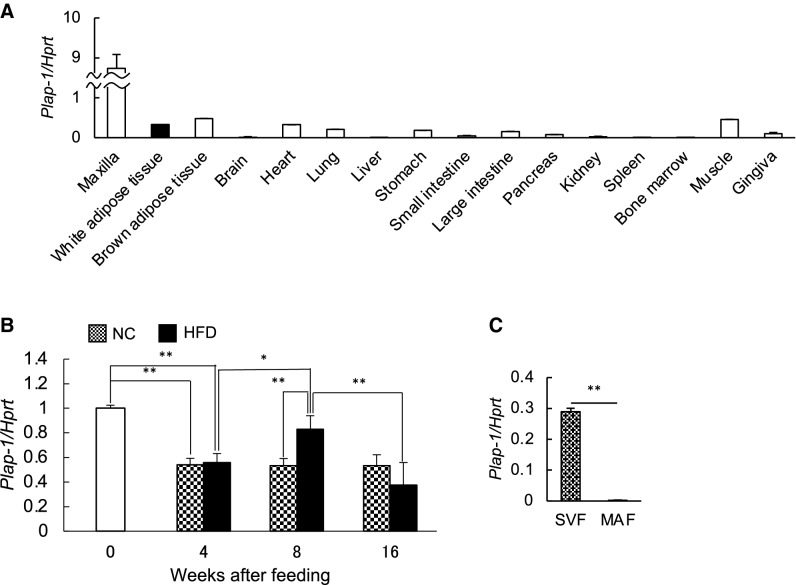
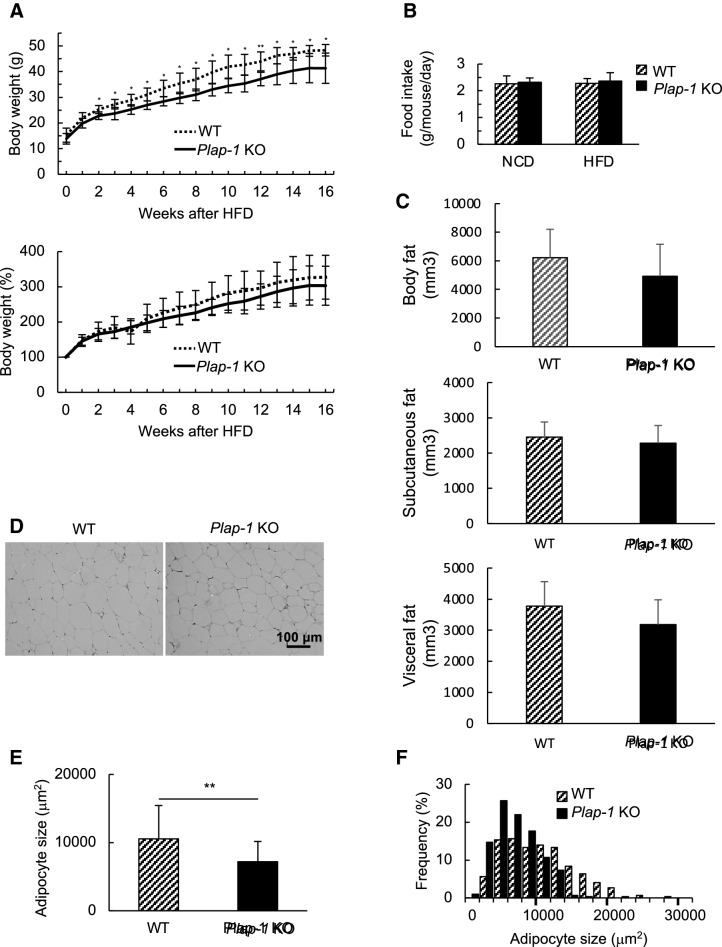
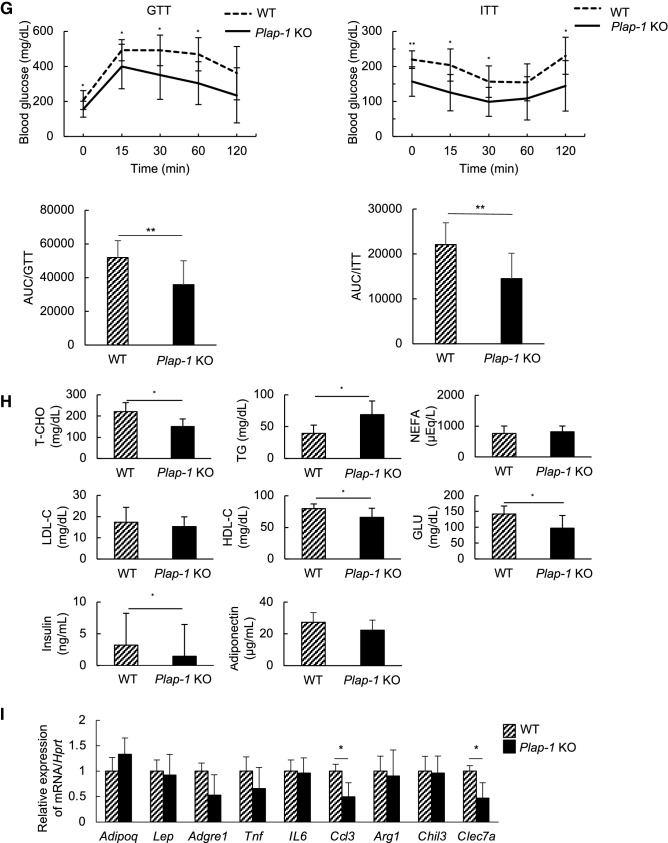
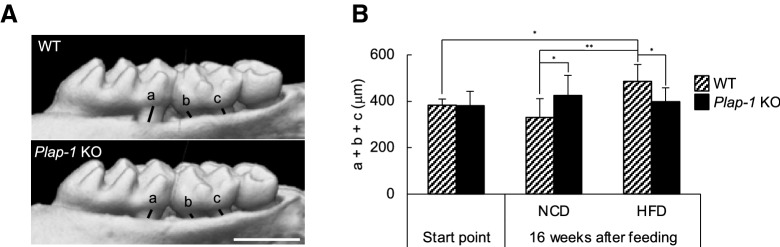
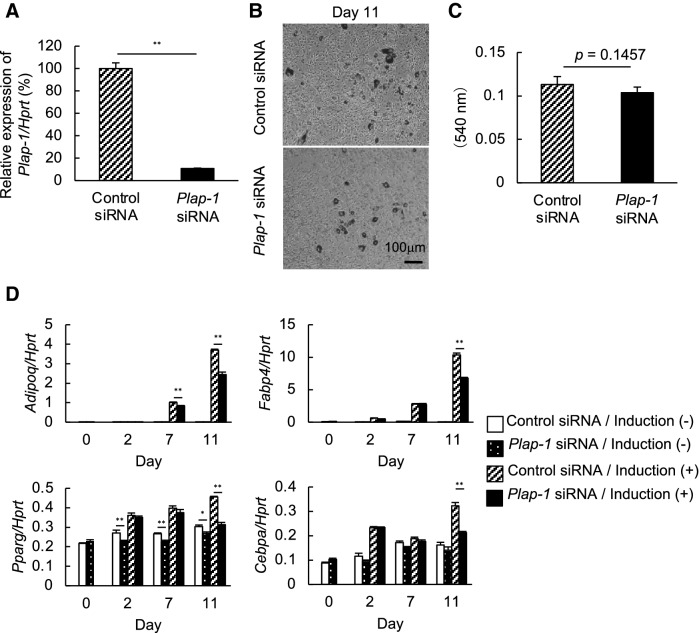
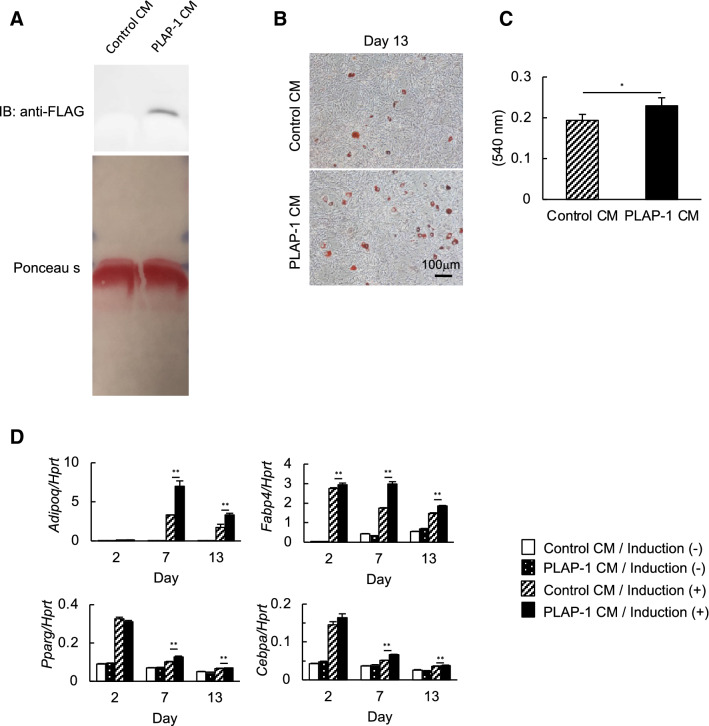
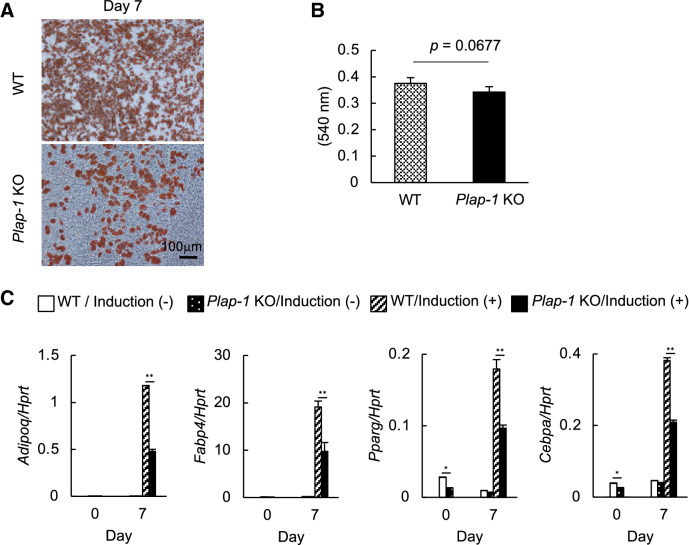
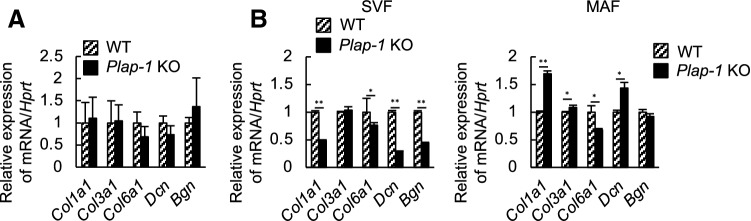
Adipose tissue fibrosis with chronic inflammation is a hallmark of obesity-related metabolic disorders, and the role of proteoglycans in developing adipose tissue fibrosis is of interest. Periodontal disease is associated with obesity; however, the underlying molecular mechanisms remain unclear. Here we investigated the roles of periodontal ligament associated protein-1 (PLAP-1)/asporin, a proteoglycan preferentially and highly expressed in the periodontal ligament, in obesity-related adipose tissue dysfunction and adipocyte differentiation. It was found that PLAP-1 is also highly expressed in white adipose tissues. Plap-1 knock-out mice counteracted obesity and alveolar bone resorption induced by a high-fat diet. Plap-1 knock-down in 3T3-L1 cells resulted in less lipid accumulation, and recombinant PLAP-1 enhanced lipid accumulation in 3T3-L1 cells. In addition, it was found that primary preadipocytes isolated from Plap-1 knock-out mice showed lesser lipid accumulation than the wild-type (WT) mice. Furthermore, the stromal vascular fraction of Plap-1 knock-out mice showed different extracellular matrix gene expression patterns compared to WT. These findings demonstrate that PLAP-1 enhances adipogenesis and could be a key molecule in understanding the association between periodontal disease and obesity-related metabolic disorders.


Conflict of interest statement

The authors declare no competing interests.

Figures

Figure 1
Figure 1
PLAP-1 is expressed in adipose tissue. (A)Total RNA was extracted from various tissues and the expressions of Plap-1 were analyzed by real-time PCR analysis. Results show the mean ± SD of triplicate assays. (B) Plap-1 expression in epididymal adipose tissue was analyzed by real-time PCR analysis before or during NC or HFD feeding. 0: start point of NC or HFD feeding (five weeks of age) (n = 3), 4: after 4 weeks NC or HFD feeding (n = 5 in each group), 8: after 8 weeks NC or HFD feeding (n = 5 in each group), 16: after 16 weeks NC or HFD feeding (n = 5 in each group). (C) Real-time PCR analysis was performed to investigate Plap-1 expression in SVF and MAF isolated from WT and Plap-1 KO mice. Values represent the mean ± SD triplicate assays.
Figure 2
Figure 2
Body weight and expansion of adipocytes in Plap-1 KO mice after HFD feeding. (A) Body weight changes in WT and Plap-1 KO mice during HFD feeding. 5-week-old male WT and Plap-1 KO mice were fed with HFD and weighted weekly. WT (n = 7), Plap-1 KO (n = 9). Both g body weight and % body weight are shown. Results show the mean ± SD. *: p < 0.05, **: p < 0.01 (B) Food intake per mouse per day during NC or HFD feeding were measured (n = 4 in each group). Results show the mean ± SD. (C) H-E staining of epididymal adipose tissue was conducted in WT and Plap-1 KO mice after 16 weeks of HFD feeding (× 50). (D and E) Average adipocyte size (D) and frequency of adipocyte size (E) of epididymal fat were shown. To analyze adipocyte size, H–E staining sections were obtained from three mice per each group, and the area of 100 adipocytes in each mouse was measured. Results show the mean ± SD. **: p < 0.01 (F) GTT and ITT were performed in WT and Plap-1 KO mice after 16 weeks of HFD feeding. WT (n = 10), Plap-1 KO (n = 11). Results show the mean ± SD. *: p < 0.05, **: p < 0.01 (G) Metabolic serum markers in WT and Plap-1 KO mice after 16 weeks HFD feeding. Serum levels of total cholesterol (T-CHO), triglyceride (TG), LDL-cholesterol (LDL-C), HDL-cholesterol (HDL-C), non-esterified fatty acid (NEFA), glucose (GLU), insulin, and adiponectin were measured after HFD feeding. WT (n = 6), Plap-1 KO (n = 11). Results show the mean ± SD. (H) Real-time PCR analysis was performed in epididymal adipose tissue of WT and Plap-1 KO mice after 16 weeks of HFD feeding. WT (n = 4), Plap-1 KO (n = 5). Data are represented as relative expression to WT mice. Results show the mean ± SD. *: p < 0.05.
Figure 2
Figure 2
Body weight and expansion of adipocytes in Plap-1 KO mice after HFD feeding. (A) Body weight changes in WT and Plap-1 KO mice during HFD feeding. 5-week-old male WT and Plap-1 KO mice were fed with HFD and weighted weekly. WT (n = 7), Plap-1 KO (n = 9). Both g body weight and % body weight are shown. Results show the mean ± SD. *: p < 0.05, **: p < 0.01 (B) Food intake per mouse per day during NC or HFD feeding were measured (n = 4 in each group). Results show the mean ± SD. (C) H-E staining of epididymal adipose tissue was conducted in WT and Plap-1 KO mice after 16 weeks of HFD feeding (× 50). (D and E) Average adipocyte size (D) and frequency of adipocyte size (E) of epididymal fat were shown. To analyze adipocyte size, H–E staining sections were obtained from three mice per each group, and the area of 100 adipocytes in each mouse was measured. Results show the mean ± SD. **: p < 0.01 (F) GTT and ITT were performed in WT and Plap-1 KO mice after 16 weeks of HFD feeding. WT (n = 10), Plap-1 KO (n = 11). Results show the mean ± SD. *: p < 0.05, **: p < 0.01 (G) Metabolic serum markers in WT and Plap-1 KO mice after 16 weeks HFD feeding. Serum levels of total cholesterol (T-CHO), triglyceride (TG), LDL-cholesterol (LDL-C), HDL-cholesterol (HDL-C), non-esterified fatty acid (NEFA), glucose (GLU), insulin, and adiponectin were measured after HFD feeding. WT (n = 6), Plap-1 KO (n = 11). Results show the mean ± SD. (H) Real-time PCR analysis was performed in epididymal adipose tissue of WT and Plap-1 KO mice after 16 weeks of HFD feeding. WT (n = 4), Plap-1 KO (n = 5). Data are represented as relative expression to WT mice. Results show the mean ± SD. *: p < 0.05.
Figure 3
Figure 3
Evaluation of HFD-induced alveolar bone resorption. (A) Alveolar bone resorption was evaluated by μCT analysis in WT and Plap-1 KO mice fed with HFD. (B) Distance between alveolar bone crest and cement-enamel junction was measured at distal root of first molar (a), mesial (b) and distal (c) root of second molar. Start point/WT (n = 10), start point/Plap-1 KO (n = 10), 16 weeks after feeding/NC/WT (n = 10), 16 weeks after feeding/NC/Plap-1 KO (n = 8), 16 weeks after feeding/HFD/WT (n = 10), 16 weeks after feeding/HFD/Plap-1 KO (n = 10). Results show the mean ± SD. *: p < 0.05, **: p < 0.01.
Figure 4
Figure 4
Adipocyte differentiation of Plap-1 knock-down 3T3-L1 cells by siRNA. (A) Real-time PCR analysis was performed to confirm Plap-1 knock-down by siRNA in 3T3-L1 cells. Data are represented as relative expression to control siRNA. Values represent the mean ± SD triplicate assays (n = 3). (B) Oil Red O staining of Plap-1 knock-down and control 3T3-L1 cells was conducted after adipocyte differentiation. (C) Quantitative lipid assay of Plap-1 knock-down and control 3T3-L1 cells was performed after Oil Red O staining (n = 4 in each group). Values represent the mean ± SD (n = 4). (D) Real-time PCR analysis was performed to examine adipogenic gene expressions of Plap-1 knock-down 3T3-L1 cells during adipocyte differentiation. Results show the mean ± SD of triplicate assays (n = 3). *: p < 0.05, **: p < 0.01.
Figure 5
Figure 5
Adipocyte differentiation of 3T3-L1 cells in the presence of recombinant PLAP-1. (A) PLAP-1 expression in culture supernatants from 3T3-L1 cells infected with adenoviruses that carried LacZ or mouse Plap-1 was identified by Western blot analysis. Total protein level was shown by Ponceau S. Control CM: Control conditioned medium infected with adenoviruses that carried LacZ, PLAP-1 CM: PLAP-1 conditioned medium infected with adenoviruses that carried Plap-1. The original blot images are included in Fig. S4. (B) Oil Red O staining of 3T3-L1 cells in the presence of recombinant PLAP-1 was conducted after adipocyte differentiation. (C) Quantitative lipid assay of 3T3-L1 cells in the presence of recombinant PLAP-1 was performed after Oil Red O staining (n = 4). Values represent the mean ± SD. (D) Real-time PCR analysis was performed to examine adipogenic related gene expression of 3T3-L1 cells in the presence of recombinant PLAP-1 during adipocyte differentiation (n = 3). Results show the mean ± SD of triplicate assays. *:p < 0.05, **: p < 0.01.
Figure 6
Figure 6
Adipocyte differentiation of primary preadipocytes isolated from WT and Plap-1 KO mice. (A) Oil Red O staining of SVF isolated from WT and Plap-1 KO mice was conducted after adipocyte differentiation. (B) Quantitative lipid assay of SVF isolated from WT and Plap-1 KO mice was performed after Oil Red O staining (n = 4 in each group). Values represent the mean ± SD. (C) Real-time PCR analyses were performed to examine adipogenic related gene expression of SVF isolated from WT and Plap-1 KO mice during adipocyte differentiation. Results show the mean ± SD of triplicate assays. n = 3, *: p < 0.05, **: p < 0.01.
Figure 7
Figure 7
ECM gene expressions in adipose tissue. (A) ECM gene expressions in subcutaneous adipose tissue of WT and Plap-1 KO mice were investigated by real-time PCR analysis. (B) ECM gene expressions in SVF and MAF isolated from WT and Plap-1 KO mice were investigated by real-time PCR analysis. All data are represented as relative expression to WT. Col1a1: collagen, type I, alpha 1, Col3a1: collagen, type III, alpha 1, Col6a1: collagen, type VI, alpha 1, Dcn: Decorin, Bgn: Biglycan. Results show the mean ± SD of triplicate assays. n = 3, *: p < 0.05, **: p < 0.01.

Similar articles

Cited by

References

    1. Sun K, Kusminski CM, Scherer PE. Adipose tissue remodeling and obesity. J. Clin. Investig. 2011;121:2094–2101. doi: 10.1172/JCI45887. - DOI - PMC - PubMed
    1. Smith GI, Mittendorfer B, Klein S. Metabolically healthy obesity: facts and fantasies. J. Clin. Investig. 2019;129:3978–3989. doi: 10.1172/JCI129186. - DOI - PMC - PubMed
    1. Crewe C, An YA, Scherer PE. The ominous triad of adipose tissue dysfunction: inflammation, fibrosis, and impaired angiogenesis. J. Clin. Investig. 2017;127:74–82. doi: 10.1172/JCI88883. - DOI - PMC - PubMed
    1. Thomas D, Apovian C. Macrophage functions in lean and obese adipose tissue. Metab. Clin. Exp. 2017;72:120–143. doi: 10.1016/j.metabol.2017.04.005. - DOI - PMC - PubMed
    1. Datta R, Podolsky MJ, Atabai K. Fat fibrosis: friend or foe? JCI Insight. 2018;3:e122289. doi: 10.1172/jci.insight.122289. - DOI - PMC - PubMed

Publication types

MeSH terms

Substances