Meta-Analysis
. 2021 Mar;27(3):546-559.
doi: 10.1038/s41591-020-01227-z. Epub 2021 Mar 2.

Single-cell meta-analysis of SARS-CoV-2 entry genes across tissues and demographics

Christoph Muus #  1   2 Malte D Luecken #  3 Gökcen Eraslan #  4 Lisa Sikkema #  5 Avinash Waghray #  6   7   8 Graham Heimberg #  4 Yoshihiko Kobayashi #  9 Eeshit Dhaval Vaishnav #  4   10 Ayshwarya Subramanian #  4 Christopher Smillie #  4 Karthik A Jagadeesh #  4 Elizabeth Thu Duong #  11 Evgenij Fiskin #  4 Elena Torlai Triglia #  4 Meshal Ansari #  12   13 Peiwen Cai #  14 Brian Lin #  7   8   6 Justin Buchanan #  15   16 Sijia Chen #  17 Jian Shu #  18   19 Adam L Haber #  4   20 Hattie Chung #  4 Daniel T Montoro #  4 Taylor Adams  21 Hananeh Aliee  13 Samuel J Allon  18   22   23 Zaneta Andrusivova  24 Ilias Angelidis  12 Orr Ashenberg  4 Kevin Bassler  25 Christophe Bécavin  26 Inbal Benhar  4 Joseph Bergenstråhle  24 Ludvig Bergenstråhle  24 Liam Bolt  27 Emelie Braun  28 Linh T Bui  29 Steven Callori  30   31 Mark Chaffin  32 Evgeny Chichelnitskiy  33   34 Joshua Chiou  35 Thomas M Conlon  12 Michael S Cuoco  4 Anna S E Cuomo  36 Marie Deprez  26 Grant Duclos  37 Denise Fine  38 David S Fischer  13   39 Shila Ghazanfar  40 Astrid Gillich  41 Bruno Giotti  42 Joshua Gould  4 Minzhe Guo  43 Austin J Gutierrez  29 Arun C Habermann  44 Tyler Harvey  4 Peng He  27 Xiaomeng Hou  45   46 Lijuan Hu  28 Yan Hu  47 Alok Jaiswal  4 Lu Ji  48 Peiyong Jiang  48 Theodoros S Kapellos  49 Christin S Kuo  50 Ludvig Larsson  51 Michael A Leney-Greene  4 Kyungtae Lim  52 Monika Litviňuková  53   54 Leif S Ludwig  4   55 Soeren Lukassen  56   57 Wendy Luo  4 Henrike Maatz  54 Elo Madissoon  58   59 Lira Mamanova  27 Kasidet Manakongtreecheep  18   60   61 Sylvie Leroy  62   63 Christoph H Mayr  64 Ian M Mbano  65   66 Alexi M McAdams  67 Ahmad N Nabhan  41 Sarah K Nyquist  18   23   68 Lolita Penland  41 Olivier B Poirion  45   46 Sergio Poli  21 CanCan Qi  69   70 Rachel Queen  71 Daniel Reichart  72   73 Ivan Rosas  21 Jonas C Schupp  74 Conor V Shea  75 Xingyi Shi  75   76 Rahul Sinha  77 Rene V Sit  41 Kamil Slowikowski  18   60   61 Michal Slyper  4 Neal P Smith  78 Alex Sountoulidis  79 Maximilian Strunz  80 Travis B Sullivan  81 Dawei Sun  52 Carlos Talavera-López  82 Peng Tan  4 Jessica Tantivit  18   60   61 Kyle J Travaglini  41 Nathan R Tucker  32   83 Katherine A Vernon  18   84 Marc H Wadsworth  18   23   85 Julia Waldman  4 Xiuting Wang  14 Ke Xu  75 Wenjun Yan  86   87 William Zhao  14 Carly G K Ziegler  18   23   88 NHLBI LungMap ConsortiumHuman Cell Atlas Lung Biological Network
Collaborators, Affiliations
Meta-Analysis

Single-cell meta-analysis of SARS-CoV-2 entry genes across tissues and demographics

Christoph Muus et al. Nat Med. 2021 Mar.

Abstract

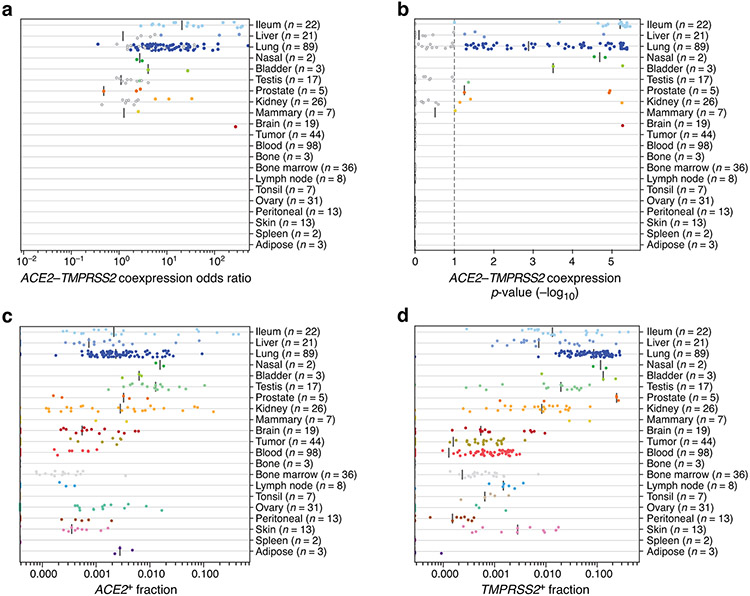
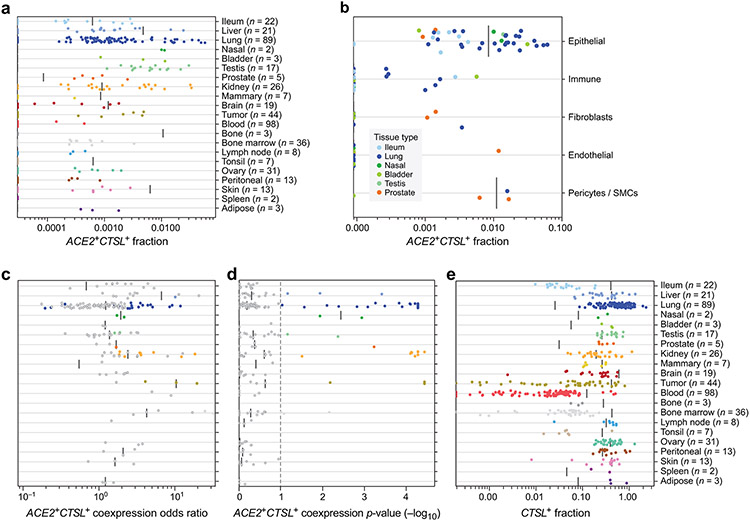
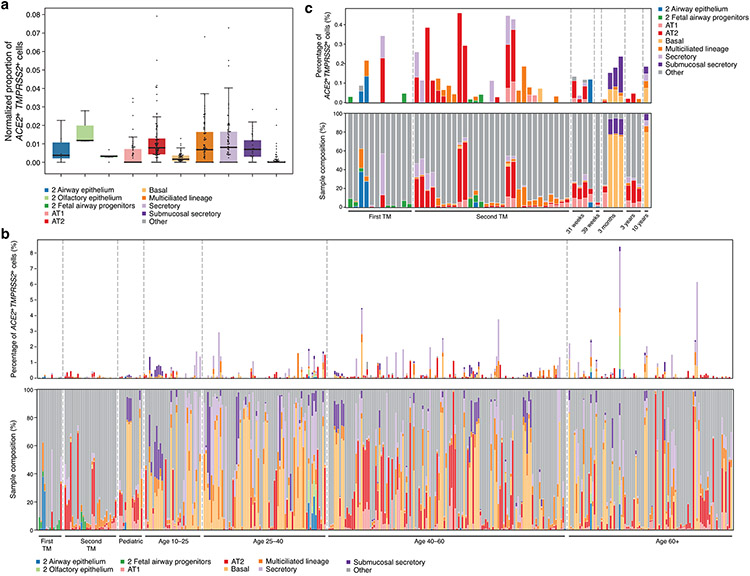
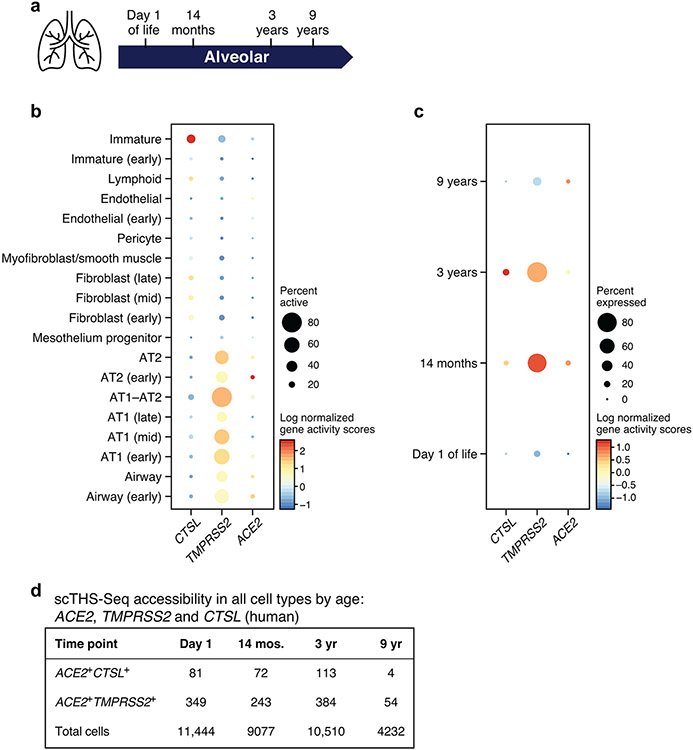
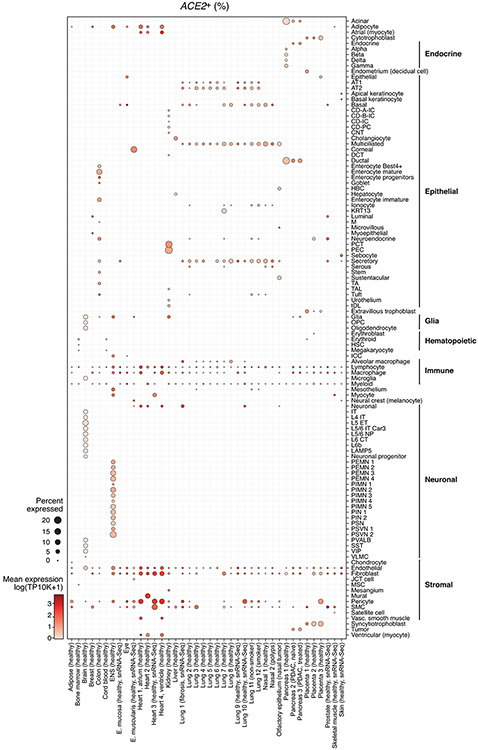
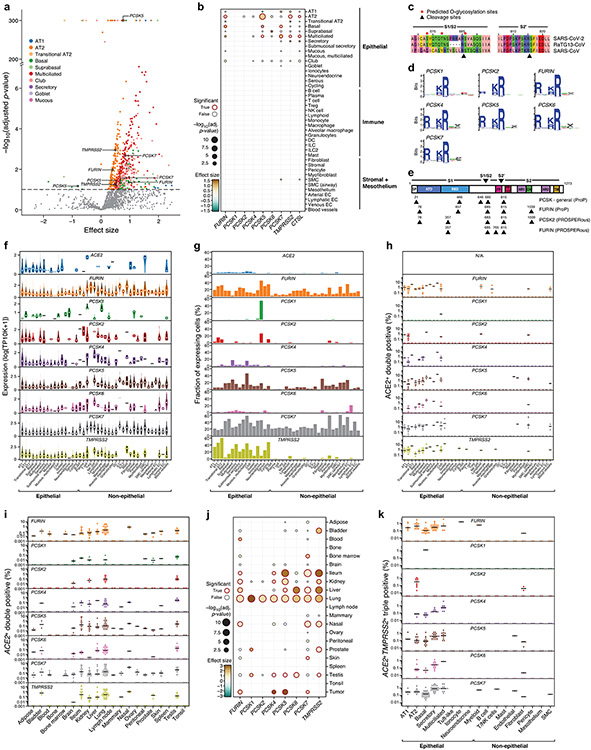
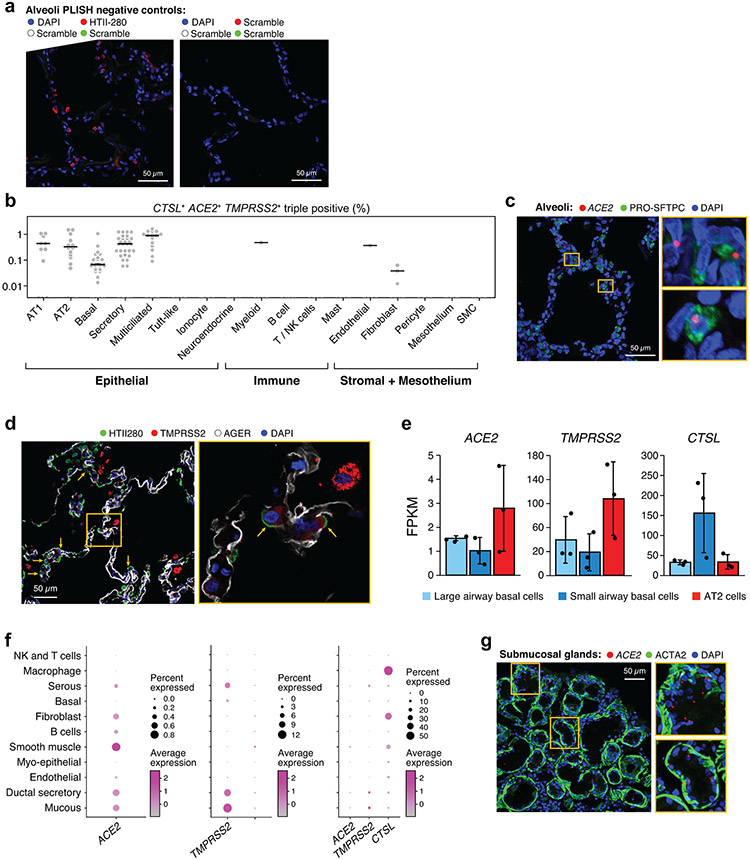
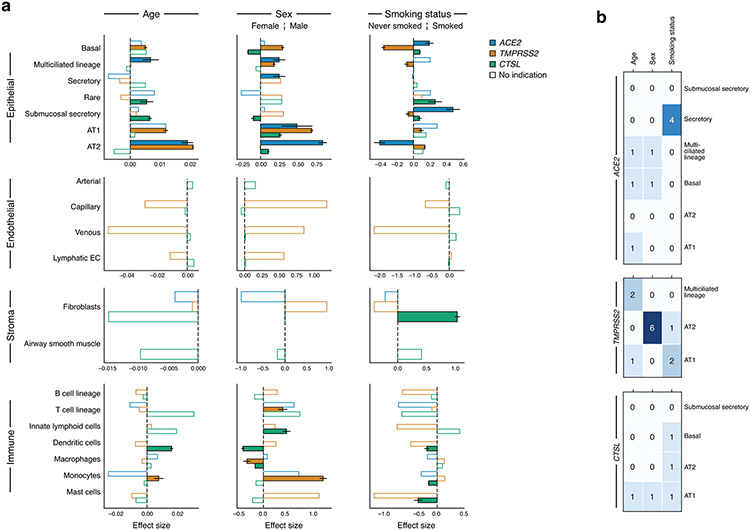
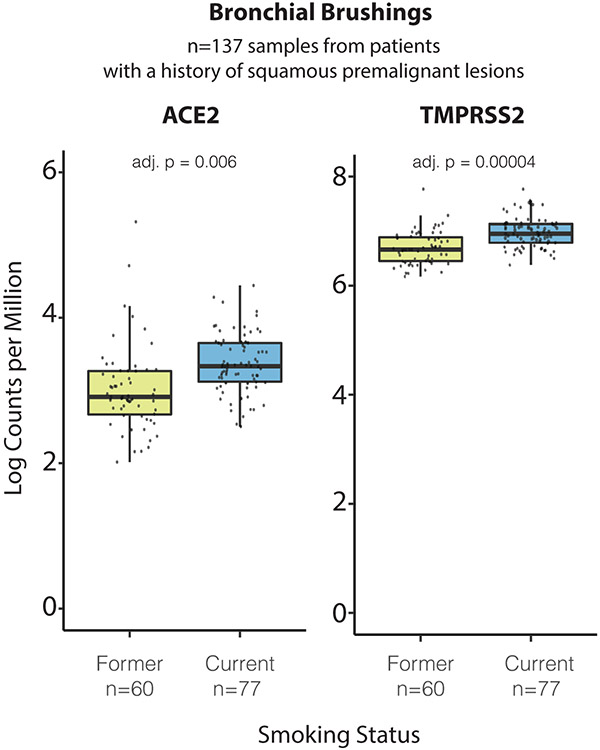
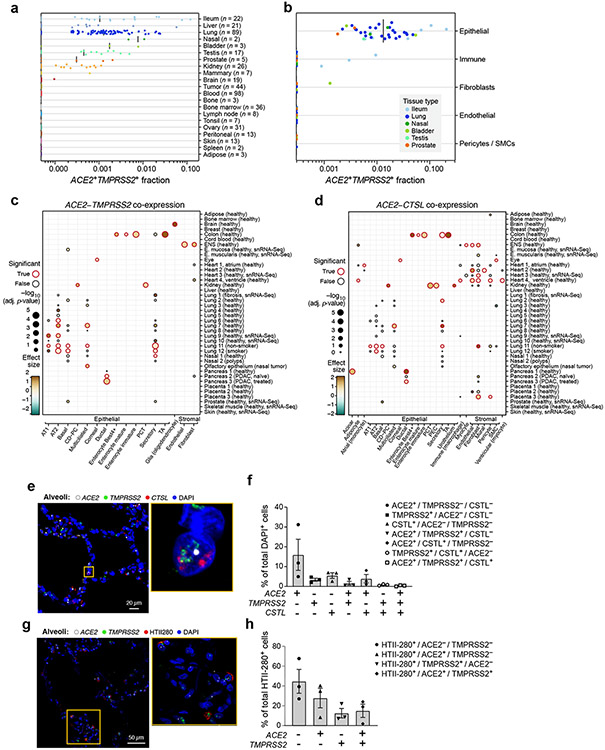
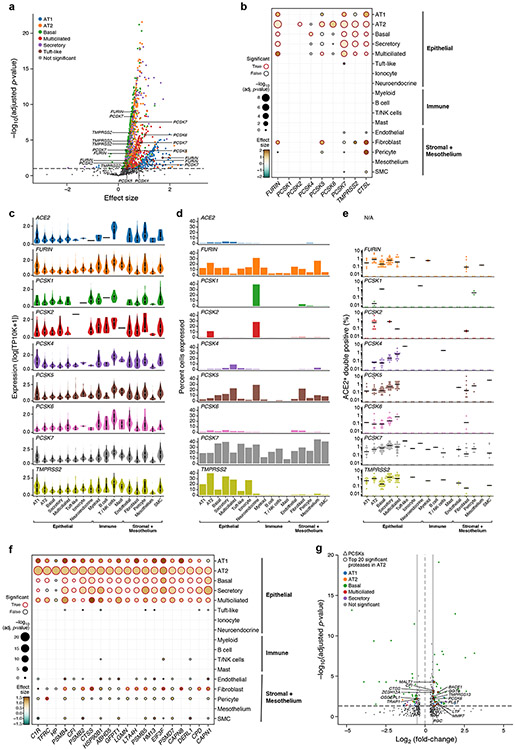
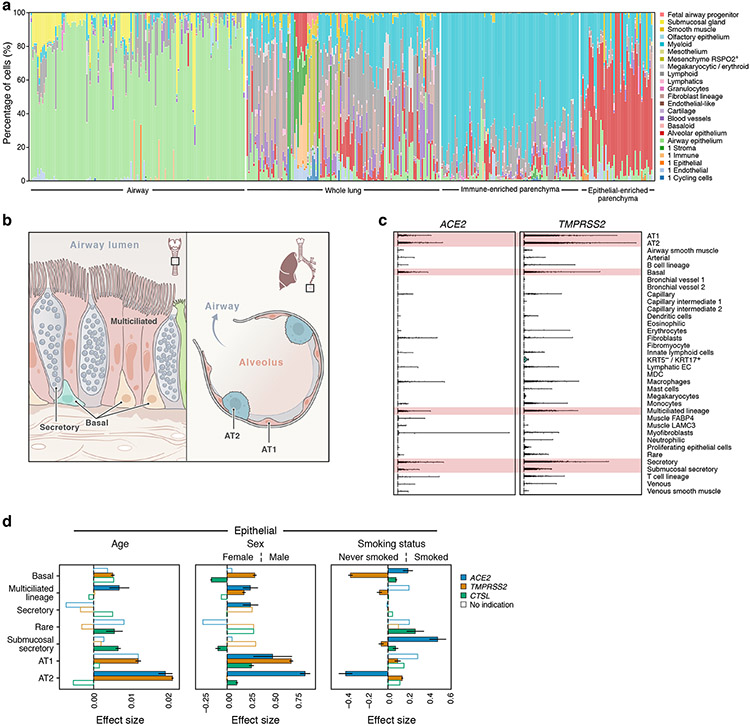
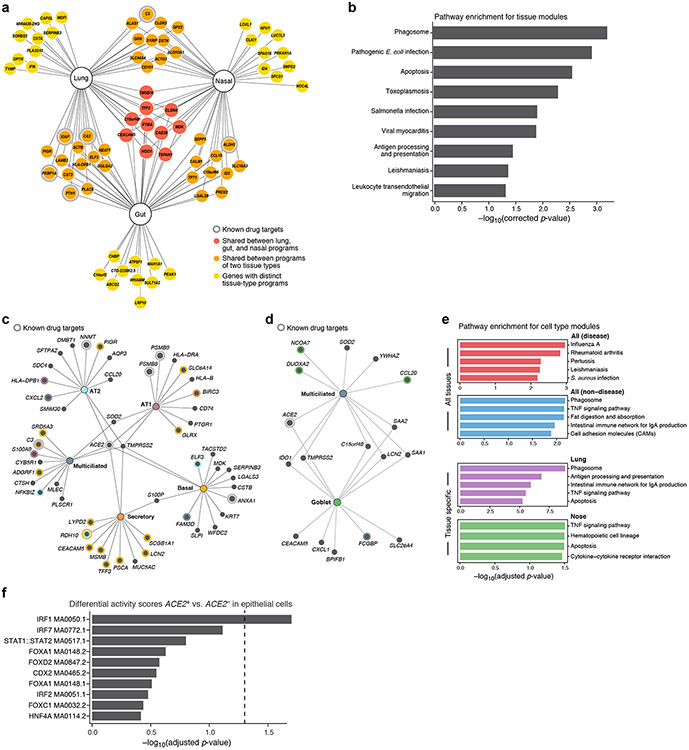
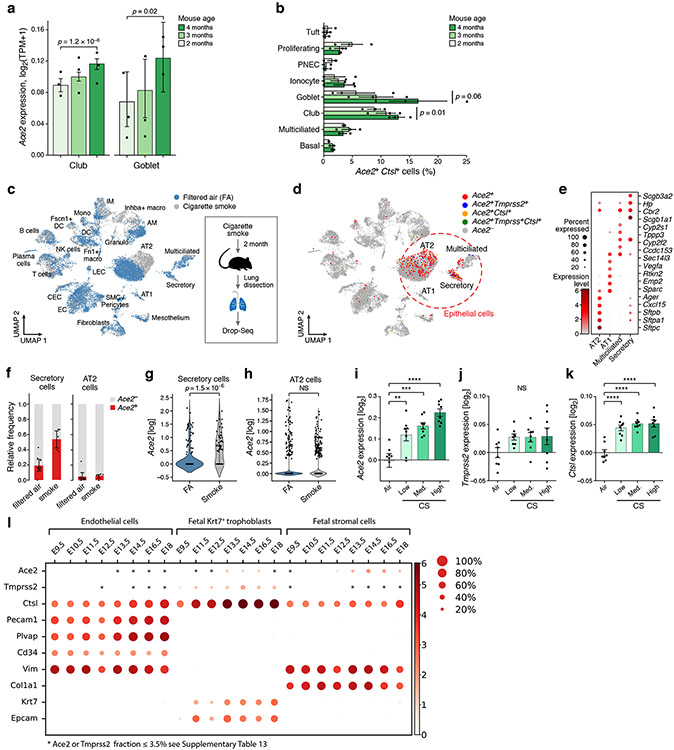
Angiotensin-converting enzyme 2 (ACE2) and accessory proteases (TMPRSS2 and CTSL) are needed for severe acute respiratory syndrome coronavirus 2 (SARS-CoV-2) cellular entry, and their expression may shed light on viral tropism and impact across the body. We assessed the cell-type-specific expression of ACE2, TMPRSS2 and CTSL across 107 single-cell RNA-sequencing studies from different tissues. ACE2, TMPRSS2 and CTSL are coexpressed in specific subsets of respiratory epithelial cells in the nasal passages, airways and alveoli, and in cells from other organs associated with coronavirus disease 2019 (COVID-19) transmission or pathology. We performed a meta-analysis of 31 lung single-cell RNA-sequencing studies with 1,320,896 cells from 377 nasal, airway and lung parenchyma samples from 228 individuals. This revealed cell-type-specific associations of age, sex and smoking with expression levels of ACE2, TMPRSS2 and CTSL. Expression of entry factors increased with age and in males, including in airway secretory cells and alveolar type 2 cells. Expression programs shared by ACE2+TMPRSS2+ cells in nasal, lung and gut tissues included genes that may mediate viral entry, key immune functions and epithelial-macrophage cross-talk, such as genes involved in the interleukin-6, interleukin-1, tumor necrosis factor and complement pathways. Cell-type-specific expression patterns may contribute to the pathogenesis of COVID-19, and our work highlights putative molecular pathways for therapeutic intervention.


Conflict of interest statement

Conflict of interest statement

N.K. was a consultant to Biogen Idec, Boehringer Ingelheim, Third Rock, Pliant, Samumed, NuMedii, Indaloo, Theravance, LifeMax, Three Lake Partners, Optikira and received non-financial support from MiRagen. All of these outside the work reported. J.L. is a scientific consultant for 10X Genomics Inc. A.R. is a co-founder and equity holder of Celsius Therapeutics, an equity holder in Immunitas, and an SAB member of ThermoFisher Scientific, Syros Pharmaceuticals, Asimov, and Neogene Therapeutics. O.R.R. and A.R. are co-inventors on patent applications filed by the Broad Institute to inventions relating to single cell genomics applications, such as in PCT/US2018/060860 and US Provisional Application No. 62/745,259. A.K.S. compensation for consulting and SAB membership from Honeycomb Biotechnologies, Cellarity, Cogen Therapeutics, Orche Bio, and Dahlia Biosciences. S.A.T. was a consultant at Genentech, Biogen and Roche in the last three years. F.J.T. reports receiving consulting fees from Roche Diagnostics GmbH, and ownership interest in Cellarity Inc. L.V. is founder of Definigen and Bilitech two biotech companies using hPSCs and organoid for disease modelling and cell based therapy. J.A.K. has received advisory board fees from Boehringer Ingelheim, Inc, and has research contracts with Genentech. Eric S. Lander serves on the Board of Directors for Codiak BioSciences and serves on the Scientific Advisory Board of F-Prime Capital Partners and Third Rock Ventures; he is also affiliated with several non-profit organizations including serving on the Board of Directors of the Innocence Project, Count Me In, and Biden Cancer Initiative, and the Board of Trustees for the Parker Institute for Cancer Immunotherapy. He has served and continues to serve on various federal advisory committees. Joakim Lundeberg is a scientific consultant for 10X Genomics Inc. Jennifer Beane, Joshua Campbell, Mary Reid and Sarah Mazzilli are funded in part by a sponsored research agreement from Janssen Pharmaceuticals, Inc. Avrum Spira is an employee of Johnson & Johnson. Ramnik J. Xavier is a co-founder Celsius Therapeutics and Jnana Therapeutics, and a consultant at Novartis. All other authors declare no conflicts of interest.

Figures

Extended Data Fig. 1.
Extended Data Fig. 1.. A cross-tissue survey of ACE2+TMPRSS2+ cells in published single-cell datasets.
(a) Odds ratio (x axis) of ACE2+TMPRSS2+ co-expression in single-cell datasets (dots) from different tissues (y axis). (b) Significance (−log10(p-value) using two-sided Fisher’s exact test, x axis) of co-expression of ACE2+TMPRSS2+ in single-cell datasets (dots) from different tissues (y axis). (c,d) Proportion (x axis) of ACE2+ cells per dataset (c) and TMPRSS2+ cells per dataset (d) across different tissues (y axis).
Extended Data Fig. 2.
Extended Data Fig. 2.. A cross-tissue survey of ACE2+CTSL+ cells in published single-cell datasets.
(a) Proportion (x axis) of ACE2+CTSL+ cells per dataset (dots) across different tissues (y axis). (b) Proportion (x axis) of ACE2+CTSL+ cells within clusters annotated by broad cell-type categories (dots) in each of the top 7 enriched datasets (y axis; color legend, inset). (c) Odds ratio (x axis) of ACE2+CTSL+ co-expression in single-cell datasets (dots) from different tissues (y axis). (d) Significance (−log10(p-value) using two-sided Fisher’s exact test, x axis) of co-expression of ACE2 and CTSL in single-cell datasets (dots) from different tissues (y axis). (e) Proportion (x axis) of CTSL+ cells per dataset across different tissues (y axis).
Extended Data Fig. 3.
Extended Data Fig. 3.. Cellular composition and fraction of ACE2+TMPRSS2+ cells across the aggregated lung dataset
(a) Boxplot of normalized donor fractions of ACE2+TMPRSS2+ (double positive - DP) cells per cell type. The box indicates the median and first and third quartile, whiskers extend to points within 1.5 times the interquartile range. For each cell type, only donors that have at least 100 cells of the cell type were included. Cell types with at least 10 ACE2+TMPRSS2+ cells in the entire dataset were labeled, the remaining cell types were grouped under ‘Other’. Cell type labels preceded by a “2” consist of cells that had no annotation available at level 3 and therefore kept their level 2 annotation. Cells with only level 1 annotations were grouped under “Other”. (2_Airway epithelium: n=6, 2_Olfactory epithelium: n=3, 2_fetal airway progenitors: n=5, AT1: n=60, AT2: n=92, Basal: n=56, Multiciliated lineage: n=88, Secretory: n=79, Submucosal Secretory: n=35, Other: n=180 donors.) (b) Percentage of ACE2+TMPRSS2+ cells across 377 samples and with sample composition. Top: Percentage ACE2+TMPRSS2+ cells in each sample, categorized by level 3 annotations. Bottom: Sample compositions. Samples are ordered by age, with 31-week pre-term births and 39-week full-term births both set to age 0. (c) Zoom in on fetal and pediatric samples of plot (b). Samples are ordered and labeled by age. Fetal samples are partitioned into first and second trimester (TM) and pediatric samples are divided into 31-week pre-term births, 39-week full term births, 3 month, 3 year, and 10 year old children. AT1, 2: alveolar type 1, 2. AT2 progenitor cells were grouped under AT2.
Extended Data Fig. 4.
Extended Data Fig. 4.. Chromatin accessibility at the ACE2, TMPRSS and CTSL loci across lung cells in early life
(a) Schematic: single-cell chromatin accessibility by transposome hypersensitive sites sequencing (THS-Seq) from human pediatric samples (full gestation, no known lung disease) collected at day 1 of life, 14 months, 3 years, and 9 years (n=1 at each time point). (b) Accessibility (dot color log normalized gene activity scores), and % of cells with accessible loci (dot size) for the ACE2, TMPRSS, and CTSL loci (columns) across different cell types (rows) in scTHS-Seq with all time points aggregated. (c) Accessibility (dot color log normalized gene activity scores), and % of cells with accessible loci (dot size) of ACE2, TMPRSS and CTSL in AT1--AT2 cells in scTHS-Seq at day 1 of life, 14 months, 3 years, and 9 years (rows). (d) Number of ACE2+CTSL+ and ACE2+TMPRSS2+ cells per time point.
Extended Data Fig. 5.
Extended Data Fig. 5.. ACE2 expression across tissues and cell types.
Shown are fractions of ACE2 expressing cells (dot size) and mean ACE2 expression level in expressing cells (dot color) across datasets (rows) and cell types (columns).
Extended Data Fig. 6.
Extended Data Fig. 6.. Additional analyses to identify other proteases that may have a role in infection.
(a) Multiple proteases are co-expressed with ACE2 in another human lung scRNA-seq (“aggregated lung”). Scatter plot of significance (y axis, −log10(adjusted p value) by two-sided Wald test. (Methods)) and effect size (x axis) of co-expression of each protease gene (dot) with ACE2 within each indicated epithelial cell type (color). Dashed line: significance threshold. TMPRSS2 and PCSKs that significantly co-expressed with ACE2 are marked. (b) ACE2-protease co-expression with PCSKs, TMPRSS2 and CTSL across lung cell types (“aggregated lung”). Significance (dot size, −log10(adjusted p value) by two-sided Wald test. (Methods)) and effect size (color) for co-expression of ACE2 with selected proteases (columns) across cell types (rows). (c-d) Predicted cleavage sites in the SARS-CoV-2 S-protein S1/S2 region. (c) Multiple amino acid sequence alignment of SARS-CoV-2 S-protein S1/S2 region with orthologous sequences from other betacoronaviruses (top) and polybasic cleavage sites of other human pathogenic viruses (bottom). (d) Sequence logo plot showing cleavage site preference derived from MEROPS database for PCSK1, PCSK2, FURIN, PCSK4, PCSK5, PCSK6 and PCSK7. (e) Protease cleavage sites (triangles) predicted by ProP and PROSPERous in the SARS-CoV-2 spike protein. Top: Full-length SARS-CoV-2 S-protein sequence schematic with predicted functional protein domains and motifs. Numbers: amino acid residues after which cleavage occurs; SP: signal peptide; NTD: N-terminal domain; RBD: Receptor-binding domain; FP: Fusion peptide; FP1/2: Fusion peptide 1/2; HR1: Heptad repeat 1; CH: connecting helix; HR2: Heptad repeat 2; TM: Transmembrane domain. (f,g) Multiple proteases are expressed across lung cell types (“aggregated lung”). (f) Distribution of non-zero expression (y axis) for ACE2, PCSKs and TMPRSS2 across lung cell types (x axis). White dot: median non-zero expression. (g) Proportion of cells (y axis) expressing ACE2, PCSK family or TMPRSS2 across lung cell types (x axis), ordered by compartment. (h) ACE2+PCSK+ double positive cells across lung cell types. Fraction (y axis) of different ACE2+PCSK+ or ACE2+TMPRSS2+ double positive cells across lung cell types, ordered by compartment (x axis). Dots: different samples, line: median of non-zero fractions. (i,j) ACE2+PCSK+ co-expression across human tissues (collection of published scRNA seq datasets). (i) Percent (y axis) of different ACE2+PCSK+ or ACE2+TMPRSS2+ double positive cells across human tissues (x axis). Dots: different single-cell datasets, line: median of non-zero fractions. (j) ACE2 co-expression with PCSKs or TMPRSS2 across human tissues. Significance (dot size, −log10(adjusted p value) by two-sided Wald test. (Methods)) and effect size (dot color) of co-expression. (k) Fraction of ACE2+TMPRSS2+ PCSK+ cells across lung cell types (“Regev/Rajagopal dataset”). Dots: samples, line: median of non-zero fractions.
Extended Data Fig. 7.
Extended Data Fig. 7.. ACE2, TMPRSS2, CTSL Immunofluorescence and RNA profiling
(a) Negative control of PLISH in human lung alveoli. Left shows scrambled probe detection in three indicated colors. Right shows HTII-280 antibody staining (red) with 2 color scramble probe detection. DAPI (blue) indicates nuclei. (b) Frequency of ACE2, CTLS and TMPRSS2 triple positive cells in each sample (n = 60) (dots) in the Regev/Rajagopal dataset. (c) PLISH and immunostaining in human adult lung alveoli for ACE2 (red), PRO-SFTPC (green), DAPI (blue). (d) Immunostaining in human adult lung alveoli. HTII-280 (green) , TMPRSS2 (red) and AGER (white). Blue shows DAPI in nuclei. (e) Mean expression (y axis, FPKM, from bulk RNA-seq, error bars: standard error) of ACE2, CTSL, TMPRSS2 in sorted cells from 3 different human explant donors using the following markers: large and small airway basal cells (NGFR+), AT2 cells (HT-II 280+) and alveolar organoids (HT-II 280+). (f) Expression in the submucosal gland. Mean expression (color) and proportion of expressing cells (dot size) of ACE2, TMPRSS2 and CTSL in key cell types (rows), from scRNA-seq of human large airway submucosal glands. (g) PLISH and immunostaining in human large airway submucosal glands. ACE2 (red), ACTA2 (green) and DAPI (blue). We imaged one representative area for a single patient for a,c,d,g (Methods).
Extended Data Fig. 8.
Extended Data Fig. 8.. An overview of the three-level lung cell ontology used for cell annotation harmonization.
Extended Data Fig. 9.
Extended Data Fig. 9.. Age, sex, and smoking status associations with expression of ACE2, TMPRSS2, and CTSL across level 3 cell type annotations modeled without interaction terms.
(a) Age, sex, and smoking assocations with expression of ACE2 (blue), TMPRSS2 (yellow), and CTSL (green) modeled without interaction terms on 985,420 cells from 164 donors. Level 3 cell types are shown on the y-axes, and are subdivided by level 1 cell type annotations (top to bottom: epithelial, endothelial, stromal and immune cells). The effect size (x axis) is given as a log fold change (sex, smoking status) or the slope of log expression per year (age). Positive effect sizes indicate increases with age, in males, and in smokers. As the age effect size is given per year, it is not directly comparable to the sex and smoking status effect sizes. Colored bars: associations with an FDR-corrected p-value<0.05 (one-sided Wald test on regression model coefficients), consistent effect direction in pseudo-bulk analysis, and consistent results using the model with interaction terms (Methods). White bars: associations that do not pass all of the three above-mentioned evaluation criteria. Error bars: standard errors around coefficient estimates. Error bars are only shown for colored bars (indications or robust trends) to limit figure size. Only cell types with at least 1000 cells across donors are included. Number of cells and donors per cell type: Basal: 155877, 105, Multiciliated lineage: 37530, 157, Secretory: 22306, 140, Rare: 2676, 71, Submucosal secretory: 33661, 45, AT1: 29973, 101, AT2: 155512, 104, Arterial: 3497, 37, Capillary: 15745, 34, Venous: 7173, 33, Lymphatic EC: 5055, 76, Fibroblasts: 9112, 51, Airway smooth muscle: 1077, 13, B cell lineage: 11761, 90, T cell lineage: 52139, 97, Innate lymphoid cells: 29836, 56, Dendritic cells: 9017, 90, Macrophages: 156964, 89, Monocytes: 42703, 96, Mast cells: 13581 cells, 88 donors. (b) Robustness of associations to holding out a dataset. The values show the number of held-out datasets that result in loss of association between a given covariate (rows) and ACE2, TMPRSS2, or CTSL expression in a given cell type (columns). Robust trends are determined by significant effects that are robust to holding out any dataset (0 values). From left to right: results for ACE2, TMPRSS2, and CTSL. AT1, 2: alveolar type 1, 2. EC: endothelial cell.
Extended Data Fig. 10.
Extended Data Fig. 10.. ACE2 and TMPRSS2 are up-regulated in bronchial brushings from current versus former smokers.
Boxplots of log counts per million normalized gene expression for ACE2 and TMPRSS2 are plotted across current (red, n=70 samples) versus former (green, n=60 samples) smokers. Both genes are significantly up-regulated in current versus former/never (ACE2, FDR=0.006; and TMPRSS2, FDR=0.00004) based on a linear model using voom-transformed data that included genomic smoking status, batch, and RNA quality (TIN) as covariates and patient as a random effect. Multiple testing correction was performed via Benjamini-Hochberg to obtain an FDR-corrected p-value. (Methods)
Figure 1.
Figure 1.. A cross-tissue survey of ACE2+TMPRSS2+ cells shows enrichment in cells at reported sites of disease transmission or pathogenesis.
(a,b) Double positive cells are more prevalent in epithelial organs and cells. (a) Proportion of ACE2+TMPRSS2+ cells (y axis) per dataset (dots) from 21 tissues and organs (rows). (b) Proportion of ACE2+TMPRSS2+ cells (y axis) within cell clusters (dots) annotated by broad cell-type categories (rows) within each of the top 7 enriched datasets (color legend, inset). (c,d) Significant co-expression of ACE2+TMPRSS2+ or ACE2+CTSL+ highlights cells from tissues implicated in transmission or pathogenesis. Significance of co-expression (dot size −log10(adjusted P-value), by two-sided Wald test (Methods); red border: FDR<0.1) of ACE2+TMPRSS2+ (c) or ACE2+CTSL+ (d) and effect size (dot color, color bar) for finely annotated cell classes (columns) from diverse tissues (rows). Only tissues and cells in at least one significant co-expression relationship are shown (Methods). (e-h) In situ validation of double positive cells in the lung, airways, and submucosal gland (n = 3 donors per experiment, imaged three randomly chosen areas per donor). PLISH and immunostaining (e,g) and quantification (error bars: standard error) (f,h) in human adult lung alveoli for (e) ACE2 (white), TMPRSS2 (green) and CTSL (red) (total of 1487 DAPI positive cells examined for quantification (f)) and (g) ACE2 (white), TMPRSS2 (green) and HTII-280 (red) (total of HTII-280 positive 482 cells examined for qualitification (h)).
Figure 2.
Figure 2.. ACE2-protease co-expression and SARS-CoV-2 S-protein cleavage sites suggest a possible role for additional proteases in infection.
(a) Multiple proteases are co-expressed with ACE2 in human lung scRNA-seq. Scatter plot of significance (y axis, −log10(adjusted P value)), by two-sided Wald test. (Methods) and effect size (x axis) of co-expression of each protease gene (dot) with ACE within each indicated epithelial cell type (color). Dashed line: significance threshold. TMPRSS2 and PCSKs that significantly co-expressed with ACE2 are marked. (b) ACE2-protease co-expression with PCSKs, TMPRSS2 and CTSL across lung cell types. Significance (dot size, −log10(adjusted P value), by two-sided Wald test. (Methods)) and effect size (color) for co-expression of ACE2 with selected proteases (columns) across cell types (rows). (c,d) Multiple proteases are expressed across lung cell types. (c) Distribution of non-zero expression (y axis) for ACE2, PCSKs and TMPRSS2 across lung cell types (x axis). White dot: median non-zero expression. (d) Proportion of cells (y axis) expressing ACE2, PCSK family or TMPRSS2 across lung cell types (x axis), ordered by compartment. (e) ACE2+PCSK+ double positive cells across lung cell types. Fraction (y axis) of different ACE2+PCSK+ or ACE2+TMPRSS2+ double positive cells across lung cell types (x axis). Dots: different samples, line: median of non-zero fractions. (f) ACE2-protease co-expression analysis for the 20 most significant human proteases in AT2 cells. Significance (dot size, −log10(adjusted P value), by two-sided Wald test. (Methods)) and effect size (color) for co-expression of ACE2 with different proteases (columns) across cell types (rows). (g) Additional protease expression in ACE2+TMPRSS2+ double positive cells. Significance (y axis, −log10(adjusted P value), by two-sided Wald test. (Methods)) and fold change (x axis) of differential expression for each human protease between ACE2+TMPRSS2+ double positive vs double negative cells within each indicated epithelial cell types (color). Significantly differentially expressed proteases within AT2 cells and PCSKs across all epithelial cell types are highlighted.
Figure 3.
Figure 3.. ACE2, TMPRSS2, and CTSL expression increases with age and in men, and shows cell type specific associations with smoking
(a) Samples in the aggregated lung and airway dataset partition to several classes by their cell composition. Percentage of cells (y axis) by level 2 cell annotations (Annotations with a preceding “1” indicate coarse annotations of cells that had no annotation at level 2) across samples (x axis). The 377 samples are ordered by sample composition clusters (Methods). (b) Schematic of key lung and airway epithelial cell types highlighted in the study. (c) Distribution of normalized ACE2 and TMPRSS2 expression across level 3 lung cell types in 1,031,254 cells from 228 donors. Red shading indicates the main cell types that express both ACE2 and TMPRSS2. (d) Age, sex, and smoking status associations with expression of ACE2 (blue), TMPRSS2 (orange), and CTSL (green) in level 3 epithelial cells. The effect size (x axis) of the association is given as a log fold change (sex, smoking status) or the slope of log expression per year with age. As the age effect size is given per year, it is not directly comparable to the sex and smoking status effect sizes. Positive effect sizes indicate increases with age, in males, and in smokers. Colored bars: associations with an FDR-corrected p-value<0.05 (one-sided Wald test on regression model coefficients), consistent effect direction in pseudo-bulk analysis, and consistent results using the model with interaction terms (Methods). White bars: associations that do not pass all of the three above-mentioned evaluation criteria. Error bars: standard errors around coefficient estimates. Error bars are only shown for colored bars (indications or robust trends) to limit figure size. Number of donors and cells per cell type: Basal: 155877, 105, Multiciliated lineage: 37530, 157, Secretory: 22306, 140, Rare: 2676, 71, Submucosal secretory: 33661, 45, AT1: 29973, 101, AT2: 155512 cells, 104 donors. AT1, AT2: alveolar type 1, 2; EC: endothelial cell; MDC: monocyte derived cell.
Figure 4:
Figure 4:. Tissue and cell-type-specific gene modules in ACE2+TMPRSS2+ cells highlight immune and inflammatory features
(a,b) Tissue programs of ACE2+TMPRSS2+ cells in lung, gut, and nasal samples. (a) Selected tissue program genes. Node: gene; Edge: program membership. Genes are selected heuristically for visualization (Methods). (b) Enrichment was tested using a hypergeometric test exactly as performed by gprofiler in scanpy.queries.enrich (−log10(adj P-value), x axis) of KEGG pathway gene sets (y axis) in the full tissue programs. (c-e) Cell programs of ACE2+TMPRSS2+ cells. (c,d) Top 12 genes from each cell program recovered for different lung (c) or (d) nasal epithelial cell-type (nodes, colors). Colored concentric circles: overlap with a gene in the top 250 significant genes in other cell types. ACE2 and TMPRSS2 are included even if not among the top 12. (e) Enrichment (−log10(adj P-value), x axis) of KEGG disease and non-disease pathway gene sets in either highly significant genes across all tissues (top) or in specific tissues (lung, nose, bottom). (f) Motif activity in immune TFs in ACE2+ cells. Significance (−log10(adjusted p-value), x axis) of the top 10 differential “motif activity scores” (Methods) between epithelial ACE2+ cells or ACE2 cells (y axis). (Epithelial cells are: AT1, AT2, secretory, ciliated, ionocytes, and neuroendocrine cells, highlighted in the gray shaded area in Supplementary Fig. 1a). (n=2 locations: primary carina and lung lobes, n=3 samples per location, n=1 patient). Motifs are extracted from the JASPAR2020 database, motif code is shown in each row. Dashed line: threshold for significance (adjusted p-value of 0.05). P-values were calculated by logistic regression and likelihood ratio test, adjusted through Bonferroni correction (see Methods).
Figure 5:
Figure 5:. Ace2, Tmprss2 and Ctsl expression in mouse in similar cell types and follows similar patterns with age and smoking.
(a) Gradual increase in Ace2 expression by airway epithelial cell type with age. Mean expression (y axis) of Ace2 in different airway epithelial cells (x axis) of mice of three consecutive ages (color legend, upper right). Shown are replicate mice (dots, n=3 for each age), mean (bar), and error bars (standard error of the mean (SEM)). The effect of mouse age was tested using a two-sided Wald test (p-values). (b) Increase in proportion of Ace2+Ctsl+ goblet and club cells with age. Percent of Ace2+Ctsl+ cells (x axis) in different airway epithelial cell types (y axis) of mice of three consecutive ages (color legend, upper right). Shown are replicate mice (dots), mean (bar), and error bars (SEM). The effect of mouse age was tested using Wald test (p-values). (c-k) Increase in Ace2 expression in secretory cells with smoking. Mice were daily exposed to cigarette smoke or filtered air (FA) as control for two months after which cells from whole lung suspensions were analyzed by scRNA-seq (Drop-Seq). (c,d) UMAP of scRNA-seq profiles (dots) colored by experimental group (c) or by Ace2+ cells and indicated double positive cells (d). Alveolar epithelial cells (AT1 and AT2) and airway epithelial secretory and ciliated cells are marked. (f) The relative frequency of Ace2+ cells is increased by smoking in airway secretory cells but not AT2 cells. Relative proportion (y axis) of Ace2+ (red) and Ace2 (grey) cells in smoking and control mice of different cell types (x axis) (filtered air (FA): n = 9 mice, smoke exposed: n=5 mice, error bars represent 95% confidence intervals). (g, h) Expression of Ace2 is increased in airway secretory cells (filtered air: 187 cells, smoke exposure: 62 cells) , but not in AT2 cells (filtered air: 3808, smoke exposure: 1882). Distribution of Ace2 expression (y axis) in secretory (f) and AT2 (g) cells from control and smoking mice (x axis), (p-value = 1.5 10−6 by Wilcoxon rank-sum test). (i-k) Re-analysis of published bulk mRNA-Seq74 of lungs exposed to different daily doses of cigarette smoke show increased expression of (i) Ace2, (j) Tmprss2, and (k) Ctsl after five months of chronic exposure. n=8 mice per condition. Bars show mean, error bars show standard error. (** p=0.0046, *** p=0.0002, **** p<0.0001, one-way ANOVA with Dunnett’s multiple comparisons test, compared to Air group.) (l) Expression in placenta. Mean expression (color) and proportion of expressing cells (dot size) of Ace2, Tmprss2 and Ctsl along with marker genes (see Supplementary Fig. 14) in single and double positive cells from embryonic days 9.5 to 18 of mouse placenta development.

References

    1. Wang D et al. Clinical Characteristics of 138 Hospitalized Patients With 2019 Novel Coronavirus–Infected Pneumonia in Wuhan, China. JAMA 323, 1061–1069 (2020). - PMC - PubMed
    1. Huang C et al. Clinical features of patients infected with 2019 novel coronavirus in Wuhan, China. Lancet 395, 497–506 (2020). - PMC - PubMed
    1. Chen N et al. Epidemiological and clinical characteristics of 99 cases of 2019 novel coronavirus pneumonia in Wuhan, China: a descriptive study. Lancet 395, 507–513 (2020). - PMC - PubMed
    1. Wang W et al. Detection of SARS-CoV-2 in Different Types of Clinical Specimens. JAMA (2020) doi: 10.1001/jama.2020.3786. - DOI - PMC - PubMed
    1. Jia HP et al. ACE2 receptor expression and severe acute respiratory syndrome coronavirus infection depend on differentiation of human airway epithelia. J. Virol 79, 14614–14621 (2005). - PMC - PubMed

Methods references

    1. Korsunsky I et al. Fast, sensitive and accurate integration of single-cell data with Harmony. Nat. Methods 16, 1289–1296 (2019). - PMC - PubMed
    1. Law CW, Chen Y, Shi W & Smyth GK voom: Precision weights unlock linear model analysis tools for RNA-seq read counts. Genome Biol. 15, R29 (2014). - PMC - PubMed
    1. Seabold S & Perktold J Statsmodels: Econometric and statistical modeling with python. in Proceedings of the 9th Python in Science Conference vol. 57 61 (Austin, TX, 2010).
    1. Wolf FA, Angerer P & Theis FJ SCANPY: large-scale single-cell gene expression data analysis. Genome Biol. 19, 15 (2018). - PMC - PubMed
    1. West BT, Welch KB & Galecki AT Linear Mixed Models: A Practical Guide Using Statistical Software, Second Edition. (CRC Press, 2014).

Publication types

MeSH terms

Grants and funding