. 2021 Feb;67(1):49-57.
doi: 10.1093/cz/zoaa041. Epub 2020 Jul 29.

Formidable females redux: male social integration into female networks and the value of dynamic multilayer networks

Affiliations

Formidable females redux: male social integration into female networks and the value of dynamic multilayer networks

Tyler R Bonnell et al. Curr Zool. 2021 Feb.

Abstract

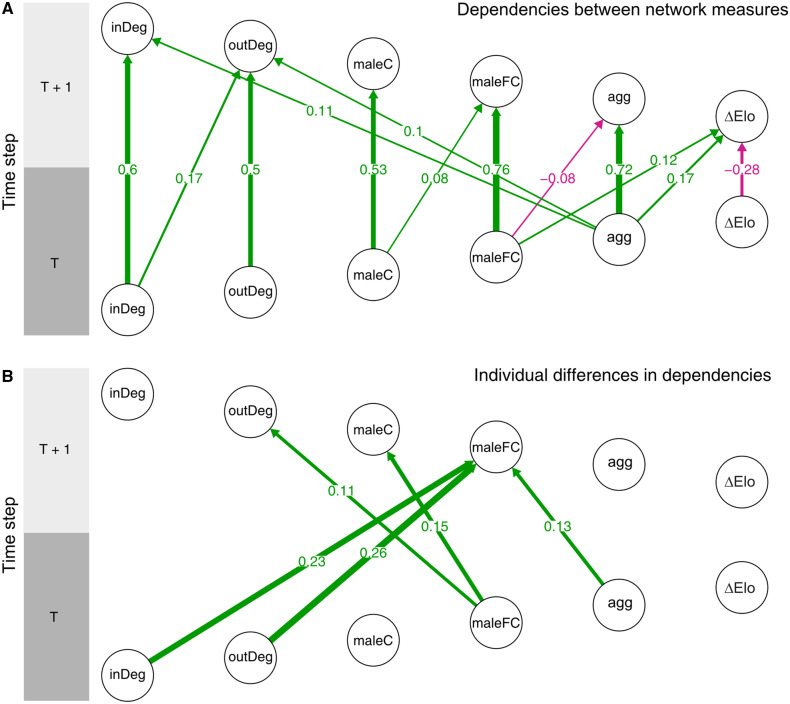
The development of multilayer network techniques is a boon for researchers who wish to understand how different interaction layers might influence each other, and how these in turn might influence group dynamics. Here, we investigate how integration between male and female grooming and aggression interaction networks influences male power trajectories in vervet monkeys Chlorocebus pygerythrus. Our previous analyses of this phenomenon used a monolayer approach, and our aim here is to extend these analyses using a dynamic multilayer approach. To do so, we constructed a temporal series of male and female interaction layers. We then used a multivariate multilevel autoregression model to compare cross-lagged associations between a male's centrality in the female grooming layer and changes in male Elo ratings. Our results confirmed our original findings: changes in male centrality within the female grooming network were weakly but positively tied to changes in their Elo ratings. However, the multilayer network approach offered additional insights into this social process, identifying how changes in a male's centrality cascade through the other network layers. This dynamic view indicates that the changes in Elo ratings are likely to be short-lived, but that male centrality within the female network had a much stronger impact throughout the multilayer network as a whole, especially on reducing intermale aggression (i.e., aggression directed by males toward other males). We suggest that multilayer social network approaches can take advantage of increased amounts of social data that are more commonly collected these days, using a variety of methods. Such data are inherently multilevel and multilayered, and thus offer the ability to quantify more precisely the dynamics of animal social behaviors.

Keywords: multilayer networks; multilevel multivariate autoregressive model; primate social dynamics; social networks; sociality; time-aggregated networks; vervet monkeys.


Figures

Figure 1.
Figure 1.
Illustrative diagram of the construction of the dynamic multilayer network. The network is composed of 2 behavioral layers, aggression, and grooming, broken into sex-specific layers, male (blue) and female (orange). This construction is then shifted through time (using a 30-day window) to generate a time series of networks.
Figure 2.
Figure 2.
Estimated lagged and cross-lagged associations for (A) main effects and (B) individual-level differences. Edges between nodes represent associations, red for negative, green for positive, where the width of the edge corresponds to the magnitude of the association. In (a), edges for associations where 95% CI contained 0 were removed for visual clarity. Similarly, in (b), as edges represent estimates of standard deviation, we chose to remove edges when the 95% CI estimates contained 0.01, highlighting those estimates likely to contain individual differences. Node labels: grooming in-degree (inDeg), grooming out-degree (outDeg), male centrality in the male grooming layer (maleC), male centrality in the female grooming layer (maleFC), aggression in-degree (agg), and change in Elo rating (ΔElo). The top nodes represent measures at time T + 1, whereas those below represent those measures at the previous time point (T).
Figure 3.
Figure 3.
Model predicted mean change to all network-level measures following an introduced change in 1 measure: (A) rank increase, (B) increase in aggression, (C) increase in centrality within the female network, (D) increase in centrality in the male network, (E) increase in out-grooming partners, and (F) increase in in-grooming partners. Shaded regions indicate the 95% credible interval from 100 simulated predictions. Time on the x-axis is in months. In each panel, there is an induced change in 1 measure at t =0, and the cascade of impacts on all measures can then be seen to the right of the induced change, in terms of both their amplitude (height on the y-axis) and duration of their effects (how long the measure takes to return to 0 on the x-axis). As all measures have been scaled the induced change of 2 scaled units would be considered as a large positive change.
Figure 4.
Figure 4.
Model predictions including the influence of uncertainty on the development of a male’s social network measures. Initial conditions are set to the mean level of each social network measure, with no induced changes, that is, all changes observed in the plot are due to the effects of noise (and the interdependence in noise between social network measures) for (A) 100 simulated model predictions summarized into a mean line and 95% credible interval ribbons and (B) 1 simulated model prediction.

Similar articles

Cited by

References

    1. Albers PC, Vries H, 2001. Elo-rating as a tool in the sequential estimation of dominance strengths. Anim Behav 61:489–495.
    1. Alberts SC, 2019. Social influences on survival and reproduction: insights from a long‐term study of wild baboons. J Anim Ecol 88:47–66. - PMC - PubMed
    1. Allen J, Weinrich M, Hoppitt W, Rendell L, 2013. Network-based diffusion analysis reveals cultural transmission of lobtail feeding in humpback whales. Science 340:485–488. - PubMed
    1. Altizer S, Nunn CL, Thrall PH, Gittleman JL, Antonovics J et al., 2003. Social organization and parasite risk in mammals: integrating theory and empirical studies. Annu Rev Ecol Evol Syst 34:517–547.
    1. Barrett L, Henzi SP, Lusseau D, 2012. Taking sociality seriously: the structure of multi-dimensional social networks as a source of information for individuals. Philos Trans R Soc Lond B Biol Sci 367:2108–2118. - PMC - PubMed