. 2019 Sep 5;9(17):e3359.
doi: 10.21769/BioProtoc.3359.

Yeast Single-cell RNA-seq, Cell by Cell and Step by Step

Affiliations

Yeast Single-cell RNA-seq, Cell by Cell and Step by Step

Mariona Nadal-Ribelles et al. Bio Protoc. .

Abstract

Single-cell RNA-seq (scRNA-seq) has become an established method for uncovering the intrinsic complexity within populations. Even within seemingly homogenous populations of isogenic yeast cells, there is a high degree of heterogeneity that originates from a compact and pervasively transcribed genome. Research with microorganisms such as yeast represents a major challenge for single-cell transcriptomics, due to their small size, rigid cell wall, and low RNA content per cell. Because of these technical challenges, yeast-specific scRNA-seq methodologies have recently started to appear, each one of them relying on different cell-isolation and library-preparation methods. Consequently, each approach harbors unique strengths and weaknesses that need to be considered. We have recently developed a yeast single-cell RNA-seq protocol (yscRNA-seq), which is inexpensive, high-throughput and easy-to-implement, tailored to the unique needs of yeast. yscRNA-seq provides a unique platform that combines single-cell phenotyping via index sorting with the incorporation of unique molecule identifiers on transcripts that allows to digitally count the number of molecules in a strand- and isoform-specific manner. Here, we provide a detailed, step-by-step description of the experimental and computational steps of yscRNA-seq protocol. This protocol will ease the implementation of yscRNA-seq in other laboratories and provide guidelines for the development of novel technologies.

Keywords: Noncoding RNA; Single-cell RNA-seq; Transcript isoforms; Transcriptomics; Yeast.


Conflict of interest statement

Competing interestsThe authors declare no financial or non-financial interests.

Figures

Figure 1.
Figure 1.. Representative example of Ct Values obtained by qPCR.
The scatter plot represents the cycle amplification (Ct value) of a yscRNA-seq 96-well plate. Each dot represents the value obtained using a yeast housekeeping gene (TDH3, x-axis) as a function of the index-sorting value for cell size (Forward Scatter (FSC), y-axis). Dotted line (Ct > 25) displays the threshold used to discriminate positive and negative wells. The label displays the Ct value for the not sorted well H12 (which is used as a negative control).
Figure 2.
Figure 2.. Representative Bioanalyzer traces of full-length cDNA obtained with yscRNA-seq (Step C1)
. cDNA libraries obtained from step (Step B28) were run on a DNA High Sensitivity CHIP (Agilent 5067-4626) for validation. Library concentration was also measured by Qubit High Sensitivity (Thermo Fisher). Left panel (A1) represents the lower limit of library quality that we sequenced while middle (A5) and right (B2) panel represent average libraries (Figure adapted from Nadal- Ribelles et al., 2019 ).
Figure 3.
Figure 3.. Representative Bioanalyzer traces obtained from yscRNA-seq.
Two representative samples obtained from approximately 80 cells. Concentration of each library is shown and was determined by qPCR (Step D3). Figure from Nadal- Ribelles et al., 2019 .
Figure 4.
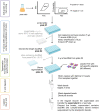
Figure 4.. Schematic representation of yscRNA-seq.
Images from Smart Medical server (Les Laboratoires Servier, SMART Servier Medical Art.).
Figure 5.
Figure 5.. Schematic representation of analysis pipeline of yscRNA-seq

Similar articles

Cited by

References

    1. Conesa A., Madrigal P., Tarazona S., Gomez-Cabrero D., Cervera A., McPherson A., Szczesniak M. W., Gaffney D. J., Elo L. L., Zhang X. and Mortazavi A.(2016). A survey of best practices for RNA-seq data analysis. Genome Biol 17: 13. - PMC - PubMed
    1. David L., Huber W., Granovskaia M., Toedling J., Palm C. J., Bofkin L., Jones T., Davis R. W. and Steinmetz L. M.(2006). A high-resolution map of transcription in the yeast genome. Proc Natl Acad Sci U S A 103(14): 5320-5325. - PMC - PubMed
    1. Dobin A., Davis C. A., Schlesinger F., Drenkow J., Zaleski C., Jha S., Batut P., Chaisson M. and Gingeras T. R.(2013). STAR: ultrafast universal RNA-seq aligner. Bioinformatics 29(1):15-21. - PMC - PubMed
    1. Gasch A. P., Yu F. B., Hose J., Escalante L. E., Place M., Bacher R., Kanbar J., Ciobanu D., Sandor L., Grigoriev I. V., Kendziorski C., Quake S. R. and McClean M. N.(2017). Single-cell RNA sequencing reveals intrinsic and extrinsic regulatory heterogeneity in yeast responding to stress. PLoS Biol 15(12): e2004050. - PMC - PubMed
    1. Gresham D., Bonneau R., Jackson C. A., Castro D. M. and Saldi G. A.(2019). Gene regulatory network reconstruction using single-cell RNA sequencing of barcoded genotypes in diverse environments. bioRxiv doi: 10.1101/581678. - DOI - PMC - PubMed