SIRF: A Single-cell Assay for in situ Protein Interaction with Nascent DNA Replication Forks
- PMID: 33654873
- PMCID: PMC7854004
- DOI: 10.21769/BioProtoc.3377
SIRF: A Single-cell Assay for in situ Protein Interaction with Nascent DNA Replication Forks
Abstract
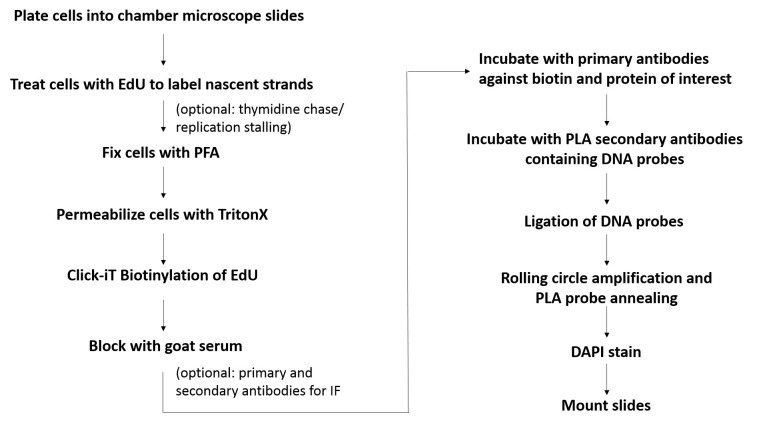
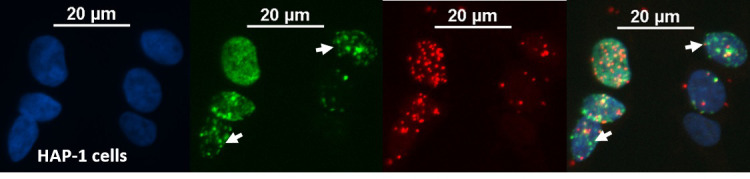
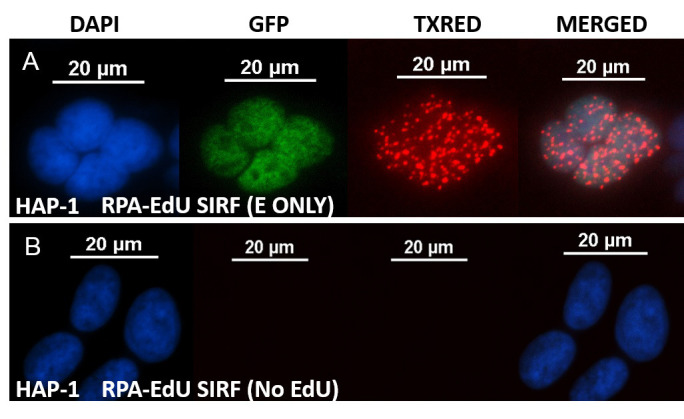
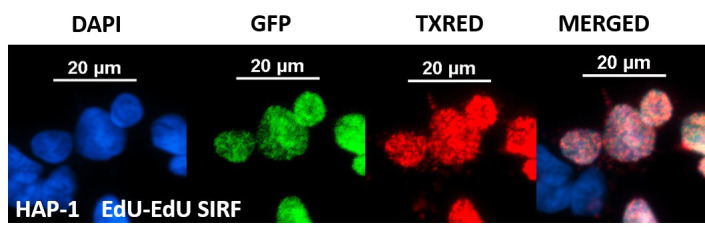
The duplication of DNA is a fundamental process that is required for the transfer of the genetic information from parent to daughter cells. Aberrant DNA replication processes are associated with diverse disease phenotypes, including developmental defects, ageing disorders, blood disorders such as Fanconi Anemia, increased inflammation and cancer. Therefore, the development of tools to study proteins associated with error-free DNA replication processes is of paramount importance. So far, methods to study proteins associated with nascent replication forks relied on conventional immunofluorescence and immunoprecipitation assays of 5'-ethylene-2'-deoxyuridine (EdU) labeled DNA (iPOND). While greatly informative and important, these methods lack specificities for nascent fork interactions (e.g., IF) or assay an average change of millions of cells without single-cell resolution (e.g., iPOND). The assay system described here combines proximity ligation assay (PLA) with EdU coupled click-iT chemistry, which we termed "in situ protein interaction with nascent DNA replication forks (SIRF)". This method enables sensitive and quantitative analysis of protein interactions with nascent DNA replication forks with single-cell resolution, and can further be paired with conventional immunofluorescence marker analysis for added multi-parameter analysis.
Keywords: DNA replication; Fork protection; Genome instability; IPOND; Proximity ligation assay; SIRF; Stalled replication forks.
Copyright © 2019 The Authors; exclusive licensee Bio-protocol LLC.
Conflict of interest statement
Competing interestsThe authors declare no conflicts of interest.
Figures
References
-
- Gonchoroff N. J., Katzmann J. A., Currie R. M., Evans E. L., Houck D. W., Kline B. C., Greipp P. R. and Loken M. R.(1986). S-phase detection with an antibody to bromodeoxyuridine. Role of DNase pretreatment. J Immunol Methods 93(1): 97-101. - PubMed
-
- Leif R. C., Stein J. H. and Zucker R. M.(2004). A short history of the initial application of anti-5-BrdU to the detection and measurement of S phase. Cytometry A 58(1): 45-52. - PubMed
-
- Loeb L. A. and Monnat R. J., Jr (2008). DNA polymerases and human disease. Nat Rev Genet 9(8): 594-604. - PubMed
LinkOut - more resources
Full Text Sources
Miscellaneous