. 2020;101(14):10.1103/physrevb.101.140504.
doi: 10.1103/physrevb.101.140504.

Anisotropic effect of a magnetic field on the neutron spin resonance in FeSe

Affiliations

Anisotropic effect of a magnetic field on the neutron spin resonance in FeSe

Tong Chen et al. Phys Rev B. 2020.

Abstract

We use inelastic neutron scattering to study the effect of a magnetic field on the neutron spin resonance (E r = 3.6 meV) of superconducting FeSe (T c = 9 K). While a field aligned along the in-plane direction broadens and suppresses the resonance, a c-axis aligned field does so much more efficiently, consistent with the anisotropic field-induced suppression of the superfluid density from the heat capacity measurements. These results suggest that the resonance in FeSe is associated with the superconducting electrons arising from orbital selective quasiparticle excitations between the hole and electron Fermi surfaces.


Figures

FIG. 1.
FIG. 1.
(a) Schematic illustration of the Zeeman splitting of the spin exciton from singlet |0 to triplet |1 excited states. (b) Schematic illustration of a singlet-to-doublet excitation. (c) Crystal structure of FeSe. (d) Reciprocal space where the blue dots represent the QAF = (1,0) wave vector. The background position at Qbkgd = (0.977,0.213,0) is marked as a small circle. (e) PANDA measurements of the energy dependence of the scattering below (blue circles) and above (yellow circles) Tc at QAF = (1,0). The background scattering is shown as black circles. The error bars indicate statistical errors of one standard deviation. (f) Schematic of normalized peaks and excitation positions of the resonance in FeSe as a function of increasing magnetic field. Solid lines are E± = Er ± 2μBB and Er. Dashed lines are guides to the eye for a c-axis aligned field.
FIG. 2.
FIG. 2.
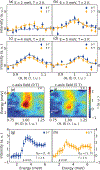
(a)–(d) Constant-energy scans along the [1,0] direction at E = 2.5, 3.5, 4.5, and 5.5 meV in zero and 8.5 T in-plane magnetic fields at T = 2 K. (e) and (f) 2D images of wave-vector and energy dependence of the spin fluctuations in 0 and 8.5 T in-plane magnetic fields at T = 2 K. (g) and (h) are constant-Q cuts at the QAF position from (e) and (f), respectively. They have been smoothed two times by the 2D data processing method in the DAVE-MSLICE program at NCNR. The arrows in (e)–(h) indicate the lowest energy where a Gaussian can be fit to the data. The scattering of an assembly of Al plates coated with CYTOP, as well as a constant adjusted to force the scattering at E = 2.4 meV and QAF to be zero [Fig.4(b)], was subtracted as background in (e)–(h) [48]. The monitor counts in (e)–(h) are normalized to an arbitrary unit (a.u.) and can be compared directly. L is integrated in all panels, because spin fluctuations have no c-axis modulations in FeSe. The error bars indicate statistical errors of one standard deviation.
FIG. 3.
FIG. 3.
(a)–(d) Constant-energy scans along the [1,0] direction at E = 2, 3, 4, and 5 meV in zero and 5 T c-axis aligned magnetic fields at T = 2 K. (e) and (f) 2D images of wave-vector and energy dependence of the resonance in zero and 5 T magnetic fields at 2 K. The background subtraction process is similar to that of Fig. 2 [48]. (g) and (h) are constant-Q cuts at the QAF position from (e) and (f), respectively. They have been smoothed two times by the 2D data processing method in the DAVE-MSLICE program at NCNR. The arrows in (e)–(h) indicate the lowest energy where a Gaussian can be fit to the data. The error bars indicate statistical errors of one standard deviation.
FIG. 4.
FIG. 4.
(a) Constant-Q scans at QAF and the off-peak background positions at 2 K in zero field as shown in Fig. 1(d). (b)–(d) Constant-Q scans with background subtracted in 0, 2.5, and 5 T c-axis aligned fields. The error bars indicate statistical errors of one standard deviation.

References

    1. Bardeen J, Cooper LN, and Schrieffer JR, Microscopic theory of superconductivity, Phys. Rev 106, 162 (1957).
    1. Norman MR, The challenge of unconventional superconductivity, Science 332, 196–200 (2011). - PubMed
    1. Keimer B, Kivelson SA, Norman MR, Uchida S, and Zaanen J, From quantum matter to high-temperature superconductivity in copper oxides, Nature (London) 518, 179 (2015). - PubMed
    1. Scalapino DJ, A common thread: The pairing interaction for unconventional superconductors, Rev. Mod. Phys 84, 1383 (2012).
    1. Eschrig M, The effect of collective spin-1 excitations on electronic spectra in high-Tc superconductors, Adv. Phys 55, 47 (2006).

LinkOut - more resources