. 2021 Feb 23;3(1):lqab011.
doi: 10.1093/nargab/lqab011. eCollection 2021 Mar.

Single-cell mapper (scMappR): using scRNA-seq to infer the cell-type specificities of differentially expressed genes

Affiliations

Single-cell mapper (scMappR): using scRNA-seq to infer the cell-type specificities of differentially expressed genes

Dustin J Sokolowski et al. NAR Genom Bioinform. .

Abstract

RNA sequencing (RNA-seq) is widely used to identify differentially expressed genes (DEGs) and reveal biological mechanisms underlying complex biological processes. RNA-seq is often performed on heterogeneous samples and the resulting DEGs do not necessarily indicate the cell-types where the differential expression occurred. While single-cell RNA-seq (scRNA-seq) methods solve this problem, technical and cost constraints currently limit its widespread use. Here we present single cell Mapper (scMappR), a method that assigns cell-type specificity scores to DEGs obtained from bulk RNA-seq by leveraging cell-type expression data generated by scRNA-seq and existing deconvolution methods. After evaluating scMappR with simulated RNA-seq data and benchmarking scMappR using RNA-seq data obtained from sorted blood cells, we asked if scMappR could reveal known cell-type specific changes that occur during kidney regeneration. scMappR appropriately assigned DEGs to cell-types involved in kidney regeneration, including a relatively small population of immune cells. While scMappR can work with user-supplied scRNA-seq data, we curated scRNA-seq expression matrices for ∼100 human and mouse tissues to facilitate its stand-alone use with bulk RNA-seq data from these species. Overall, scMappR is a user-friendly R package that complements traditional differential gene expression analysis of bulk RNA-seq data.


Figures

Figure 1.
Figure 1.
Schematic of the data required to run scMappR and the primary functionalities that scMappR provides. scMappR requires input RNA-seq count data, a list of differentially expressed genes, and a signature matrix (provided by the user or scMappR). For each gene, scMappR then makes cell-type expression independent of estimated cell-type proportions. scMappR then integrates cell-type expression, cell-type proportion, and the ratio of cell-type proportions between biological conditions to generate cell-weighted Fold-changes (cwFold-changes). These cwFold-changes are then visualized (bottom left) and re-ranked before scMappR computes and plots cell-type specific pathway analyses (bottom right).
Figure 2.
Figure 2.
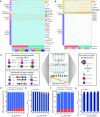
Evaluation of scMappR performance using simulated RNA-seq data. (A) Gene-normalized heatmap of the mean expression of every simulated gene within each simulated sample, condition, and cell-type within simulated cell-type specific RNA-seq data. Each row is a simulated gene, and each column is a simulated cell-type within a simulated sample. This matrix is directly imported into the ‘simulate_experiment_countmat’ function in the polyester R package to generate cell-type specific RNA-seq fasta files. The bar on the left of the heatmap designates the gene expression profile of our simulated genes. The bars on the bottom of the heatmap designate the simulated cell-type, condition, and replicate of each simulated sample. The legend on the right assigns each condition, cell-type, and replicate (B) Gene-normalized heatmap of the simulated bulk RNA-seq samples based on (A). This matrix is directly imported into the ‘simulate_experiment_countmat’ function in the polyester R package to generate bulk RNA-seq fasta files. The simulated expression of each gene is the mean gene expression of each cell-type weighted by the cell-type proportion that we designate in each iteration of our simulation. Therefore, each row is a simulated bulk gene that matches the row in (A). The bar on the left of the heatmap designates the bulk gene expression profile of our simulated genes. The bars on the bottom designate condition and replicate (corresponding with (A)). The legend on the right assigns each condition, cell-type, and replicate. (C) Schematic of evaluating scMappR with simulated data. We measure cell-type specific DEGs and bulk DEGs across conditions. We also measure cell-type specificity by calculating the DEGs between one cell-type and all of the other cell-types. These cell-type specific DEGs become our signature matrix. We then apply scMappR to the simulated bulk RNA-seq, DEGs, and signature matrix before evaluating our predicted cell-type specificity against the simulated cell-type specific DEGs. (D) Barplot of the proportion of true/false positives and negatives at different degrees of cell-type specificity. Cell-type proportions for all five cell-types are fixed at 20%. True positive is red, True negative is blue, false positive is light orange, false negative is light blue. (E) Average improvement that cell-weighted fold-changes (cwFold-changes) have on cell-type specificity as cell-type specificity increases is measured with a bar chart. Dark bars are the correlation cwFold-changes with cell-type specific fold-changes. Light = bars are the correlation between cell-types (left) and a boxplot of the correlations across cell-types (right). (F) Barplot of the proportion of true/false positives and negatives in cell-types with different cell-type proportions. Cell-type specificity is set to a fold-change of 32 between cell-type markers. (G) Average improvement that cell-weighted fold-changes (cwFold-changes) have on cell-type specificity for every cell-type is measured with a bar chart.
Figure 3.
Figure 3.
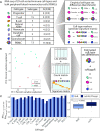
Benchmarking scMappR workflow and results. (A) Overview of samples and cell-types from Monaco et al., 2019. Sex differences within each cell-type are computed and the cell-type specific fold-changes in the genes that are differentially expressed in the peripheral blood mononuclear cells (PBMC) dataset are used. Each column of the signature matrix is the fold-change of expression from each cell-type against all the other cell-types and each row is a cell-type marker. (B) Overview of how scMappR was used to estimate cell-type specific sex differences from PBMCs. Principal component analysis shows linear separation of male and female PBMC samples. Differentially expressed genes derived from computing sex differences, the normalized count matrix, and signature matrix generated in (A) were imported into scMappR. (C) Improvement that cell-weighted fold-changes (cwFold-changes) have on cell-type specificity for every cell-type measured with a bar chart. Dark bars are the correlation cwFold-changes with cell-type specific fold-changes. Light = bars are the correlation between cell-types (left) and a boxplot of the correlations across cell-types (right). Improvement in correlation is measured with a one-tailed paired Student’s t-test; Bulk/PBMC, Peripheral Blood Mononuclear Cells; Neutrophils, Neutrophils; Progenitor, Progenitor; Basophils, Basophils; pDC, Plasmacytoid dendritic cells; Plasmablast, Plasmablast; mDC, myeloid dendritic cells; B_naïve, naïve B cells; NC_mono, nonclassical monocytes; C_mono, classical monocytes; MAIT, MAIT cells; B_SM, Switched memory B cells; VD2-, non-Vd2 gd T-cells.
Figure 4.
Figure 4.
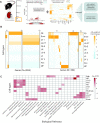
Application of scMappR to identify which cell-types are responsible for differentially expressed genes in kidney regeneration. (A) Valle Duraes et al., 2020 completed RNA-seq of C57BL/6J mice kidneys at naïve (day 0) and multiple timepoints of kidney regeneration post-injury. Between naïve and regeneration day 3 comparisons (shown here), we identified 2855 significantly differentially expressed genes. We then used scMappR to compute cwFold-changes. The normalized count data, the list of differentially expressed genes, and a signature matrix were inputs for this analysis. We used normalized count data from all samples, differentially expressed genes from naïve versus kidney regeneration (naïve (day 0) versus day 3 comparison shown here), and the signature matrix from scRNA-seq in the kidney completed by Tabula Muris, 2018. (B) Heatmap of gene normalized cwFold-changes of all 2855 differentially expressed genes (left) and the 394 differentially expressed genes that are also identified as cell-type markers in Tabula Muris, 2018 (right). The heatmaps on the left and right were produced in the same way except that in the heatmap on the right the genes are filtered for cell-type markers in Tabula Muris, 2018. (C) A cell-type normalized matrix of the top four most enriched pathways from cell-type specific pathway analysis. For each cell-type, genes were re-ranked by their increase in cell-type specificity before pathway analysis was completed. Bulk, bulk kidney; MP, Macrophage, Dendritic; JG-S, Juxtaglomerular, Stem; Peri, Pericyte; FB, Fibroblast; DT2, Distal Tubule 2; U1, Unknown 1; FB-Endo, Fibroblast-Endothelial; DT1, Distal Tubule 1; JG-PT, Juxtaglomerular, Proximal tubule; U2, Unknown 2; Endo, Endothelial.
Figure 5.
Figure 5.
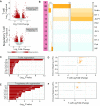
Comparison of bulk DEGs involved in kidney regeneration mapping to immune cells by scMappR with DEGs involved in kidney regeneration identified from FACS sorted T-cells and T-regulatory cells. (A) Volcano plots of DEGs between a naïve and regenerating kidney in FACS sorted T-cells and T-regulatory cells. (B) Overview of cwFold-changes in 2855 DEGs. Rows are cell-types and columns are DEGs. Numbers on the left side of the heatmap are the number of DEGs significantly mapping to each cell-type. (C) Enrichment of DEGs identified in T-cells on DEGs mapping to each cell-type. (D) Scatterplot of the cwFold-changes mapping to the ‘Macrophage, Dendritic’ cell-type (y-axis) and DEGs from FACS-sorted T-cells. (E) Enrichment of DEGs identified in T-regulatory cells on DEGs mapping to each cell-type. (F) Scatterplot of the cwFold-changes mapping to the ‘Macrophage, Dendritic’ cell-type (y-axis) and DEGs from FACS-sorted T-regulatory cells. Bulk, bulk kidney; MP, Macrophage, Dendritic; JG-S, Juxtaglomerular, Stem; Peri, Pericyte; FB, Fibroblast; DT2, Distal Tubule 2; U1, Unknown 1; FB-Endo, Fibroblast-Endothelial; DT1, Distal Tubule 1; JG-PT, Juxtaglomerular, Proximal tubule; U2, Unknown 2; Endo, Endothelial.

References

    1. Stark R., Grzelak M., Hadfield J. RNA sequencing: the teenage years. Nat. Rev. Genet. 2019; 20:631–656. - PubMed
    1. Love M.I., Huber W., Anders S. Moderated estimation of fold change and dispersion for RNA-seq data with DESeq2. Genome Biol. 2014; 15:550. - PMC - PubMed
    1. Robinson M.D., McCarthy D.J., Smyth G.K. edgeR: a Bioconductor package for differential expression analysis of digital gene expression data. Bioinformatics. 2010; 26:139–140. - PMC - PubMed
    1. Shen-Orr S.S., Tibshirani R., Khatri P., Bodian D.L., Staedtler F., Perry N.M., Hastie T., Sarwal M.M., Davis M.M., Butte A.J. Cell type-specific gene expression differences in complex tissues. Nat. Methods. 2010; 7:287–289. - PMC - PubMed
    1. Soneson C., Robinson M.D. Bias, robustness and scalability in single-cell differential expression analysis. Nat. Methods. 2018; 15:255–261. - PubMed

LinkOut - more resources