[Preprint]. 2021 Feb 25:2021.02.25.430130.
doi: 10.1101/2021.02.25.430130.

A single-cell and spatial atlas of autopsy tissues reveals pathology and cellular targets of SARS-CoV-2

Toni M Delorey  1 Carly G K Ziegler  2   3   4   5   6   7 Graham Heimberg  1 Rachelly Normand  2   8   9   10   11 Yiming Yang  1   8 Asa Segerstolpe  1 Domenic Abbondanza  1 Stephen J Fleming  12   13 Ayshwarya Subramanian  1 Daniel T Montoro  2 Karthik A Jagadeesh  1 Kushal K Dey  14 Pritha Sen  2   8   15   16 Michal Slyper  1 Yered H Pita-Juárez  2   10   17   18   19 Devan Phillips  1 Zohar Bloom-Ackerman  20 Nick Barkas  12 Andrea Ganna  21   22 James Gomez  20 Erica Normandin  2   10 Pourya Naderi  10   17   18 Yury V Popov  10   23   24 Siddharth S Raju  2   25   26 Sebastian Niezen  10   23   24 Linus T-Y Tsai  2   10   23   27   28 Katherine J Siddle  2   29 Malika Sud  1 Victoria M Tran  20 Shamsudheen K Vellarikkal  2   30 Liat Amir-Zilberstein  1 Deepak S Atri  2   30 Joseph Beechem  31 Olga R Brook  32 Jonathan Chen  2   33 Prajan Divakar  31 Phylicia Dorceus  1 Jesse M Engreitz  2   34 Adam Essene  23   27   28 Donna M Fitzgerald  35 Robin Fropf  31 Steven Gazal  36 Joshua Gould  12 John Grzyb  37 Tyler Harvey  1 Jonathan Hecht  10   17 Tyler Hether  31 Judit Jane-Valbuena  1 Michael Leney-Greene  2 Hui Ma  1   8 Cristin McCabe  1 Daniel E McLoughlin  35 Eric M Miller  31 Christoph Muus  2   38 Mari Niemi  21 Robert Padera  37   39   40 Liuliu Pan  31 Deepti Pant  23   27   28 Carmel Pe'er  1 Jenna Pfiffner-Borges  2 Christopher J Pinto  16   35 Jacob Plaisted  37 Jason Reeves  31 Marty Ross  31 Melissa Rudy  2 Erroll H Rueckert  31 Michelle Siciliano  37 Alexander Sturm  20 Ellen Todres  1 Avinash Waghray  41   42 Sarah Warren  31 Shuting Zhang  20 Daniel R Zollinger  31 Lisa Cosimi  43 Rajat M Gupta  2   30 Nir Hacohen  2   9   44 Winston Hide  10   17   18   19 Alkes L Price  14 Jayaraj Rajagopal  35 Purushothama Rao Tata  45 Stefan Riedel  10   17 Gyongyi Szabo  2   10   23 Timothy L Tickle  1   12 Deborah Hung  20   46   47 Pardis C Sabeti  2   29   48   49   50 Richard Novak  51 Robert Rogers  23   52 Donald E Ingber  38   51   53 Z Gordon Jiang  10   23   24 Dejan Juric  16   35 Mehrtash Babadi  12   13 Samouil L Farhi  1 James R Stone  33 Ioannis S Vlachos  2   10   17   18   19 Isaac H Solomon  37 Orr Ashenberg  1 Caroline B M Porter  1 Bo Li  1   8   16 Alex K Shalek  2   3   4   5   6   7   10   41   54   55   56 Alexandra-Chloé Villani  2   8   9   16 Orit Rozenblatt-Rosen  1   57 Aviv Regev  1   5   49   57
Affiliations

A single-cell and spatial atlas of autopsy tissues reveals pathology and cellular targets of SARS-CoV-2

Toni M Delorey et al. bioRxiv. .

Abstract

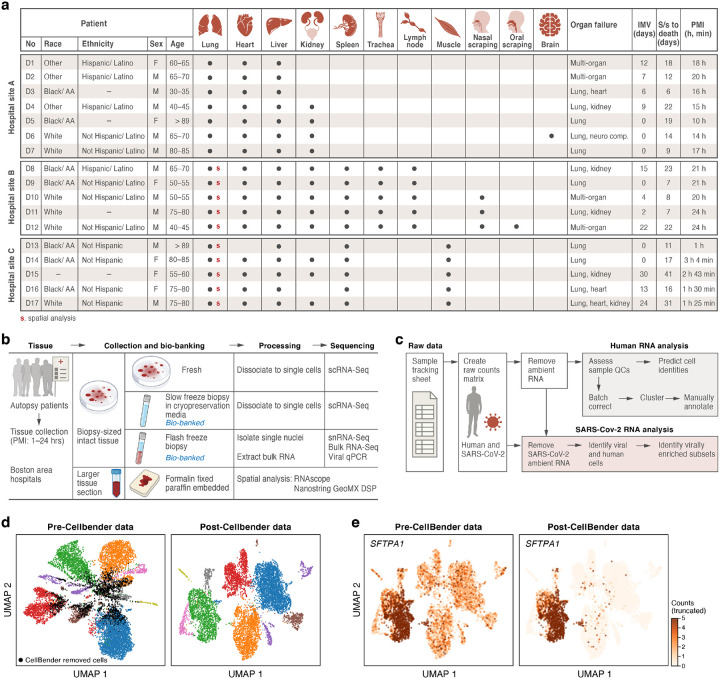
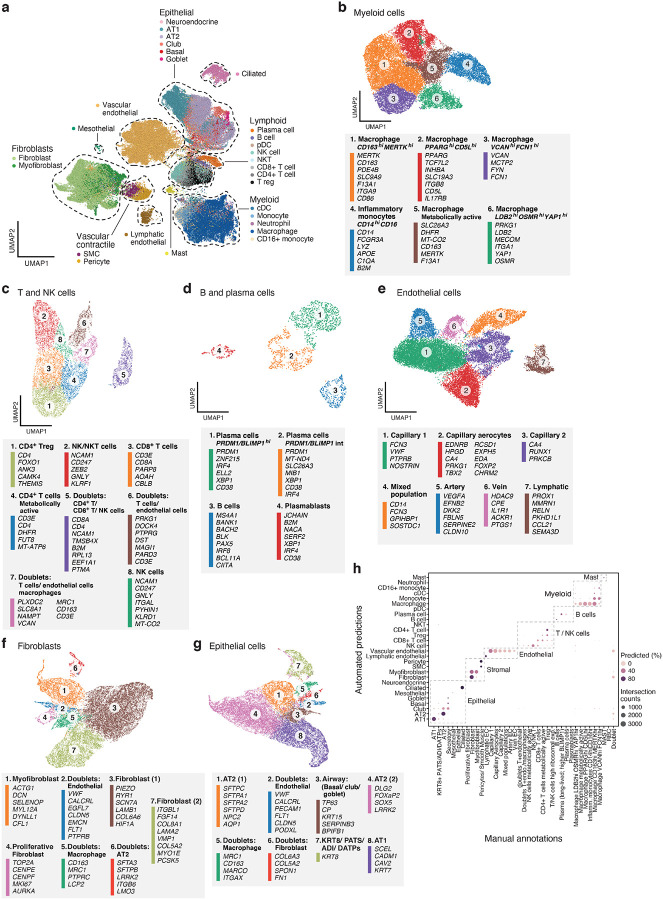
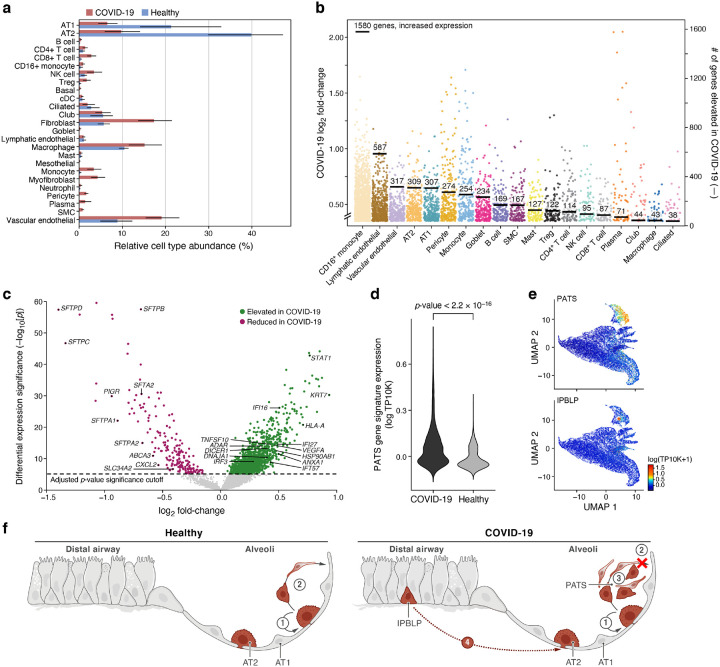
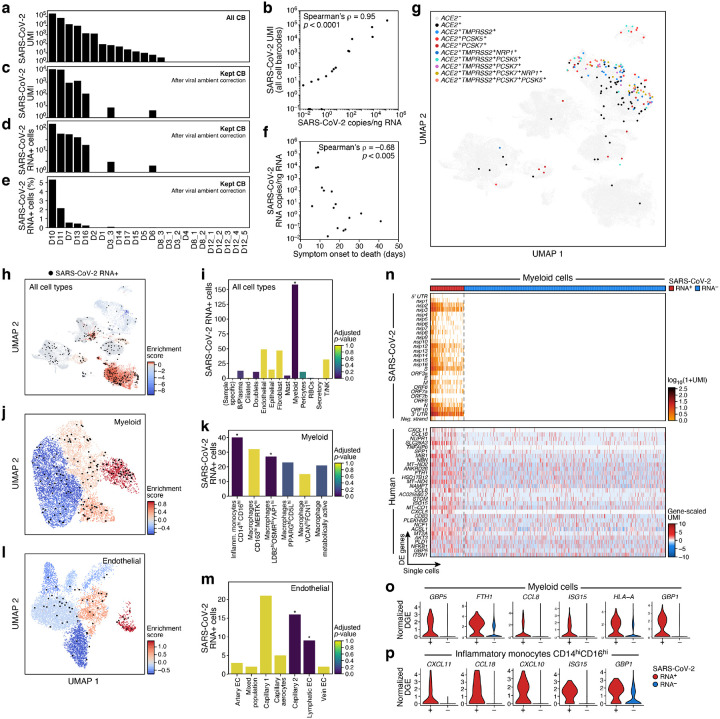
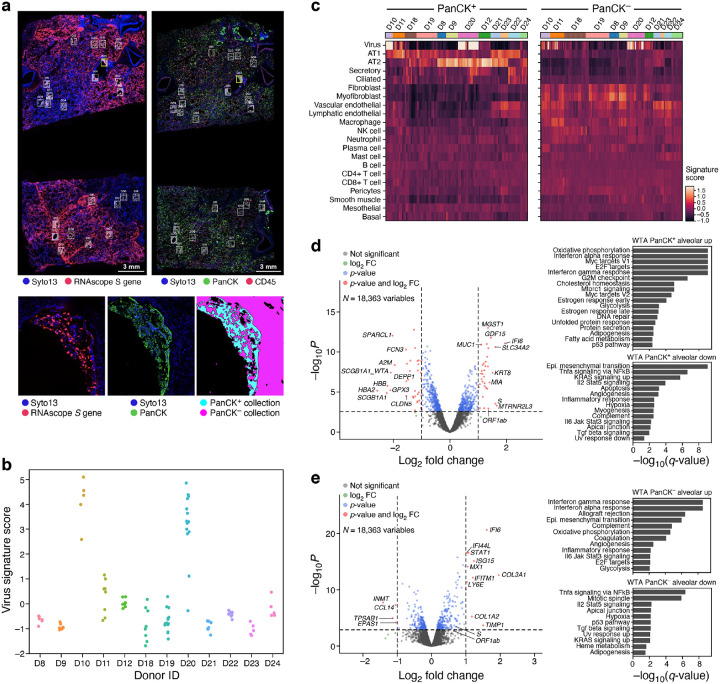
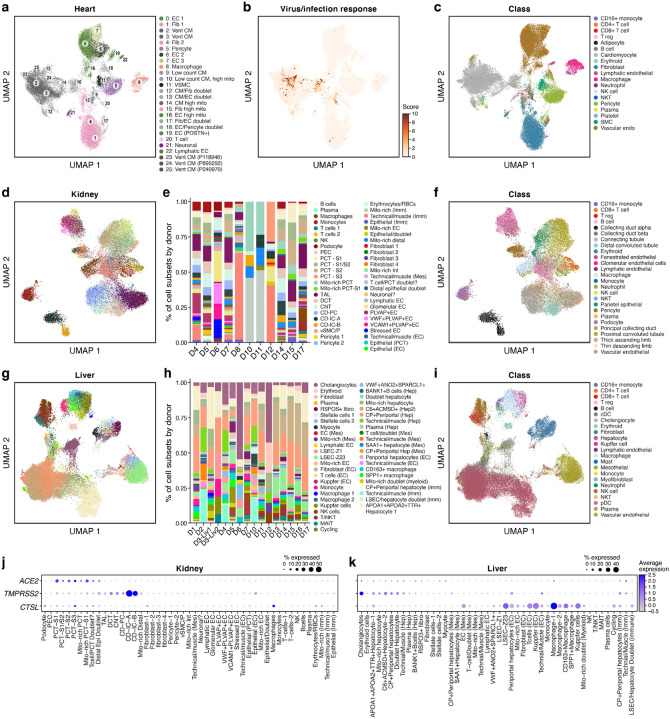
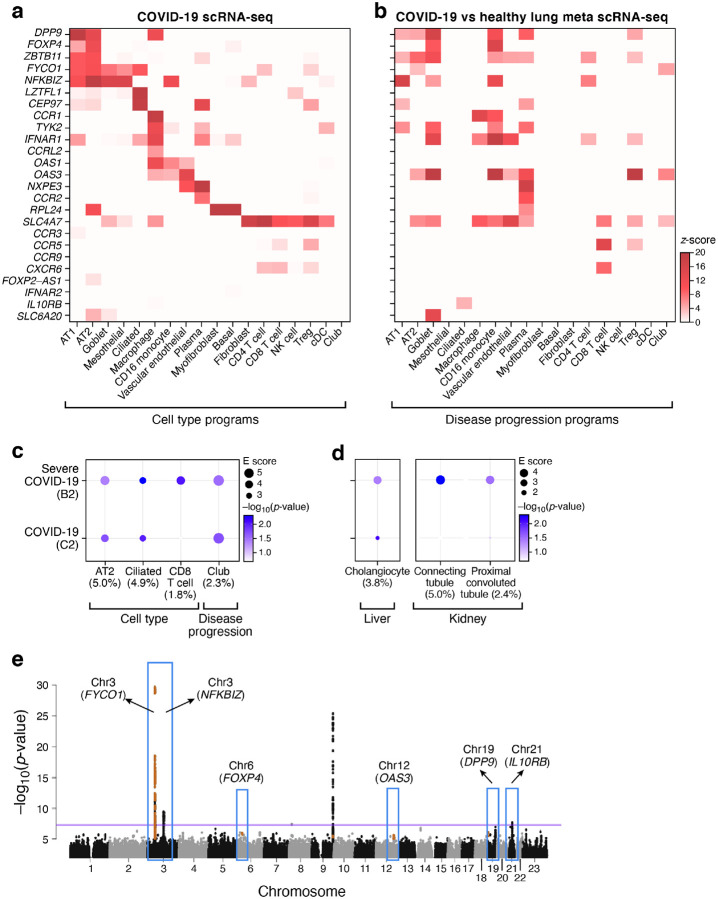
The SARS-CoV-2 pandemic has caused over 1 million deaths globally, mostly due to acute lung injury and acute respiratory distress syndrome, or direct complications resulting in multiple-organ failures. Little is known about the host tissue immune and cellular responses associated with COVID-19 infection, symptoms, and lethality. To address this, we collected tissues from 11 organs during the clinical autopsy of 17 individuals who succumbed to COVID-19, resulting in a tissue bank of approximately 420 specimens. We generated comprehensive cellular maps capturing COVID-19 biology related to patients' demise through single-cell and single-nucleus RNA-Seq of lung, kidney, liver and heart tissues, and further contextualized our findings through spatial RNA profiling of distinct lung regions. We developed a computational framework that incorporates removal of ambient RNA and automated cell type annotation to facilitate comparison with other healthy and diseased tissue atlases. In the lung, we uncovered significantly altered transcriptional programs within the epithelial, immune, and stromal compartments and cell intrinsic changes in multiple cell types relative to lung tissue from healthy controls. We observed evidence of: alveolar type 2 (AT2) differentiation replacing depleted alveolar type 1 (AT1) lung epithelial cells, as previously seen in fibrosis; a concomitant increase in myofibroblasts reflective of defective tissue repair; and, putative TP63+ intrapulmonary basal-like progenitor (IPBLP) cells, similar to cells identified in H1N1 influenza, that may serve as an emergency cellular reserve for severely damaged alveoli. Together, these findings suggest the activation and failure of multiple avenues for regeneration of the epithelium in these terminal lungs. SARS-CoV-2 RNA reads were enriched in lung mononuclear phagocytic cells and endothelial cells, and these cells expressed distinct host response transcriptional programs. We corroborated the compositional and transcriptional changes in lung tissue through spatial analysis of RNA profiles in situ and distinguished unique tissue host responses between regions with and without viral RNA, and in COVID-19 donor tissues relative to healthy lung. Finally, we analyzed genetic regions implicated in COVID-19 GWAS with transcriptomic data to implicate specific cell types and genes associated with disease severity. Overall, our COVID-19 cell atlas is a foundational dataset to better understand the biological impact of SARS-CoV-2 infection across the human body and empowers the identification of new therapeutic interventions and prevention strategies.


Conflict of interest statement

Competing Interests P.D., R.F., E.M.M., M.R., E.H.R., L.P., T.He., J.R., J.B., and S.W. are employees and stockholders at Nanostring Technologies Inc. D.Z., is a former employee and stockholder at NanoString Technologies. N.H., holds equity in BioNTech and Related Sciences. T.H.is an employee and stockholder of Prime Medicine as of Oct. 13, 2020. G.H. is an employee of Genentech as of Nov 16, 2020. R.N. is a founder, shareholder, and member of the board at Rhinostics Inc. A.R. is a co-founder and equity holder of Celsius Therapeutics, an equity holder in Immunitas, and was an SAB member of ThermoFisher Scientific, Syros Pharmaceuticals, Neogene Therapeutics and Asimov until July 31, 2020. From August 1, 2020, A.R. is an employee of Genentech. From October 19, 2020, O.R.-R is an employee of Genentech. P.C.S is a co-founder and shareholder of Sherlock Biosciences, and a Board member and shareholder of Danaher Corporation. A.K.S. reports compensation for consulting and/or SAB membership from Honeycomb Biotechnologies, Cellarity, Repertoire Immune Medicines, Ochre Bio, and Dahlia Biosciences. Z.G.J. reports grant support from Gilead Science, Pfizer, compensation for consulting from Olix Pharmaceuticals. Y.V.P. reports grant support from Enanta Pharmaceuticals, CymaBay Therapeutics, Morphic Therapeutic; consulting and/or SAB in Ambys Medicines, Morphic Therapeutics, Enveda Therapeutics, BridgeBio Pharma, as well as being an Editor – American Journal of Physiology-Gastrointestinal and Liver Physiology. GS reports consultant service in Alnylam Pharmaceuticals, Merck, Generon, Glympse Bio, Inc., Mayday Foundation, Novartis Pharmaceuticals, Quest Diagnostics, Surrozen, Terra Firma, Zomagen Bioscience, Pandion Therapeutics, Inc. Durect Corporation; royalty from UpToDate Inc., and Editor service in Hepatology Communications. P.R.T. receives consulting fees from Cellarity Inc., and Surrozen Inc., for work not related to this manuscript.

Figures

Figure 1.
Figure 1.. A COVID-19 autopsy cohort for a single cell and spatial atlas
a. Cohort overview. IMV: intermittent mandatory ventilation days, S/s: time from symptom onset to death in days; PMI: post-mortem interval. Red bold s: donors for which we collected spatial profiles in the lung. b. Sample processing pipeline overview. c. sc/snRNA-Seq analysis pipeline overview. d,e. CellBender ‘remove-background’ improves cell clustering and expression specificity by removing ambient RNA and empty (non-cell) droplets. UMAP plot of sc/snRNA-Seq profiles (dots) either before (left) or after (right) CellBender processing, colored by clusters and by doublet status (black) (d), or by expression of the surfactant protein SFTPA1 (e). Color scale in e is linear and truncated at 5 counts to visualize small counts.
Figure 2.
Figure 2.. A single cell and single nucleus atlas of COVID-19 lung
a. Automatic prediction identifies cells from 28 subsets across epithelial, immune and stromal compartments. UMAP embedding of 106,792 harmonized scRNA-Seq and snRNA-Seq profiles (dots) from all 16 COVID-19 lung donors, colored by their automatically predicted cell type (legend). b-g. Refined annotation of cell subsets within lineages. UMAP embeddings of each selected cell lineages with cells colored by manually annotated sub-clusters. Color legends highlight highly expressed marker genes for select subsets. b. myeloid cells (24,417 cells/ nuclei), c. T and NK cells (9,950), d. B and plasma cells (1,693), e. endothelial cells (20,366), f. fibroblast (20,925), g. epithelial cells (21,700). h. High consistency between automatic and manual annotations. The proportion (color intensity) and number (dot size) of cells with a given predicted annotation (rows) in each manual annotation category (columns).
Figure 3.
Figure 3.. Dramatic remodeling of cell composition and cell intrinsic programs in COVID-19 lung
a. Differences in cell composition between COVID-19 and healthy lung. Proportion (x axis, mean and 95% confidence intervals) of cells in each subset (y axis, by automatic annotation) in COVID-19 snRNA-Seq (red) and a healthy snRNA-Seq dataset (blue). b,c. Myeloid, endothelial and pneumocyte cells show substantial changes in cell intrinsic expression profiles in the COVID-19 lung. b. Log2(fold change) (y axis) between COVID-19 and healthy lung for each gene (dot) in each cell subset (x axis, by automatic annotation). Black bars: number of genes with significantly increased expression (adjusted p-value < 7.5*10−6). c. Significance (−Log10(P-value), y axis) magnitude (log2(fold-change), x axis) of differential expression of each gene (dots) in 2000 AT2 cells, from a meta-differential expression analysis between COVID-19 and healthy samples across 14 studies. d. An increased PATS program in pneumocytes in COVID-19 lung. Distribution of PATS signature scores (y axis) for the 17,655 cells from COVID-19 or 24,000 cells from healthy lung (x axis). e. UMAP embeddings of epithelial cells colored by their expression of cell program signatures (color legend, lower right) for the PATS program (upper panel) and the IPBLP program (lower panel). f. Graphical schematic of alveolar cellular turnover. In healthy alveoli (left panel), AT2 cells self-renew (1) and differentiate into AT1 (2). In COVID-19 alveoli (right panel), AT2 cell self-renewal (1) and AT1 differentiation (2) are inhibited, resulting in PATS accumulation (3) and recruitment of airway-derived IPBLP progenitors to alveoli (4).
Figure 4.
Figure 4.. SARS-CoV-2 RNA+ single cells span multiple lineages and are enriched among phagocytic and endothelial cells
a-e. Robust identification of SARS-CoV-2 RNA+ single cells. a. Number of SARS-CoV-2 UMIs from all cell barcodes (y axis). c. Number of SARS-CoV-2 UMIs after ambient correction. d. and e. Number (d, y axis; Range: 1–169, total: 342, mean +/− SEM: 49 +/− 22) and percent (e, y axis, Range: 0.02–5.3%, mean +/ SEM 1.25% +/− 0.73%) of SARS-CoV-2+ RNA cells (both after ambient correction), across the samples (x axis), ordered by ranking in a. b. Agreement of overall viral RNA abundance from sc/snRNA-Seq and qPCR on bulk RNA. SARS-CoV-2 copies as measured by CDC N1 qPCR assay on bulk RNA extracted from matched tissue samples (x axis) and from number of all SARS-CoV-2 aligning UMI (pre-ambient correction, y axis). f. Reduction in SARS-CoV-2 RNA with more prolonged S/s interval. Interval between symptom onset and death (x axis, days) and lung SARS-CoV-2 copies/ng input RNA (y axis) for each donor. g. SARS-CoV-2 RNA+ single cells are not closely related to expression of the SARS-CoV-2 entry factors. UMAP embedding (as in Fig. 2a) of all cells/nuclei profiled in the lung, colored by single and multi-gene expression of the SARS-CoV-2 entry factor ACE2 with different accessory proteins. Co-expression combinations with at least 10 cells are shown. h-m. SARS-CoV-2 RNA+ cells are enriched in specific lineages and sub-types. Left panels, h, j, l: Cells from 7 donors containing any SARS-CoV-2 RNA+ cell, and colored by viral enrichment score (color bar; red: stronger enrichment) and by SARS-CoV-2 RNA+ cells (black points). UMAP embeddings of either all cell types (h, as in Supplemental Fig. 4a), myeloid cells (j, as in Fig. 2b), or endothelial cells (l, as in Fig. 2e). Right panels, i, k, m: Number of SARS-CoV-2 RNA+ cells (y axis) per cell type/subset (x axis), with bars colored by enrichment score (color bar. dark blue: stronger enrichment). * FDR < 0.01. n-p. Expression changes in SARS-CoV-2 RNA+ myeloid cells. n. Expression of SARS CoV-2 genomic features (top, log-normalized UMI counts; rows) and significantly DE host genes (bottom, log-normalized and scaled digital gene expression, rows; FDR-corrected p-value < 0.05 and log2 fold change > 0.5) across SARS-CoV-2 RNA+ and SARS-CoV-2 RNA− myeloid cells (columns). o,p. Distribution of normalized digital expression levels (y axis) for select significantly DE genes between SARS-CoV-2 RNA− and SARS-CoV-2 RNA+ cells from myeloid cells (o) or from Inflammatory monocytes CD14highCD16high cells (p).
Figure 5.
Figure 5.. Spatial atlas of autopsy lung samples highlight composition and expression differences between infected and uninfected regions and with healthy lungs.
a. Selection of ROIs and AOIs. Top: overview scans of donor D20 showing S gene RNAscope (left) and immunofluorescent staining (right). ROIs for CTA collection (right) are associated with RNAscope images (left) (white rectangles). Bottom: Zoom in of one ROI (yellow rectangle) from each scan (left and middle), and the defined segmentation masks for collection (right). b. Differences in viral load within regions and between donors. Viral signature score (y axis) for each WTA AOI (dots) in each donor (x axis). c. Deconvolution highlights differences in cell composition between PanCK+ and PanCK alveolar AOIs and between AOIs from SARS-CoV-2 (D22–24) and SARS-CoV-2 positive (all others) lung samples. Expression scores (color bar) of cell type signatures (rows) in PanCK+ (left) and PanCK (right) alveolar AOIs (columns) in WTA data from different donors (top color bar). d,e. Changes in gene expression in SARS-CoV-2 positive vs. negative lung. Left: Significance (−Log10(P-value), y axis) and magnitude (log2(fold-change), x axis) of differential expression of each gene (points) in WTA data between SARS-CoV-2 positive and negative AOIs for PanCK+ (d) and PanCK (e) alveoli. PanCK+ alveoli ROIs: 78 SARS-CoV-2 positive vs. 18 negative; PanCK alveoli ROIs: 112 positive vs. 20 negative. The horizontal dashed line indicates an FDR q-value cutoff of 0.05, and the two vertical dashed lines represent a fold-change of 2 in log2 scale. The names of top 10 SARS-CoV-2 positive and negative significant genes regarding fold-change are marked, respectively. Right: Significance (−log10(q-value)) of enrichment (permutation test) of different pathways (rows).
Figure 6.
Figure 6.. A single nucleus atlas of heart, kidney, and liver COVID-19 tissues
a-c. COVID-19 heart cell atlas. UMAP embedding of 36,662 heart nuclei (dots) from 15 samples, colored by clustering with manual post hoc annotations (a), signature scores of genes upregulated in SARS-CoV-2 infected iPSC cardiomyocytes (b), labeling mostly cardiomyocytes from patient D17 (see also Supplemental Fig. 10b–g), or by automatically derived cell type labels (c). d-f. COVID-19 kidney cell atlas. d,f. UMAP embedding of 29,568 kidney nuclei (dots) from 11 samples, colored by clustering with manual post hoc annotations (d) or by automatically derived cell type labels (f). e. Proportion of cells (y axis) in each subset (color legend, as in d) in each donor (x axis). g-i. COVID-19 liver cell atlas. g,i. UMAP embedding of 47,001 liver nuclei (dots) from 16 samples, colored by clustering with manual post hoc annotations (g) or by automatically derived cell type labels (i). h. Proportion of cells (y axis) in each subset (color legend, as in g) in each donor (x axis). j,k. SARS-CoV-2 entry factors are expressed in kidney and liver cells. Average expression (dot color) and fraction of expressing cells (color, size) of SARS-CoV-2 entry factors (rows) across cell subsets (columns) in the kidney (j) and liver (k).
Figure 7.
Figure 7.. Integration of COVID-19 GWAS with COVID-19 lung, liver, and kidney single cell profiles helps nominate genes and cell types in severe disease
a,b. Relation of genes from GWAS-associated regions to cell type specific expression. Mean expression (a, z-score relative to all other cell types, color bar) or differential expression (b, z-score of DE analysis of expression in COVID-19 vs. healthy cells of the same type) of 25 genes (rows) from 6 genomic loci associated with COVID-19 (based on summary statistics data from COVID-19 HGI meta analysis across lung cell types (columns). c. Cell types and gene programs in the lung that contribute to heritability of COVID-19 severity by incorporating genome wide signals from GWAS. Magnitude (circle size, E score) and significance (color, −log10(P-value)) of the enrichment of cell type programs and cell-types specific disease programs (columns) that were significantly enriched for COVID-19 or severe COVID-19 phenotypes (rows). d. Extending the analysis in (c) to cell types and gene programs in liver and kidney with significant heritability enrichment signal for COVID-19 severity. All results in (c) and (d) are conditional on 86 baseline-LDv2.1 model annotations. e. Nomination of single best candidate genes at unresolved GWAS significant loci by aggregating gene level information across program classes and cell types. Significance (−log10(P-value), y axis) of GWAS association signal at locus (x axis). Blue boxes: Significantly associated loci at a genome-wide significance level (purple horizontal bar). Nominated genes are labeled. Numerical results are reported in Supplemental Tables 14, 15 and 16.

Similar articles

  • COVID-19 tissue atlases reveal SARS-CoV-2 pathology and cellular targets.
    Delorey TM, Ziegler CGK, Heimberg G, Normand R, Yang Y, Segerstolpe Å, Abbondanza D, Fleming SJ, Subramanian A, Montoro DT, Jagadeesh KA, Dey KK, Sen P, Slyper M, Pita-Juárez YH, Phillips D, Biermann J, Bloom-Ackermann Z, Barkas N, Ganna A, Gomez J, Melms JC, Katsyv I, Normandin E, Naderi P, Popov YV, Raju SS, Niezen S, Tsai LT, Siddle KJ, Sud M, Tran VM, Vellarikkal SK, Wang Y, Amir-Zilberstein L, Atri DS, Beechem J, Brook OR, Chen J, Divakar P, Dorceus P, Engreitz JM, Essene A, Fitzgerald DM, Fropf R, Gazal S, Gould J, Grzyb J, Harvey T, Hecht J, Hether T, Jané-Valbuena J, Leney-Greene M, Ma H, McCabe C, McLoughlin DE, Miller EM, Muus C, Niemi M, Padera R, Pan L, Pant D, Pe'er C, Pfiffner-Borges J, Pinto CJ, Plaisted J, Reeves J, Ross M, Rudy M, Rueckert EH, Siciliano M, Sturm A, Todres E, Waghray A, Warren S, Zhang S, Zollinger DR, Cosimi L, Gupta RM, Hacohen N, Hibshoosh H, Hide W, Price AL, Rajagopal J, Tata PR, Riedel S, Szabo G, Tickle TL, Ellinor PT, Hung D, Sabeti PC, Novak R, Rogers R, Ingber DE, Jiang ZG, Juric D, Babadi M, Farhi SL, Izar B, Stone JR, Vlachos IS, Solomon IH, Ashenberg O, Porter CBM, Li B, Shalek AK, Villani AC, Rozenblatt-Rosen O, Regev A. Delorey TM, et al. Nature. 2021 Jul;595(7865):107-113. doi: 10.1038/s41586-021-03570-8. Epub 2021 Apr 29. Nature. 2021. PMID: 33915569 Free PMC article.
  • Molecular and immune signatures, and pathological trajectories of fatal COVID-19 lungs defined by in situ spatial single-cell transcriptome analysis.
    Das A, Meng W, Liu Z, Hasib MM, Galloway H, Ramos da Silva S, Chen L, Sica GL, Paniz-Mondolfi A, Bryce C, Grimes Z, Sordillo EM, Cordon-Cardo C, Rivera KP, Flores M, Chiu YC, Huang Y, Gao SJ. Das A, et al. J Med Virol. 2023 Aug;95(8):e29009. doi: 10.1002/jmv.29009. J Med Virol. 2023. PMID: 37563850 Free PMC article.
  • Subcellular Detection of SARS-CoV-2 RNA in Human Tissue Reveals Distinct Localization in Alveolar Type 2 Pneumocytes and Alveolar Macrophages.
    Acheampong KK, Schaff DL, Emert BL, Lake J, Reffsin S, Shea EK, Comar CE, Litzky LA, Khurram NA, Linn RL, Feldman M, Weiss SR, Montone KT, Cherry S, Shaffer SM. Acheampong KK, et al. mBio. 2021 Feb 22;13(1):e0375121. doi: 10.1128/mbio.03751-21. Epub 2022 Feb 8. mBio. 2021. PMID: 35130722 Free PMC article.
  • Insights into COVID-19 Vaccine Development Based on Immunogenic Structural Proteins of SARS-CoV-2, Host Immune Responses, and Herd Immunity.
    Chaudhary JK, Yadav R, Chaudhary PK, Maurya A, Kant N, Rugaie OA, Haokip HR, Yadav D, Roshan R, Prasad R, Chatrath A, Singh D, Jain N, Dhamija P. Chaudhary JK, et al. Cells. 2021 Oct 29;10(11):2949. doi: 10.3390/cells10112949. Cells. 2021. PMID: 34831172 Free PMC article. Review.
  • Function of epithelial stem cell in the repair of alveolar injury.
    Chan M, Liu Y. Chan M, et al. Stem Cell Res Ther. 2022 Apr 27;13(1):170. doi: 10.1186/s13287-022-02847-7. Stem Cell Res Ther. 2022. PMID: 35477551 Free PMC article. Review.

Cited by

References

    1. Xu Z. et al. Pathological findings of COVID-19 associated with acute respiratory distress syndrome. Lancet Respir Med 8, 420–422 (2020). - PMC - PubMed
    1. Huang C. et al. Clinical features of patients infected with 2019 novel coronavirus in Wuhan, China. Lancet 395, 497–506 (2020). - PMC - PubMed
    1. Wang Y. et al. SARS-CoV-2 infection of the liver directly contributes to hepatic impairment in patients with COVID-19. J. Hepatol. 73, 807–816 (2020). - PMC - PubMed
    1. Fan Z. et al. Clinical Features of COVID-19-Related Liver Functional Abnormality. Clin. Gastroenterol. Hepatol. 18, 1561–1566 (2020). - PMC - PubMed
    1. Guan W.-J. et al. Clinical Characteristics of Coronavirus Disease 2019 in China. N. Engl. J. Med. 382, 1708–1720 (2020). - PMC - PubMed

Publication types