. 2021 Jul;28(5):e12691.
doi: 10.1111/micc.12691. Epub 2021 Mar 11.

Integrated pancreatic microcirculatory profiles of streptozotocin-induced and insulin-administrated type 1 diabetes mellitus

Affiliations

Integrated pancreatic microcirculatory profiles of streptozotocin-induced and insulin-administrated type 1 diabetes mellitus

Yuan Li et al. Microcirculation. 2021 Jul.

Abstract

Objective: As an integrated system, pancreatic microcirculatory disturbance plays a vital role in the pathogenesis of type 1 diabetes mellitus (T1DM), which involves changes in microcirculatory oxygen and microhemodynamics. Therefore, we aimed to release type 1 diabetic and insulin-administrated microcirculatory profiles of the pancreas.

Methods: BALB/c mice were assigned to control, T1DM, and insulin-administrated groups randomly. T1DM was induced by intraperitoneal injection of streptozotocin (STZ). 1.5 IU insulin was administrated subcutaneously to keep the blood glucose within the normal range. After anesthetizing by isoflurane, the raw data set of pancreatic microcirculation was collected by the multimodal device- and computer algorithm-based microcirculatory evaluating system. After adjusting outliers and normalization, pancreatic microcirculatory oxygen and microhemodynamic data sets were imported into the three-dimensional module and compared.

Results: Microcirculatory profiles of the pancreas in T1DM exhibited a loss of microhemodynamic coherence (significantly decreased microvascular blood perfusion) accompanied by an impaired oxygen balance (significantly decreased PO2 , SO2 , and rHb). More importantly, with insulin administration, the pathological microcirculatory profiles were partially restored. Meanwhile, there were correlations between pancreatic microcirculatory blood perfusion and PO2 levels.

Conclusions: Our findings establish the first integrated three-dimensional pancreatic microcirculatory profiles of STZ-induced and insulin-administrated T1DM.

Keywords: insulin; microhemodynamics; oxygen; pancreatic microcirculation; type 1 diabetes mellitus.


Conflict of interest statement

The authors declare no conflict of interest.

Figures

FIGURE 1
FIGURE 1
Schematic diagram of the multimodal device–based pancreatic microcirculatory profile evaluating platform. The pancreatic microcirculatory oxygen profile (SO2, rHb, and PO2) and microhemodynamics were captured by probes of O2C, Microx TX3, and VMS. SO2, hemoglobin oxygen saturation; rHb, relative amount of hemoglobin; PO2, partial pressure of oxygen; O2C, Oxygen to See; VMS, dual‐channel laser Doppler vascular evaluating system.
FIGURE 2
FIGURE 2
Comparisons of fasting blood glucose and body weight of control, STZ‐induced type 1 diabetic, and insulin‐administrated mice. The type 1 diabetic mouse model was induced by STZ induction, which exhibited abnormal fasting blood glucose (A) and body weight (B). Data are presented as mean ±SD. Control, n = 6; T1DM, n = 6; insulin‐administrated, n = 6. * p < 0.05, ** p < 0.01, *** p < 0.001, **** p < 0.0001. 23434: Hematoxylin‐eosin (HE) staining of the pancreatic microcirculation in the control, T1DM, and insulin‐administrated groups. Representatives of pancreatic microvasculature (arrow) are illustrated. Scale bar =50 μm. D: Immunohistochemical staining of insulin in three groups. Scale bar =50 μm. E: Immunohistochemical staining of PECAM‐1 in three groups. Scale bar =50 μm. Arrows indicate microvessels. The inserts revealed enlarged microvessels in pancreatic microcirculation. Scale bar =20 μm. F: Ultrastructure of pancreatic microcirculation revealed by TEM. Magnification =2000×. Arrows indicate microvessels of pancreatic microcirculation. Scale bar =5 μm. Control, control mice; T1DM, STZ‐induced type 1 diabetic mice without insulin administration; insulin‐administrated, STZ‐induced diabetic mice with 1.5 IU insulin administration. T1DM, type 1 diabetes mellitus; STZ, streptozotocin; HE, hematoxylin‐eosin; TEM, transmission electron microscopy.
FIGURE 3
FIGURE 3
Three‐dimensional (3‐D) module of pancreatic microcirculatory profiles in control mice. A: Separated 3‐D module of microcirculatory oxygen profile (SO2, rHb, and PO2) and microhemodynamics (microvascular blood perfusion and velocity). B: Front view, side view (rotated 45° toward left), and overlook view (rotated 90° toward down) of the 3‐D module of improved pancreatic microcirculatory profiles. C: Separated scattered 3‐D module of microcirculatory oxygen profile and microhemodynamics. D: Front view, side view (rotated 45° toward left), and overlook view (rotated 90° toward down) of the scattered 3‐D module. T1DM, type 1 diabetes mellitus; SO2, oxygen saturation; rHb, relative amount of hemoglobin; PO2, partial oxygen pressure; 3‐D, three‐dimensional.
FIGURE 4
FIGURE 4
Abnormality of three‐dimensional (3‐D) module of pancreatic microcirculatory profiles in the T1DM group. A: Separated 3‐D module of microcirculatory oxygen profile (SO2, rHb, and PO2) and microhemodynamics (microvascular blood perfusion and velocity). B: Front view, side view (rotated 45° toward left), and overlook view (rotated 90° toward down) of the 3‐D module of improved pancreatic microcirculatory profiles. C: Separated scattered 3‐D module of microcirculatory oxygen profile and microhemodynamics. D: Front view, side view (rotated 45° toward left), and overlook view (rotated 90° toward down) of the scattered 3‐D module. T1DM, type 1 diabetes mellitus; SO2, oxygen saturation; rHb, relative amount of hemoglobin; PO2, partial oxygen pressure; 3‐D, three‐dimensional.
FIGURE 5
FIGURE 5
Improvement in three‐dimensional (3‐D) module of pancreatic microcirculatory profiles in insulin‐administrated mice. A: Separated 3‐D module of microcirculatory oxygen profile (SO2, rHb, and PO2) and microhemodynamics (microvascular blood perfusion and velocity). B: Front view, side view (rotated 45° toward left), and overlook view (rotated 90° toward down) of the 3‐D module of improved pancreatic microcirculatory profiles. C: Separated scattered 3‐D module of microcirculatory oxygen profile and microhemodynamics. D: Front view, side view (rotated 45° toward left), and overlook view (rotated 90° toward down) of the scattered 3‐D module. T1DM, type 1 diabetes mellitus; SO2, oxygen saturation; rHb, relative amount of hemoglobin; PO2, partial oxygen pressure; 3‐D, three‐dimensional.
FIGURE 6
FIGURE 6
Integrated analysis of microcirculatory oxygen profile of pancreatic microcirculation. (A‐C) Separate coordinates of pancreatic microcirculatory oxygen profile. (D‐F) Comparisons of SO2, rHb, and PO2 levels in control and T1DM mice with or without insulin administration. Control, control mice; T1DM, STZ‐induced type 1 diabetic mice without insulin administration; insulin‐administrated, STZ‐induced diabetic mice with 1.5 IU insulin administration. Control, n = 6; T1DM, n = 6; insulin‐administrated, n = 6. **** p < 0.0001. T1DM, type 1 diabetes mellitus; STZ, streptozotocin; SO2, oxygen saturation; rHb, relative amount of hemoglobin; PO2, partial oxygen pressure; AU, arbitrary unit; 3‐D, three‐dimensional.
FIGURE 7
FIGURE 7
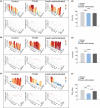
Integration of microcirculatory hemodynamics of pancreatic microcirculation. (A, B) Separate coordinates of pancreatic microhemodynamics. (C, D) Comparisons of pancreatic microvascular blood perfusion and velocity in control and T1DM mice with or without insulin administration. Control, control mice; T1DM, STZ‐induced type 1 diabetic mice without insulin administration; insulin‐administrated, STZ‐induced diabetic mice with 1.5 IU administration. Control, n = 6; T1DM, n = 6; insulin‐administrated, n = 6. **** p < 0.0001. T1DM, type 1 diabetes mellitus; STZ, streptozotocin; PU, perfusion unit; 3‐D, three‐dimensional.
FIGURE 8
FIGURE 8
Correlation analysis among pancreatic microcirculatory oxygen and microhemodynamic profiles. A: Correlation coefficients in control, T1DM, and insulin‐administrated groups. Numbers in the figure represent correlation coefficient r value. B‐D: Correlations between pancreatic microcirculatory oxygen profile and microvascular blood perfusion in the control, T1DM, and insulin‐administrated groups. B: No correlations between microcirculatory SO2 and microvascular blood perfusion were found among the groups. C: Pancreatic microcirculatory rHb was not associated with pancreatic microvascular blood perfusion. D: Positive correlation between microcirculatory PO2 and microvascular blood perfusion was found in both control (r = 0.686, p < 0.0001) and insulin‐administrated (r = 0.680, p < 0.0001) groups. Negative correlation between microcirculatory PO2 and microvascular blood perfusion was found in T1DM mice (r = −0.628, p = 0.0002). Blue circle represents control mice. Red triangle represents the T1DM group without insulin administration. Green rectangle represents T1DM administrated with insulin. Control, control mice; T1DM, STZ‐induced type 1 diabetic mice without insulin administration; insulin‐administrated, STZ‐induced diabetic mice with 1.5 IU administration. Control, n = 6; T1DM, n = 6; insulin‐administrated, n = 6. * p < 0.05, *** p < 0.001, **** p < 0.0001. T1DM, type 1 diabetes mellitus; STZ, streptozotocin; SO2, oxygen saturation; rHb, relative amount of hemoglobin; PO2, partial oxygen pressure; AU, arbitrary unit; PU, perfusion unit.

Similar articles

Cited by

References

    1. Inanc M, Tekin K, Kiziltoprak H, et al. Changes in retinal microcirculation precede the clinical onset of diabetic retinopathy in children with type 1 diabetes mellitus. Am J Ophthalmol. 2019;207:37‐44. - PubMed
    1. Jansson L, Barbu A, Bodin B, et al. Pancreatic islet blood flow and its measurement. Ups J Med Sci. 2016;121:81‐95. - PMC - PubMed
    1. Gutterman DD, Chabowski DS, Kadlec AO, et al. The human microcirculation: regulation of flow and beyond. Circ Res. 2016;118:157‐172. - PMC - PubMed
    1. Dybala MP, Gebien LR, Reyna ME, et al. Implications of integrated pancreatic microcirculation: crosstalk between endocrine and exocrine compartments. Diabetes. 2020;69:2566‐2574. - PMC - PubMed
    1. Dybala MP, Kuznetsov A, Motobu M, et al. Integrated pancreatic blood flow: bidirectional microcirculation between endocrine and exocrine pancreas. Diabetes. 2020;69:1439‐1450. - PMC - PubMed

Publication types