

Stable kinetochore-microtubule attachments restrict MTOC position and spindle elongation in oocytes
- PMID: 33655692
- PMCID: PMC8024892
- DOI: 10.15252/embr.202051400
Stable kinetochore-microtubule attachments restrict MTOC position and spindle elongation in oocytes
Abstract
In mouse oocytes, acentriolar MTOCs functionally replace centrosomes and act as microtubule nucleation sites. Microtubules nucleated from MTOCs initially assemble into an unorganized ball-like structure, which then transforms into a bipolar spindle carrying MTOCs at its poles, a process called spindle bipolarization. In mouse oocytes, spindle bipolarization is promoted by kinetochores but the mechanism by which kinetochore-microtubule attachments contribute to spindle bipolarity remains unclear. This study demonstrates that the stability of kinetochore-microtubule attachment is essential for confining MTOC positions at the spindle poles and for limiting spindle elongation. MTOC sorting is gradual and continues even in the metaphase spindle. When stable kinetochore-microtubule attachments are disrupted, the spindle is unable to restrict MTOCs at its poles and fails to terminate its elongation. Stable kinetochore fibers are directly connected to MTOCs and to the spindle poles. These findings suggest a role for stable kinetochore-microtubule attachments in fine-tuning acentrosomal spindle bipolarity.
Keywords: MTOC; kinetochore; microtubule; oocyte; spindle.
© 2021 The Authors. Published under the terms of the CC BY NC ND 4.0 license.
Conflict of interest statement
The authors declare that they have no conflict of interest.
Figures
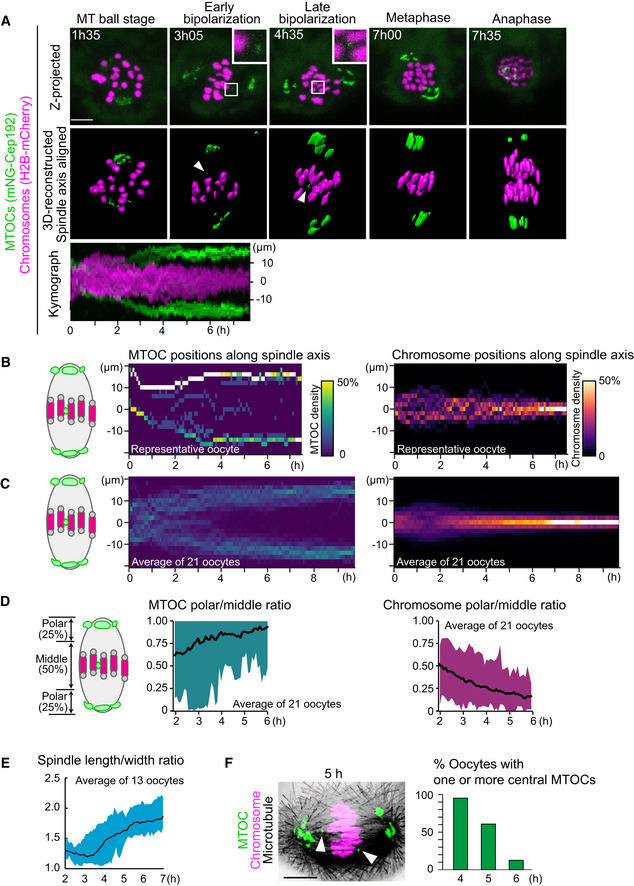
Live imaging of MTOC dynamics during meiosis I. Z‐projection images (top) show MTOCs (mNG‐Cep192, green) and chromosomes (H2B‐mCherry, magenta). Central MTOCs are magnified (squares). 3D‐reconstructed spindles are aligned with the spindle axis (middle). Central MTOCs are indicated with arrowheads. Time in h:mm. The kymograph (bottom) shows projected signals on the spindle axis for all time points.
Density maps of MTOCs (left) and chromosomes (right) along the spindle axis in a representative oocyte. The color represents the percentage of MTOCs or chromosome volumes, respectively, coded from dark (0%) to white (50% or more of the total volume).
Average density maps of 21 oocytes mapped as in (B). Data from six independent experiments are used.
Dynamics of MTOC sorting and chromosome congression. Ratio of MTOCs (left) or chromosomes (right) in the polar region versus those in the middle region of the spindle are plotted over time.
Dynamics of spindle elongation. The spindle was visualized with EGFP‐Map4 (Fig EV1). The length/width ratio of the spindle was measured after 3D reconstruction (n = 13 oocytes from three independent experiments).
Percentage of oocytes carrying one or more MTOCs in the middle region of the spindle. Oocytes were fixed and stained for MTOCs (pericentrin, green), chromosomes (Hoechst33342, magenta), and microtubules (α‐tubulin, gray). n = 21, 28, 24 oocytes. A representative oocyte fixed at 5 h after NEBD is shown. Arrowheads indicate central MTOCs.
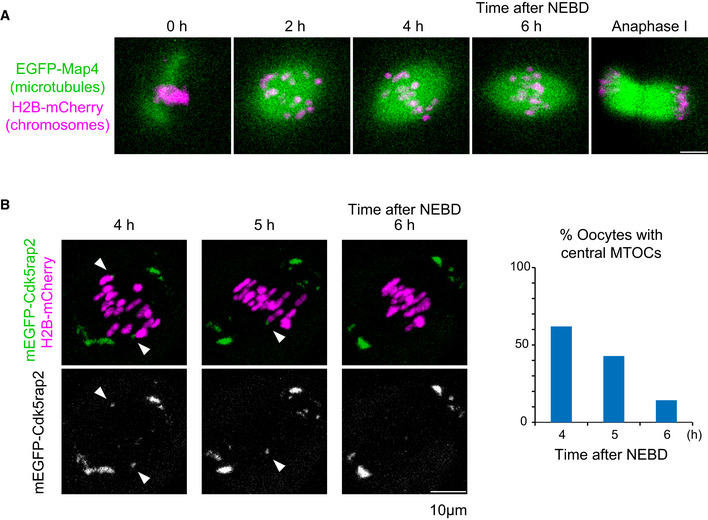
Live imaging of oocytes expressing EGFP‐Map4 (microtubules, green) and H2B‐mCherry (chromosomes, magenta).
Live imaging of oocytes expressing mEGFP‐Cdk5rap2 (microtubules, green) and H2B‐mCherry (chromosomes, magenta). Arrowheads indicate central MTOCs. The frequency of oocytes carrying central MTOCs is shown (n = 21 oocytes).
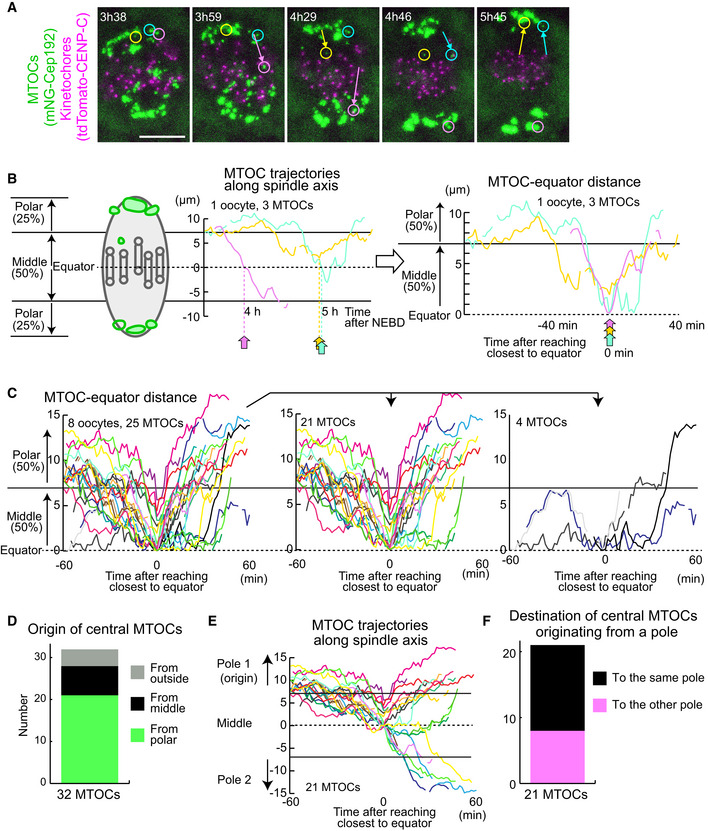
Live imaging of MTOC and kinetochore dynamics. MTOCs (mNG‐Cep192, green) and kinetochores (tdTomato‐CENP‐C, magenta) in B6D2F1 oocytes are shown. Time in h:mm after NEBD. Circles indicate central MTOCs, which are positioned in the middle region of the spindle later than 4 h after NEBD. Arrows indicate displacement of the MTOCs. Scale bar, 10 μm.
Tracking analysis of central MTOCs. In the left graph, the positions of central MTOCs in (A) along the spindle axis are shown over time. MTOC positions were used to calculate distance to the spindle equator. In the right graph, lines showing temporal changes in MTOC‐equator distance are aligned based on the time when the MTOC reached a position closest to the spindle equator. Horizontal lines at 7 and at −7 μm denote the thresholds used for the definition of the middle and polar regions of the spindle.
Central MTOCs originate from spindle poles and transiently stay in the middle region of the spindle. As in (B), the trajectories of central MTOCs (n = 25 MTOCs of 8 oocytes from three independent experiments) were analyzed and their temporal changes in MTOC–equator distance are shown (Left graph). Central MTOCs were categorized into two groups: (1) ones that came from polar regions of the spindle (n = 21, middle graph) and (2) others that stayed in the middle region throughout the period before reaching a position closest to the equator (n = 4, right graph).
Origin of central MTOCs. Origins were categorized based on the results shown in (C). Note that 7 central MTOCs came from outside of the spindle and are not included in (C).
Destination of central MTOCs. The tracks of central MTOCs that originated from polar regions were used (n = 21 MTOCs). The pole of origin was defined as Pole 1, while the other pole was defined as Pole 2. MTOC positions along the spindle axis (positive values for those closer to Pole 1) over time are shown. Horizontal lines at 7 and at −7 μm denote the thresholds used for the definition of the middle and polar regions of the spindle. Note that central MTOCs moved back to the original pole (Pole 1) or switched their positions to the opposite pole (Pole 2).
Destination of central MTOCs that originated from a polar region was categorized as in (E).
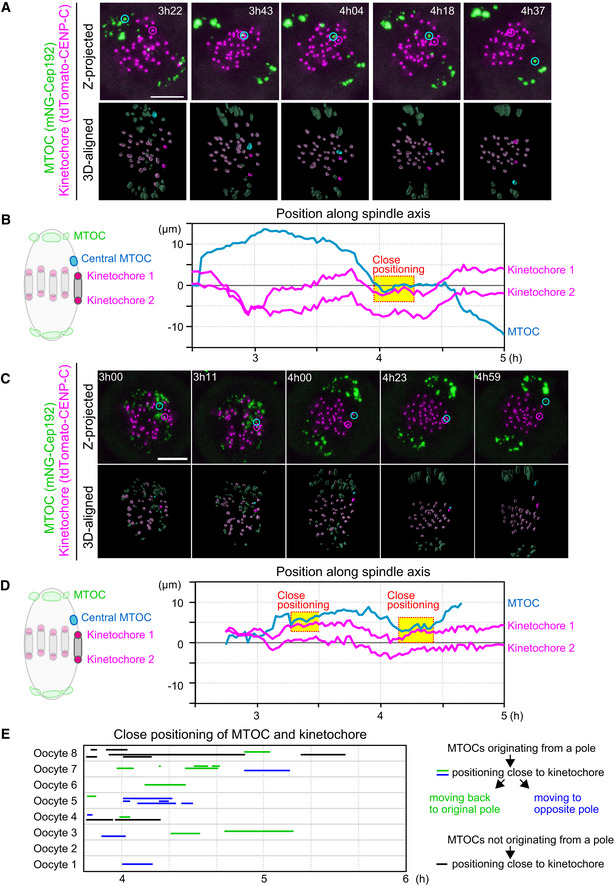
Live imaging of MTOC and kinetochore dynamics. Z‐projected and 3D‐reconstructed images for MTOCs (mNG‐Cep192, green) and kinetochores (tdTomato‐CENP‐C, magenta) are shown. The 3D‐reconstructed images are aligned based on the spindle axis, with highlights on an MTOC and a pair of kinetochores. Time in h:mm after NEBD. Scale bar, 10 μm. Cyan circles follow an MTOC in the middle of the spindle. Magenta circles follow a kinetochore that transiently positions close to the MTOC.
Tracking of MTOCs and kinetochores. The positions of MTOCs (cyan) and kinetochores (magenta), which are highlighted in (A), along the spindle axis are shown over time. Time after NEBD. Dotted boxes represent periods when the kinetochore‐MTOC distance was < 2 μm.
Another example of the image dataset acquired from the experiment shown in (A). Images are presented as in (A).
The dataset shown in (C) was analyzed and presented as in (B).
Close positioning of MTOCs and kinetochores is frequently observed. Lines indicate periods when oocytes exhibited close positioning of MTOCs and kinetochores (< 2 μm). We categorized kinetochore‐proximal MTOCs into three groups: (1) MTOCs that originated from a pole, positioned close to a kinetochore, and then moved back to the original spindle pole (green), (2) MTOCs that originated from a pole, positioned close to a kinetochore, and then moved to the opposite spindle pole (blue) and, (3) MTOCs that did not originate from spindle poles and are positioned close to the kinetochore (black).
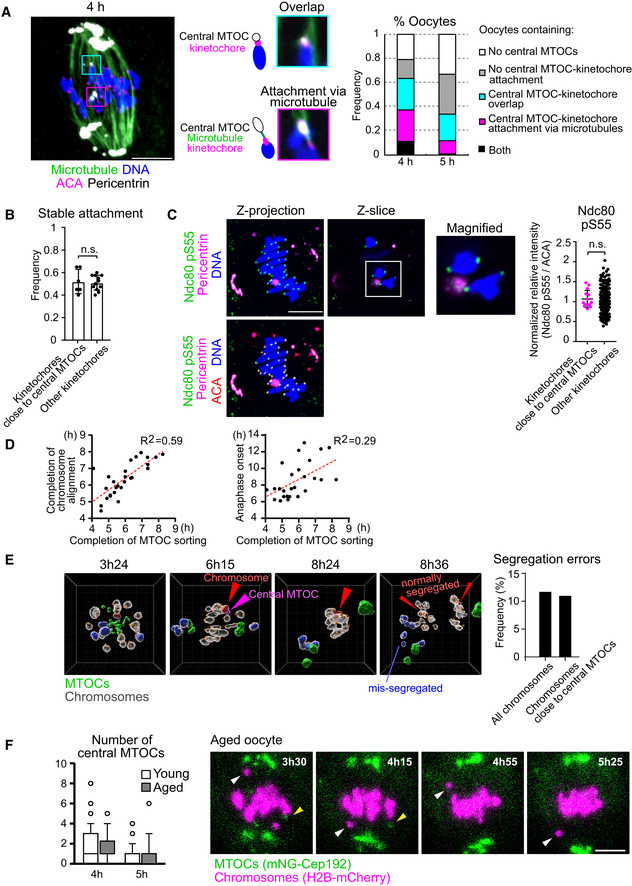
Central MTOCs can attach to kinetochores. Oocytes at 4 h and 5 h after NEBD were treated with a cold buffer for 5 min before fixation. Cold‐stable microtubules were visualized by immunostaining oocytes for microtubules (α‐tubulin, green), kinetochores (ACA, magenta), pericentrin (gray) and chromosomes (Hoechst33342, blue). Z‐projection images and magnified z‐slices are shown. The frequency of oocytes containing central MTOC–kinetochore attachment and/or overlap is shown (n = 19, 18 oocytes from three independent experiments). Scale bar, 10 μm.
Close positioning of central MTOCs does not affect stable kinetochore–microtubule attachment. Kinetochores were categorized into two groups: (1) ones that were positioned close to central MTOCs (< 1 μm) and (2) others. The frequency of stable end‐on microtubule attachment on each category is shown (n = 12, 6 oocytes from three independent experiments). Mean ± SD are shown. n.s., not significant by two‐tailed Student’s t‐test.
Close positioning of central MTOCs does not affect phosphorylated Ser55 of Ndc80. Kinetochores were categorized into two groups: (1) ones that positioned close to central MTOCs (< 1 μm) and (2) others. Relative intensities of phospho‐Ser55 to ACA signals were calculated (n = 266, 14 kinetochores of 7 oocytes from three independent experiments). Mean ± SD are shown. n.s., not significant by two‐tailed Student’s t‐test. Scale bar, 10 μm.
Temporal correlation of MTOC sorting with chromosome alignment and anaphase onset. Oocytes expressing mNG‐Cep192 and H2B‐SNAP labeled with SNAP‐Cell 647‐SiR or H2B‐mCherry were monitored by live imaging (n = 27 from seven independent experiments). The timings of the removal of all central MTOCs, chromosome alignment, and anaphase onset were determined. Correlation coefficients are shown. Time after NEBD (h).
Close positioning of central MTOCs and chromosomes does not predict chromosome segregation errors. Oocytes expressing H2B‐SNAP labeled with SNAP‐Cell 647‐SiR (chromosomes), tdTomato‐CENP‐C (kinetochores), and mNG‐Cep192 (MTOCs) were cultured in the presence of 60 nM nocodazole and monitored by live imaging. Images were reconstructed in 3D. MTOCs are shown in green. A central MTOC that transiently positioned close to a chromosome is shown in magenta. This chromosome (shown in red) underwent normal segregation at anaphase. Chromosomes that underwent segregation errors are shown in blue. Other chromosomes are shown in gray. Kinetochore positions are marked with orange spheres. The frequency of segregation errors are shown. All chromosomes (n = 760 chromosomes of 38 oocytes) and chromosomes that positioned close to central MTOCs (n = 9 from 8 oocytes). The unit of the grid is 5 μm. Time after NEBD (h:mm). See also Movie EV5.
Central MTOCs do not predict chromosome segregation errors in aged oocytes. Oocytes were collected from young (2‐month‐old) and naturally aged mice (17–22 months old). Oocytes expressing mNG‐Cep192 and H2B‐mCherry were monitored by live imaging. The number of central MTOCs was determined at 4 and 5 h after NEBD (n = 40, 22 from three independent experiments). Boxes and whiskers show 25–75 and 10–90 percentiles, respectively. Images for a representative aged oocyte exhibiting prematurely separated chromosomes (white arrowhead) are shown. Yellow arrowheads indicate central MTOCs. Time after NEBD (h:mm). Scale bar, 10 μm.
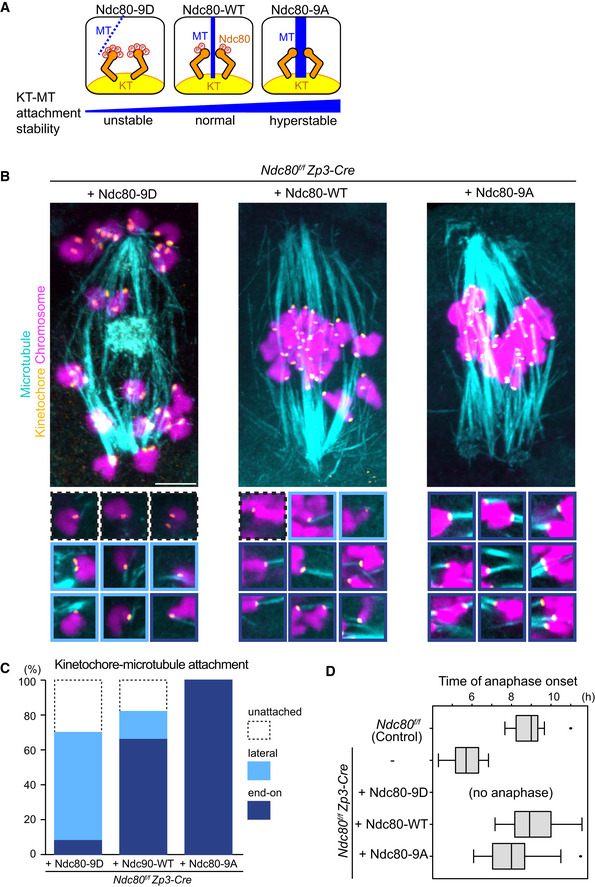
Schematic representation of kinetochore–microtubule attachment. Phosphorylation levels of the Ndc80 complex at the kinetochore are a determinant of the stability of kinetochore (KT)‐microtubule (MT) attachments. High phosphorylation levels allow unstable attachments such as lateral attachments. Low phosphorylation levels promote stable attachments such as end‐on attachments. Phospho‐mimetic and phospho‐deficient forms of Ndc80 (S4, S5, T8, S15, S44, T49, S55, S62, and S68 were substituted to aspartic acid “Ndc80‐9D” or alanine “Ndc80‐9A”, respectively) can be used as tools to manipulate the stability of kinetochore–microtubule attachments.
Ndc80 phospho‐mutants modify kinetochore–microtubule attachment stability. Ndc80f/f Zp3‐Cre oocytes were collected and microinjected with RNAs of wild‐type (Ndc80‐WT), phospho‐mimetic (Ndc80‐9D) or phospho‐deficient (Ndc80‐9A) forms of Ndc80. Cold‐stable microtubules were visualized by immunostaining oocytes 7 hours after NEBD for microtubules (α‐tubulin, cyan), kinetochores (ACA, orange), and chromosomes (Hoechst33342, magenta). Z‐projection images are shown. Magnified images of kinetochores are categorized: end‐on attachments (dark blue box), lateral attachments (light blue box), and unattached (dot‐lined box). Scale bar, 10 μm.
Percentages of kinetochore–microtubule attachments in (B). All kinetochores were analyzed (n = 200 kinetochores of 5 oocytes from two independent experiments).
Anaphase entry timing. Ndc80f/f (Ndc80‐intact) oocytes are used as a control. Ndc80f/f Zp3‐Cre (Ndc80‐deleted) oocytes expressing Ndc80‐WT, Ndc80‐9D, or Ndc80‐9A were monitored with the chromosome marker H2B‐mCherry (n = 15, 25, 25, 42, and 55 oocytes, respectively, from at least 3 independent experiments). Time after NEBD. Note that Ndc80f/f Zp3‐Cre oocytes expressing no Ndc80 construct exhibited an accelerated anaphase onset that is consistent with defects in the spindle checkpoint. Ndc80‐9D‐expressing oocytes did not undergo anaphase, consistent with spindle checkpoint activation by unstable kinetochore–microtubule attachments. Ndc80‐9A‐expressing oocytes tended to exhibit an earlier anaphase onset, in agreement with accelerated checkpoint satisfaction by stable kinetochore–microtubule attachments. Boxes show 25–75 percentiles and whiskers encompass data points within 1.5 times the interquartile range.
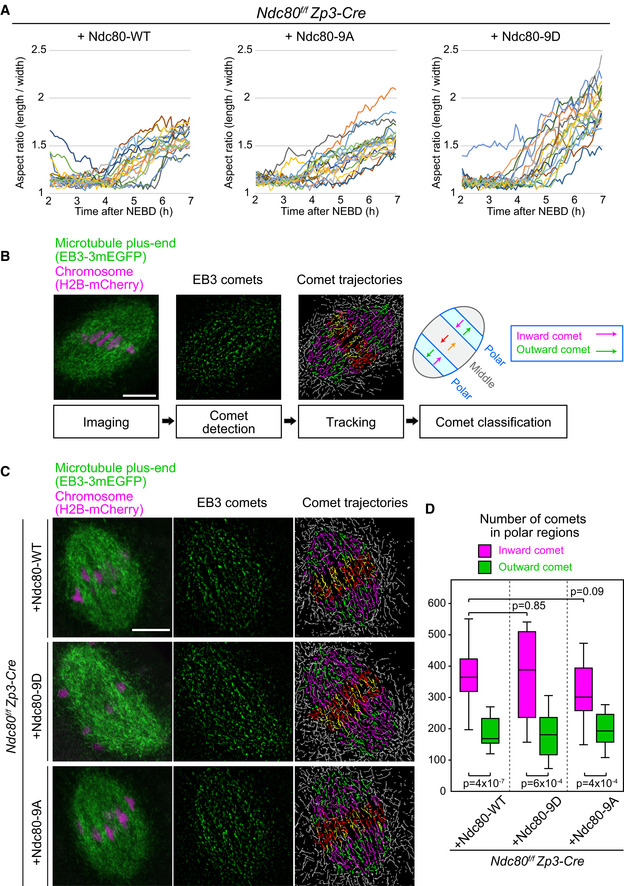
Ndc80‐9D‐expressing oocytes do not exhibit increased collapse in spindle shape. Microtubules (EGFP‐Map4) and chromosomes (H2B‐mCherry) were visualized in Zp3‐Cre Ndc80f/f oocytes injected with Ndc80‐WT, Ndc80‐9D, or Ndc80‐9A. The aspect ratio (length/width) of 3D‐reconstructed spindles was measured over time (n = 18, 18, and 18 oocytes, respectively, from three independent experiments; identical to the dataset shown in Fig 4).
Experimental pipeline for the quantification of microtubule organization. Oocytes were imaged with the microtubule plus‐end marker EB3‐3mEGFP (green) and the chromosome marker H2B‐mCherry (magenta) at 5 h after NEBD. The comets of EB3‐labeled microtubule plus‐ends were detected following image processing for peak enhancement and background subtraction. The comets were tracked to visualize their movements. The spindle was divided into 21 equal regions between the two spindle poles along the spindle axis, and divisions 4–6 and 16–18 were defined as polar regions. In the polar regions, comets moving toward the inside of the spindle were categorized as inward comets (magenta lines), and the others as outward comets (green lines). Inward comets were predominant in the polar regions of the spindle, which represents bipolar microtubule organization.
EB3 dynamics are largely unaffected by kinetochore–microtubule stability. Zp3‐Cre Ndc80f/f oocytes expressing Ndc80‐WT, Ndc80‐9D, or Ndc80‐9A were analyzed as in (B).
EB3 dynamics are not significantly affected. Total number of comets going inwards and outwards in the polar regions of the spindle (n = 14, 13, 16 oocytes from at least two independent experiments) is shown. Welch’s t‐test was performed. Boxes show 25–75 percentiles, and whiskers encompass data points within 1.5 times the interquartile range.
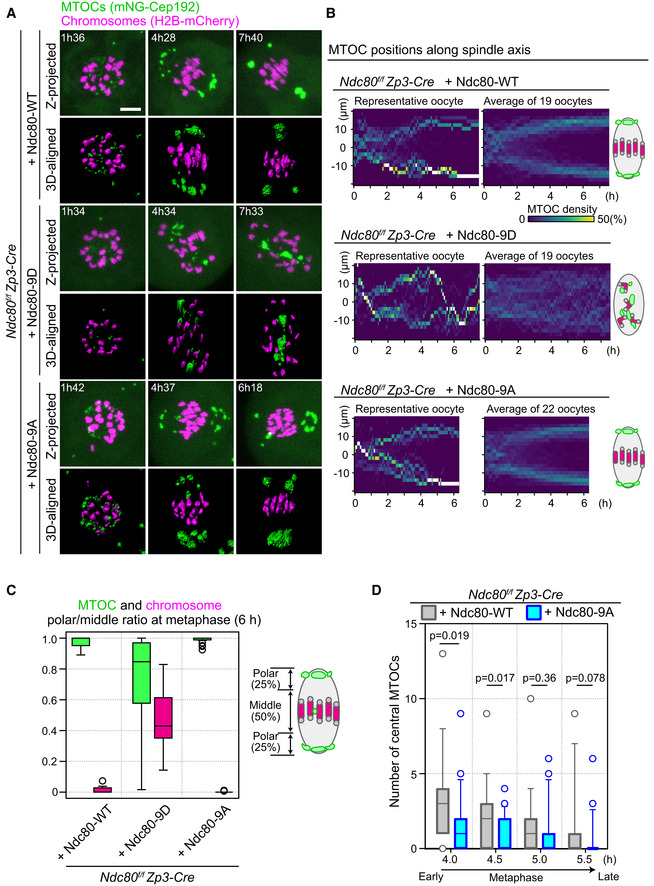
Live imaging of Zp3‐Cre Ndc80f/f oocytes injected with Ndc80‐WT, Ndc80‐9D, or Ndc80‐9A. Z‐projection and 3D‐reconstructed images show MTOCs (mNeonGreen‐Cep192, green) and chromosomes (H2B‐mCherry, magenta). Time in h:mm after NEBD. Scale bar, 10 μm.
Ndc80‐9D is defective for MTOC sorting. The density map of MTOCs along the spindle axis in Zp3‐Cre Ndc80f/f oocytes expressing Ndc80‐WT, Ndc80‐9D, or Ndc80‐9A. The color represents the percentage of MTOC volume coded from dark (0%) to white (50% or more of the total volume).
MTOCs do not accumulate at the spindle poles in Ndc80‐9D‐expressing oocytes. Ratio of MTOCs (green) or chromosomes (magenta) in the polar region versus those in the middle region of the spindle at 6 hours after NEBD (n = 19, 19, and 22 oocytes, respectively, from at least three independent experiments). Boxes show 25–75 percentiles, and whiskers encompass data points within 1.5 times the interquartile range.
Ndc80‐9A decreases central MTOCs. The number of central MTOCs (MTOCs that were positioned in the middle region of the spindle as shown in (C)) was determined at each time point (n = 19, 21 oocytes, respectively, from at least 3 independent experiments). Two‐tailed Student’s t‐test was performed. Boxes and whiskers show 25–75 and 10–90 percentiles, respectively.
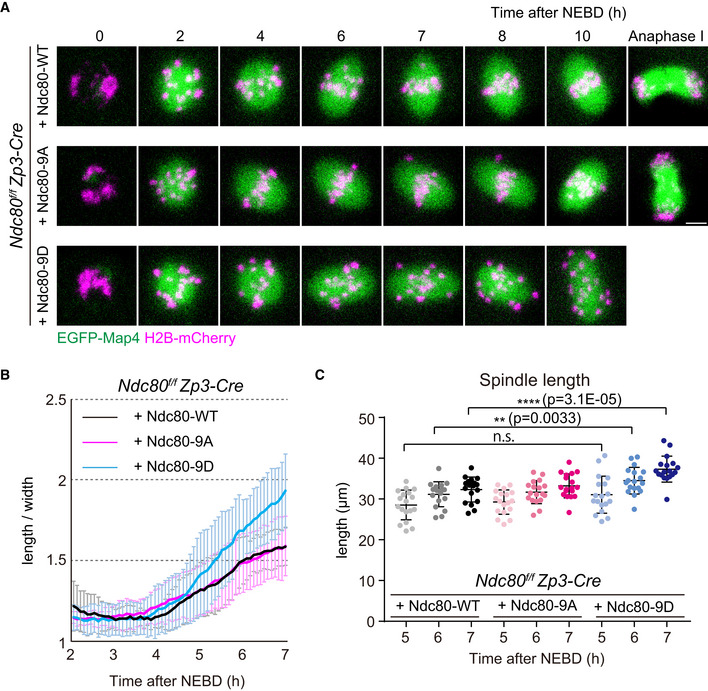
Live imaging of Zp3‐Cre Ndc80f/f oocytes injected with Ndc80‐WT, Ndc80‐9D or Ndc80‐9A. Z‐projection and 3D‐reconstructed images show microtubules (EGFP‐Map4, green) and chromosomes (H2B‐mCherry, magenta). Scale bar, 10 μm.
Ndc80‐9D is defective for limiting spindle elongation. The aspect ratio (length/width) of 3D‐reconstructed spindles was measured over time (n = 18, 18, and 18 oocytes, respectively, from three independent experiments).
Ndc80‐9D causes excessive spindle elongation. Spindle lengths measured after 3D reconstruction are shown (n = 18, 18, and 18 oocytes, respectively, from three independent experiments). Two‐tailed Student’s t‐test was performed. **P < 0.01, ****P < 0.0001.
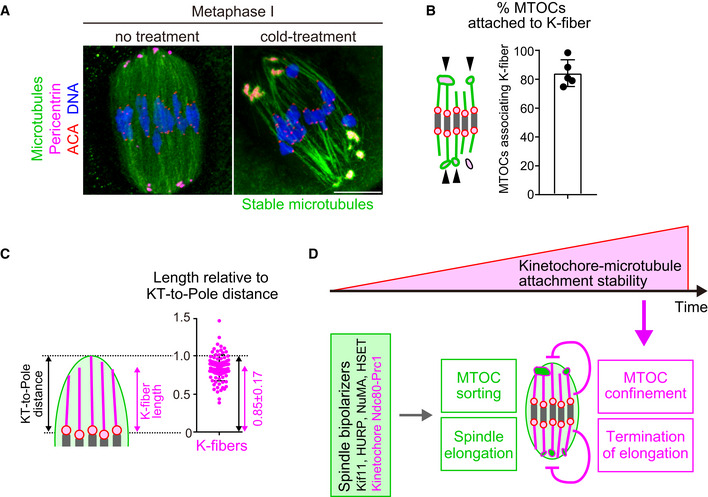
K‐fibers are connected to MTOCs and extend to spindle poles. Oocytes 6 hours after NEBD were fixed following cold treatment. Microtubules (α‐tubulin, green), MTOCs (pericentrin, magenta), kinetochores (ACA, red), and DNA (Hoechst333342) are shown. Five oocytes from two independent experiments were analyzed. Scale bar, 10 μm.
A majority of MTOCs are attached to K‐fibers. The volumes of individual MTOCs were measured after 3D reconstruction. The sum volume of MTOCs attached to K‐fibers relative to the total volume of MTOCs was calculated for each oocyte (n = 5 oocytes from two independent experiments). Means and SD are shown.
K‐fibers extend to spindle poles. The length of K‐fibers and distance between kinetochores and a spindle pole (KT‐to‐Pole distance) were measured. K‐fiber length relative to the KT‐to‐Pole distance was calculated (n = 90 K‐fibers of 5 oocytes from two independent experiments).
Model summarizing the results of this study. In early phases of acentrosomal spindle assembly, spindle bipolarizers, including Kif11, HURP, NuMA, HSET, and the kinetochore Ndc80 complex that recruits Prc1, establish spindle bipolarity by promoting MTOC sorting and spindle elongation. Meanwhile, the stability of kinetochore–microtubule attachments gradually increases, depending on the dephosphorylation of kinetochore components including Ndc80. As spindle bipolarity is established, stable kinetochore–microtubule attachments spatially confine MTOCs at spindle poles and limit spindle elongation.
Similar articles
-
MPS1 promotes timely spindle bipolarization to prevent kinetochore-microtubule attachment errors in oocytes.EMBO J. 2025 Jul;44(13):3794-3823. doi: 10.1038/s44318-025-00461-w. Epub 2025 Jun 4. EMBO J. 2025. PMID: 40467861 Free PMC article.
-
Prc1-rich kinetochores are required for error-free acentrosomal spindle bipolarization during meiosis I in mouse oocytes.Nat Commun. 2020 May 27;11(1):2652. doi: 10.1038/s41467-020-16488-y. Nat Commun. 2020. PMID: 32461611 Free PMC article.
-
A three-step MTOC fragmentation mechanism facilitates bipolar spindle assembly in mouse oocytes.Nat Commun. 2015 Jul 6;6:7217. doi: 10.1038/ncomms8217. Nat Commun. 2015. PMID: 26147444 Free PMC article.
-
Mapping the kinetochore MAP functions required for stabilizing microtubule attachments to chromosomes during metaphase.Cytoskeleton (Hoboken). 2019 Jun;76(6):398-412. doi: 10.1002/cm.21559. Epub 2019 Sep 9. Cytoskeleton (Hoboken). 2019. PMID: 31454167 Free PMC article. Review.
-
[Kinesin-14 leaps to pole position in bipolar spindle assembly].Ai Zheng. 2008 Sep;27(9):989-92. Ai Zheng. 2008. PMID: 18799042 Review. Chinese.
Cited by
-
PP6 regulation of Aurora A-TPX2 limits NDC80 phosphorylation and mitotic spindle size.J Cell Biol. 2023 May 1;222(5):e202205117. doi: 10.1083/jcb.202205117. Epub 2023 Mar 10. J Cell Biol. 2023. PMID: 36897279 Free PMC article.
-
Highway to hell-thy meiotic divisions: Chromosome passenger complex functions driven by microtubules: CPC interactions with both the chromosomes and microtubules are important for spindle assembly and function: CPC interactions with both the chromosomes and microtubules are important for spindle assembly and function.Bioessays. 2022 Jan;44(1):e2100202. doi: 10.1002/bies.202100202. Epub 2021 Nov 25. Bioessays. 2022. PMID: 34821405 Free PMC article.
-
Acentriolar spindle assembly in mammalian female meiosis and the consequences of its perturbations on human reproduction†.Biol Reprod. 2022 Feb 22;106(2):253-263. doi: 10.1093/biolre/ioab210. Biol Reprod. 2022. PMID: 34791041 Free PMC article. Review.
-
Spatio-temporal requirements of Aurora kinase A in mouse oocyte meiotic spindle building.iScience. 2024 Jul 3;27(8):110451. doi: 10.1016/j.isci.2024.110451. eCollection 2024 Aug 16. iScience. 2024. PMID: 39081293 Free PMC article.
-
Whole-Mount Immunofluorescence Staining to Visualize Cell Cycle Progression in Mouse Oocyte Meiosis.Methods Mol Biol. 2024;2740:211-227. doi: 10.1007/978-1-0716-3557-5_13. Methods Mol Biol. 2024. PMID: 38393478
References
-
- Brugués J, Nuzzo V, Mazur E, Needleman DJ (2012) Nucleation and transport organize microtubules in metaphase spindles. Cell 149: 554–564 - PubMed
Publication types
MeSH terms
LinkOut - more resources
Full Text Sources
Other Literature Sources
