

Integration of comprehensive genomic profiling, tumor mutational burden, and PD-L1 expression to identify novel biomarkers of immunotherapy in non-small cell lung cancer
- PMID: 33655698
- PMCID: PMC7982619
- DOI: 10.1002/cam4.3649
Integration of comprehensive genomic profiling, tumor mutational burden, and PD-L1 expression to identify novel biomarkers of immunotherapy in non-small cell lung cancer
Abstract
Objectives: This study aimed to explore the novel biomarkers for immune checkpoint inhibitor (ICI) responses in non-small cell lung cancer (NSCLC) by integrating genomic profiling, tumor mutational burden (TMB), and expression of programmed death receptor 1 ligand (PD-L1).
Materials and methods: Tumor and blood samples from 637 Chinese patients with NSCLC were collected for targeted panel sequencing. Genomic alterations, including single nucleotide variations, insertions/deletions, copy number variations, and gene rearrangements, were assessed and TMB was computed. TMB-high (TMB-H) was defined as ≥10 mutations/Mb. PD-L1 positivity was defined as ≥1% tumor cells with membranous staining. Genomic data and ICI outcomes of 240 patients with NSCLC were derived from cBioPortal.
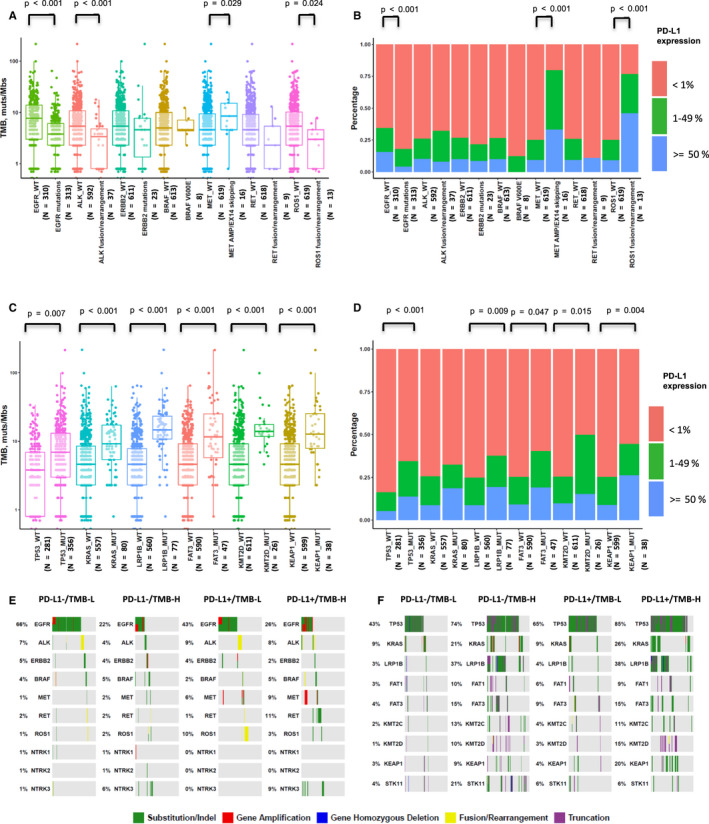
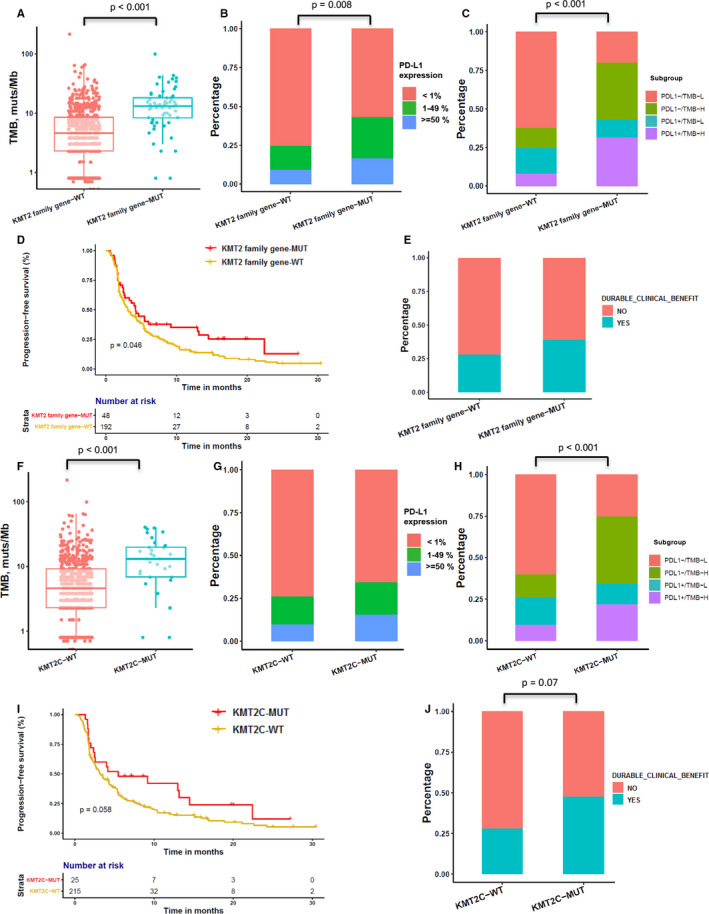
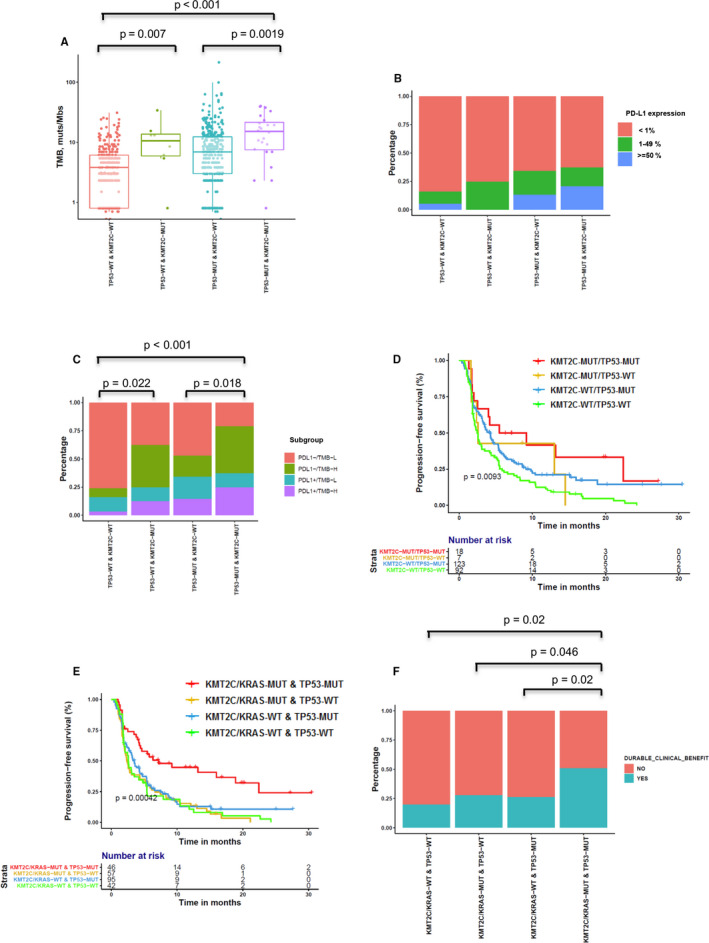
Results: EGFR-sensitizing mutations, ALK, RET, and ROS1 rearrangements were associated with lower TMB and PD-L1+/TMB-H proportions, whereas KRAS, ALK, RET, and ROS1 substitutions/indels correlated with higher TMB and PD-L1+/TMB-H proportions than wild-type genotypes. Histone-lysine N-methyltransferase 2 (KMT2) family members (KMT2A, KMT2C, and KMT2D) were frequently mutated in NSCLC tumors, and these mutations were associated with higher TMB and PD-L1 expression, as well as higher PD-L1+/TMB-H proportions. Specifically, patients with KMT2C mutations had higher TMB and PD-L1+/TMB-H proportions than wild-type patients. The median progression-free survival (PFS) was 5.47 months (95% CI 2.5-NA) in patients with KMT2C mutations versus 3.17 months (95% CI 2.6-4.27) in wild-type patients (p = 0.058). Furthermore, in patients with NSCLC who underwent ICI treatment, patients with TP53/KMT2C co-mutations had significantly longer PFS and greater durable clinical benefit (HR: 0.48, 95% CI: 0.24-0.94, p = 0.033). TP53 mutation combined with KMT2C or KRAS mutation was a better biomarker with expanded population benefit from ICIs therapy and increased the predictive power (HR: 0.46, 95% CI: 0.26-0.81, p = 0.007).
Conclusion: We found that tumors with different alterations in actionable target genes had variable expression of PD-L1 and TMB in NSCLC. TP53/KMT2C co-mutation might serve as a predictive biomarker for ICI responses in NSCLC.
Implications for practice: Cancer immunotherapies, especially immune checkpoint inhibitors (ICIs), have revolutionized the treatment of non-small cell lung cancer (NSCLC); however, only a proportion of patients derive durable responses to this treatment. Biomarkers with greater accuracy are highly needed. In total, 637 Chinese patients with NSCLC were analyzed using next-generation sequencing and IHC to characterize the unique features of genomic alterations and TMB and PD-L1 expression. Our study demonstrated that KMT2C/TP53 co-mutation might be an accurate, cost-effective, and reliable biomarker to predict responses to PD-1 blockade therapy in NSCLC patients and that adding KRAS to the biomarker combination creates a more robust parameter to identify the best responders to ICI therapy.
Keywords: lysine methyltransferase 2C; non-small cell lung cancer; programmed cell death 1 ligand 1; tumor mutation burden; tumor protein p53.
© 2021 The Authors. Cancer Medicine published by John Wiley & Sons Ltd.
Figures
Similar articles
-
Oncogene-specific differences in tumor mutational burden, PD-L1 expression, and outcomes from immunotherapy in non-small cell lung cancer.J Immunother Cancer. 2021 Aug;9(8):e002891. doi: 10.1136/jitc-2021-002891. J Immunother Cancer. 2021. PMID: 34376553 Free PMC article.
-
Association of Survival and Immune-Related Biomarkers With Immunotherapy in Patients With Non-Small Cell Lung Cancer: A Meta-analysis and Individual Patient-Level Analysis.JAMA Netw Open. 2019 Jul 3;2(7):e196879. doi: 10.1001/jamanetworkopen.2019.6879. JAMA Netw Open. 2019. PMID: 31290993 Free PMC article.
-
Association of TP53 mutations with response and longer survival under immune checkpoint inhibitors in advanced non-small-cell lung cancer.Lung Cancer. 2019 Jun;132:65-71. doi: 10.1016/j.lungcan.2019.04.005. Epub 2019 Apr 8. Lung Cancer. 2019. PMID: 31097096
-
[Updated guidelines for predictive biomarker testing in advanced non-small-cell lung cancer: A National Consensus of the Spanish Society of Pathology and the Spanish Society of Medical Oncology].Rev Esp Patol. 2020 Jul-Sep;53(3):167-181. doi: 10.1016/j.patol.2019.11.004. Epub 2020 Jun 16. Rev Esp Patol. 2020. PMID: 32650968 Review. Spanish.
-
The association of efficacy with PD-1/PD-L1 inhibition and tumor mutational burden in advanced nonsmall cell lung cancer: A PRISMA-guided literature review and meta-analysis.Medicine (Baltimore). 2022 Jul 22;101(29):e29676. doi: 10.1097/MD.0000000000029676. Medicine (Baltimore). 2022. PMID: 35866790 Free PMC article. Review.
Cited by
-
Epigenetic regulation of pancreatic adenocarcinoma in the era of cancer immunotherapy.J Gastroenterol. 2022 Nov;57(11):819-826. doi: 10.1007/s00535-022-01915-2. Epub 2022 Sep 1. J Gastroenterol. 2022. PMID: 36048239 Free PMC article. Review.
-
[Research Progress of Anti-PD-1/PD-L1 Therapy for Non-small Cell Lung Cancer with EGFR Mutation].Zhongguo Fei Ai Za Zhi. 2022 Oct 20;25(10):742-749. doi: 10.3779/j.issn.1009-3419.2022.101.44. Epub 2022 Sep 28. Zhongguo Fei Ai Za Zhi. 2022. PMID: 36167460 Free PMC article. Chinese.
-
Epigenetic modification in radiotherapy and immunotherapy for cancers.Tzu Chi Med J. 2024 Sep 5;36(4):396-406. doi: 10.4103/tcmj.tcmj_3_24. eCollection 2024 Oct-Dec. Tzu Chi Med J. 2024. PMID: 39421493 Free PMC article. Review.
-
Mechanisms of immune regulation for acupuncture on chronic respiratory diseases.J Tradit Chin Med. 2022 Apr;42(2):314-320. doi: 10.19852/j.cnki.jtcm.2022.02.009. J Tradit Chin Med. 2022. PMID: 35473354 Free PMC article.
-
Application of nitroxoline in urologic oncology - a review of evidence.Contemp Oncol (Pozn). 2024;28(1):1-8. doi: 10.5114/wo.2024.139584. Epub 2024 May 19. Contemp Oncol (Pozn). 2024. PMID: 38800529 Free PMC article. Review.
References
-
- Chen W, Zheng R, Baade PD, et al. Cancer statistics in China, 2015. CA Cancer J Clin. 2016;66(2):115‐132. - PubMed
-
- Anagnostou VK, Brahmer JR. Cancer immunotherapy: a future paradigm shift in the treatment of non‐small cell lung cancer. Clin Cancer Res. 2015;21(5):976‐984. - PubMed
-
- Mok TSK, Yi‐Long W, Kudaba I, et al. Pembrolizumab versus chemotherapy for previously untreated, PD‐L1‐expressing, locally advanced or metastatic non‐small‐cell lung cancer (KEYNOTE‐042): a randomised, open‐label, controlled, phase 3 trial. Lancet. 2019;393:1819‐1830. - PubMed
-
- Rosenbaum M, Khosrowjerdi S, Kamesan V, Digumarthy S. The utility of PD‐L1/CD8 dual immunohistochemistry for prediction of response to immunotherapy in non‐small cell lung cancer (NSCLC). J Thorac Oncol. 2018;13(10): S533.
Publication types
MeSH terms
Substances
LinkOut - more resources
Full Text Sources
Other Literature Sources
Medical
Research Materials
Miscellaneous
