Evidence of enteric angiopathy and neuromuscular hypoxia in patients with mitochondrial neurogastrointestinal encephalomyopathy
- PMID: 33655764
- PMCID: PMC8202202
- DOI: 10.1152/ajpgi.00047.2021
Evidence of enteric angiopathy and neuromuscular hypoxia in patients with mitochondrial neurogastrointestinal encephalomyopathy
Abstract
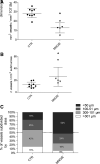
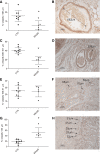
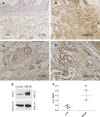
Mitochondrial neurogastrointestinal encephalomyopathy (MNGIE) is a rare autosomal recessive disease caused by thymidine phosphorylase (TP) enzyme defect. As gastrointestinal changes do not revert in patients undergone TP replacement therapy, one can postulate that other unexplored mechanisms contribute to MNGIE pathophysiology. Hence, we focused on the local TP angiogenic potential that has never been considered in MNGIE. In this study, we investigated the enteric submucosal microvasculature and the effect of hypoxia on fibrosis and enteric neurons density in jejunal full-thickness biopsies collected from patients with MNGIE. Orcein staining was used to count blood vessels based on their size. Fibrosis was assessed using the Sirius Red and Fast Green method. Hypoxia and neoangiogenesis were determined via hypoxia-inducible-factor-1α (HIF-1α) and vascular endothelial cell growth factor (VEGF) protein expression, respectively. Neuron-specific enolase was used to label enteric neurons. Compared with controls, patients with MNGIE showed a decreased area of vascular tissue, but a twofold increase of submucosal vessels/mm2 with increased small size and decreased medium and large size vessels. VEGF positive vessels, fibrosis index, and HIF-1α protein expression were increased, whereas there was a diminished thickness of the longitudinal muscle layer with an increased interganglionic distance and reduced number of myenteric neurons. We demonstrated the occurrence of an angiopathy in the GI tract of patients with MNGIE. Neoangiogenetic changes, as detected by the abundance of small size vessels in the jejunal submucosa, along with hypoxia provide a morphological basis to explain neuromuscular alterations, vasculature breakdown, and ischemic abnormalities in MNGIE.NEW & NOTEWORTHY Mitochondrial neurogastrointestinal encephalomyopathy (MNGIE) is characterized by a genetically driven defect of thymidine phosphorylase, a multitask enzyme playing a role also in angiogenesis. Indeed, major gastrointestinal bleedings are life-threatening complications of MNGIE. Thus, we focused on jejunal submucosal vasculature and showed intestinal microangiopathy as a novel feature occurring in this disease. Notably, vascular changes were associated with neuromuscular abnormalities, which may explain gut dysfunction and help to develop future therapeutic approaches in MNGIE.
Keywords: angiogenesis; fibrosis; gastrointestinal bleeding; platelet-derived endothelial cell growth factor 1; submucosal vessels.
Conflict of interest statement
No conflicts of interest, financial or otherwise, are declared by the authors.
Figures


Similar articles
-
Lysosomal dysfunction and overload of nucleosides in thymidine phosphorylase deficiency of MNGIE.J Transl Med. 2024 May 13;22(1):449. doi: 10.1186/s12967-024-05275-8. J Transl Med. 2024. PMID: 38741129 Free PMC article.
-
Mitochondrial neurogastrointestinal encephalomyopathy (MNGIE): case report with a new mutation.Eur J Pediatr. 2010 Nov;169(11):1375-8. doi: 10.1007/s00431-010-1237-0. Epub 2010 Jun 29. Eur J Pediatr. 2010. PMID: 20585803
-
Evaluation of gastrointestinal mtDNA depletion in mitochondrial neurogastrointestinal encephalomyopathy (MNGIE).Methods Mol Biol. 2011;755:223-32. doi: 10.1007/978-1-61779-163-5_18. Methods Mol Biol. 2011. PMID: 21761307
-
Gastrointestinal Dysmotility in MNGIE: from thymidine phosphorylase enzyme deficiency to altered interstitial cells of Cajal.Orphanet J Rare Dis. 2019 Feb 8;14(1):33. doi: 10.1186/s13023-019-1016-6. Orphanet J Rare Dis. 2019. PMID: 30736844 Free PMC article. Review.
-
Novel Mutations of the TYMP Gene in Mitochondrial Neurogastrointestinal Encephalomyopathy: Case Series and Literature Review.J Mol Neurosci. 2021 Dec;71(12):2526-2533. doi: 10.1007/s12031-021-01822-w. Epub 2021 Apr 6. J Mol Neurosci. 2021. PMID: 33825174 Review.
Cited by
-
Anatomical Laser Microdissection of the Ileum Reveals mtDNA Depletion Recovery in A Mitochondrial Neuro-Gastrointestinal Encephalomyopathy (MNGIE) Patient Receiving Liver Transplant.Int J Mol Sci. 2022 Aug 8;23(15):8792. doi: 10.3390/ijms23158792. Int J Mol Sci. 2022. PMID: 35955927 Free PMC article.
-
Optimization of protocols for immunohistochemical assessment of enteric nervous system in formalin fixed human tissue.bioRxiv [Preprint]. 2024 Dec 17:2024.12.15.628584. doi: 10.1101/2024.12.15.628584. bioRxiv. 2024. PMID: 39763767 Free PMC article. Preprint.
-
Multi-disciplinary Insights from the First European Forum on Visceral Myopathy 2022 Meeting.Dig Dis Sci. 2023 Oct;68(10):3857-3871. doi: 10.1007/s10620-023-08066-1. Epub 2023 Aug 31. Dig Dis Sci. 2023. PMID: 37650948 Free PMC article. Review.
-
Mitochondrial DNA Depletion Syndrome and Its Associated Cardiac Disease.Front Cardiovasc Med. 2022 Feb 14;8:808115. doi: 10.3389/fcvm.2021.808115. eCollection 2021. Front Cardiovasc Med. 2022. PMID: 35237671 Free PMC article. Review.
-
Distinctive metabolic remodeling in TYMP deficiency beyond mitochondrial dysfunction.J Mol Med (Berl). 2023 Oct;101(10):1237-1253. doi: 10.1007/s00109-023-02358-9. Epub 2023 Aug 21. J Mol Med (Berl). 2023. PMID: 37603049
References
-
- Hirano M, Carelli V, De Giorgio R, Pironi L, Accarino A, Cenacchi G , et al. Mitochondrial neurogastrointestinal encephalomyopathy (MNGIE): Position paper on diagnosis, prognosis, and treatment by the MNGIE International Network. J Inherit Metab Dis 1–12, 2020. doi:10.1002/jimd.12300. - DOI - PMC - PubMed
-
- Hirano M, Silvestri G, Blake DM, Lombes A, Minetti C, Bonilla E, Hays AP, Lovelace RE, Butler I, Bertorini TE. and Mitochondrial neurogastrointestinal encephalomyopathy (MNGIE): clinical, biochemical, and genetic features of an autosomal recessive mitochondrial disorder. Neurology 44: 721–727, 1994. doi:10.1212/wnl.44.4.721. - DOI - PubMed
-
- De Giorgio R, Pironi L, Rinaldi R, Boschetti E, Caporali L, Capristo M, Casali C, Cenacchi G, Contin M, D'Angelo R, D'Errico A, Gramegna LL, Lodi R, Maresca A, Mohamed S, Morelli MC, Papa V, Tonon C, Tugnoli V, Carelli V, D'Alessandro R, Pinna AD. Liver transplantation for mitochondrial neurogastrointestinal encephalomyopathy. Ann Neurol 80: 448–455, 2016. doi:10.1002/ana.24724. - DOI - PubMed
Publication types
MeSH terms
Substances
Supplementary concepts
Grants and funding
LinkOut - more resources
Full Text Sources
Other Literature Sources
Research Materials

