. 2021 Apr;25(8):4028-4039.
doi: 10.1111/jcmm.16367. Epub 2021 Mar 3.

Phenotypic switch of smooth muscle cells in paediatric chronic intestinal pseudo-obstruction syndrome

Affiliations

Phenotypic switch of smooth muscle cells in paediatric chronic intestinal pseudo-obstruction syndrome

Delphine Martire et al. J Cell Mol Med. 2021 Apr.

Abstract

Smooth Muscle Cells (SMC) are unique amongst all muscle cells in their capacity to modulate their phenotype. Indeed, SMCs do not terminally differentiate but instead harbour a remarkable capacity to dedifferentiate, switching between a quiescent contractile state and a highly proliferative and migratory phenotype, a quality often associated to SMC dysfunction. However, phenotypic plasticity remains poorly examined in the field of gastroenterology in particular in pathologies in which gut motor activity is impaired. Here, we assessed SMC status in biopsies of infants with chronic intestinal pseudo-obstruction (CIPO) syndrome, a life-threatening intestinal motility disorder. We showed that CIPO-SMCs harbour a decreased level of contractile markers. This phenotype is accompanied by an increase in Platelet-Derived Growth Factor Receptor-alpha (PDGFRA) expression. We showed that this modulation occurs without origin-related differences in CIPO circular and longitudinal-derived SMCs. As we characterized PDGFRA as a marker of digestive mesenchymal progenitors during embryogenesis, our results suggest a phenotypic switch of the CIPO-SMC towards an undifferentiated stage. The development of CIPO-SMC culture and the characterization of SMC phenotypic switch should enable us to design therapeutic approaches to promote SMC differentiation in CIPO.

Keywords: PDGFR pathway; chronic intestinal pseudo-obstruction Disease; intestinal motility disorders; plasticity; smooth muscle cells.


Conflict of interest statement

The authors confirm that there are no conflicts of interest.

Figures

FIGURE 1
FIGURE 1
Development of CIPO‐SMC cultures and identification of SMC alteration. (A) Representative immunofluorescence images of CIPO‐ and CTL‐SMC cultures incubated with anti‐αSMA (green) and anti‐MYOCARDIN (MYOCD, red) antibodies. Nuclei were visualized with Hoechst (blue). Scale bar = 20 µm. Percentage of MYOCARDIN‐positive (B) and αSMA‐positive cells (C) in CIPO‐ and CTL‐SMC cultures relative to the total number of nuclei (Hoechst staining). Values are presented as the mean ± SD of n = 5 experiments at early passages (2‐3). CTL1 and CIPO data were compared with the two‐tailed Mann‐Whitney test. (D) Representative Western blot analysis of αSMA expression in CIPO‐ and CTL‐SMC extracts. (E) Quantification relative to GAPDH expression of the Western blot results shown in D. (F) Representative immunofluorescence analysis of SMC cultures from circular and longitudinal smooth muscle layers with anti‐αSMA (green) and anti‐MYOCARDIN (MYOCD, red) antibodies. Nuclei were visualized with Hoechst (blue). Scale bar = 40 µm. Percentage of MYOCARDIN‐positive (G) and αSMA‐positive cells (H) in the indicated SMC cultures relative to the total number of cells
FIGURE 2
FIGURE 2
Spatial and temporal expression of PDGFRA mRNA during embryonic development of the chick GI tract. (A) Heatmap for PDGFRA in chick colon and stomach (E6 and E9) samples. The highest signals are in res, and lowest signals are in green. PDGFRA mRNA is strongly expressed in the early stages, whereas SMC differentiation markers (ACTG2, TAGLN, CNN1, MYH11, FLNA) are strongly expressed at E9. CD34 and WNT5A are specific from telocytes. KIT and CD44 are associated to ICCs. SOX10 and RET characterize ENS identity. (B) Whole‐mount in situ hybridization analysis of PDGFRA and TAGLN in the chick E5, E7 and E9 GI tract. PDGFRA is strongly expressed in the GI mesenchyme at E5 whereas TAGLN is strongly present at E9. (C) Schematic representation of the expression of PDGFRA during GI mesenchymal progenitors to differentiated SMCs
FIGURE 3
FIGURE 3
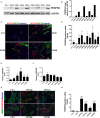
Aberrant PDGFRA expression in paediatric CIPO‐SMCs. (A) Representative Western blot analysis of PDGFRA expression in CIPO‐ and CTL‐SMC extracts. (B) Quantification relative to βACTIN expression of the Western blot results shown in A. (C) Representative immunofluorescence images of CIPO‐ and CTL‐SMC cultures incubated with anti‐PDGFRA (green) and anti‐MYOCARDIN (MYOCD, red) antibodies. Nuclei were visualized with Hoechst (blue). Scale bar = 20 µm. Percentage of PDGFRA‐positive (D) cells in CIPO‐ and CTL‐SMC cultures relative to the total number of nuclei (Hoechst staining). Values are presented as the mean ± SD of n = 5 experiments at early passages (2‐3). CTL1 and CIPO data were compared with the two‐tailed Mann‐Whitney test. RT‐qPCR analysis of PDGFRA (E) and PDGFRB (F) expression in CTL‐ and CIPO‐SMC cultures relative to GAPDH and RPLPO. Values are presented as the mean ± SD of n = 5 experiments with cells at early passages (2‐3). CTL and CIPO data were compared with the two‐tailed Mann‐Whitney test. (G) Representative immunofluorescence analysis of SMC cultures from circular and longitudinal smooth muscle layers with anti‐αSMA (green) and anti‐PDGFRA (red) antibodies. Nuclei were visualized with Hoechst (blue). Scale bar = 40 µm. Percentage of PDGFRA‐positive (H) in the indicated SMC cultures relative to the total number of cells
FIGURE 4
FIGURE 4
PDGFRA is functional in CIPO‐SMCs. (A) Representative immunoblots showing phosphorylated ERK (p‐ERK) and total ERK in CIPO2‐, CIPO4‐ and CTL1‐SMC culture that were serum starved before stimulation or not (‐) with the indicated concentrations of PDGF‐AA. Protein loading was verified with an anti‐GAPDH antibody. Quantification of the Western blot data in (B). P‐ERK and ERK levels were normalized to GAPDH expression (left and middle panels). Normalized expression levels were converted to fold changes compared with CTL without stimulation (set to 1) for ERK activity (right panel)
FIGURE 5
FIGURE 5
Immunodetection of PDGFRA and αSMA in full‐thickness intestinal biopsies from children with CIPO syndrome. All biopsies are oriented to show the circular muscle layer on top and the longitudinal layer at the bottom. Tissue sections from (A) the normal ganglionic zone in a control biopsy from a patient with Hirschsprung's disease patient (CTL1) and (B) from a biopsy of a child with CIPO syndrome (CIPO1) were incubated with rabbit anti‐PDGFRA and mouse anti‐αSMA antibodies. Nuclei were visualized with Hoechst (blue). Scale bars = 50 µm and 20 µm for enlargement. Images are representative of triplicate experiment. White arrows indicate the below enlargement. White asterisk indicates myenteric plexus. RT‐qPCR analysis of (C) αSMA expression and (D) PDGFRA expression in CIPO (n = 6) and CTL (n = 6) intestinal muscle layers; values (mean ± SD) are relative to GAPDH and RPLPO mRNA expression
FIGURE 6
FIGURE 6
Model of the gastrointestinal SMC development and plasticity versus PDGFRA expression

References

    1. Owens GK, Kumar MS, Wamhoff BR. Molecular regulation of vascular smooth muscle cell differentiation in development and disease. Physiol Rev. 2004;84:767‐801. - PubMed
    1. Le Guen L, Marchal S, Faure S, et al. Mesenchymal‐epithelial interactions during digestive tract development and epithelial stem cell regeneration. Cell. Mol. Life Sci. 2015;72:3883‐3896. - PMC - PubMed
    1. Scirocco A, Matarrese P, Carabotti M, et al. Cellular and Molecular Mechanisms of Phenotypic Switch in Gastrointestinal Smooth Muscle. J. Cell. Physiol. 2016;231:295‐302. - PubMed
    1. Nair DG, Miller KG, Lourenssen SR, et al. Inflammatory cytokines promote growth of intestinal smooth muscle cells by induced expression of PDGF‐Rβ. J. Cell. Mol. Med. 2014;18:444‐454. - PMC - PubMed
    1. Knowles CH, De Giorgio R, Kapur RP, et al. The London Classification of gastrointestinal neuromuscular pathology: report on behalf of the Gastro 2009 International Working Group. Gut. 2010;59:882‐887. - PubMed

Publication types