. 2021 Jul;10(7):1081-1094.
doi: 10.1002/sctm.20-0386. Epub 2021 Mar 3.

Elevated glucosylsphingosine in Gaucher disease induced pluripotent stem cell neurons deregulates lysosomal compartment through mammalian target of rapamycin complex 1

Affiliations

Elevated glucosylsphingosine in Gaucher disease induced pluripotent stem cell neurons deregulates lysosomal compartment through mammalian target of rapamycin complex 1

Manasa P Srikanth et al. Stem Cells Transl Med. 2021 Jul.

Abstract

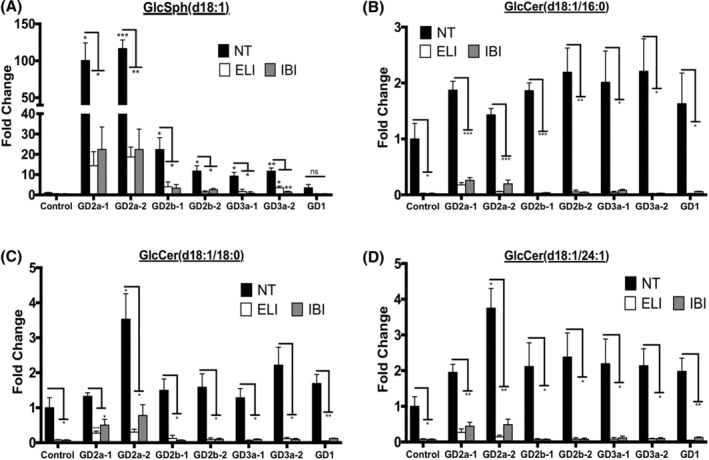
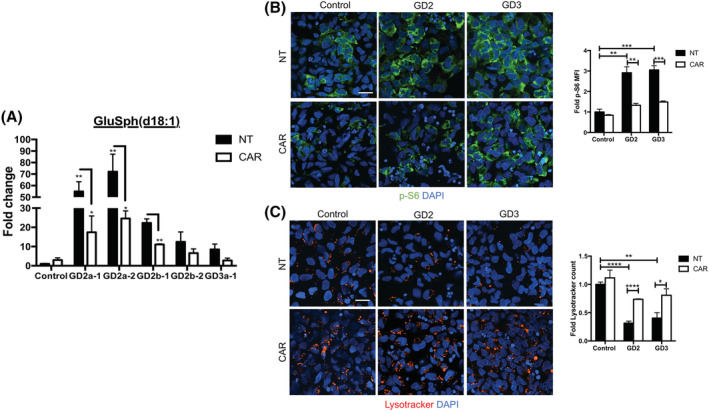
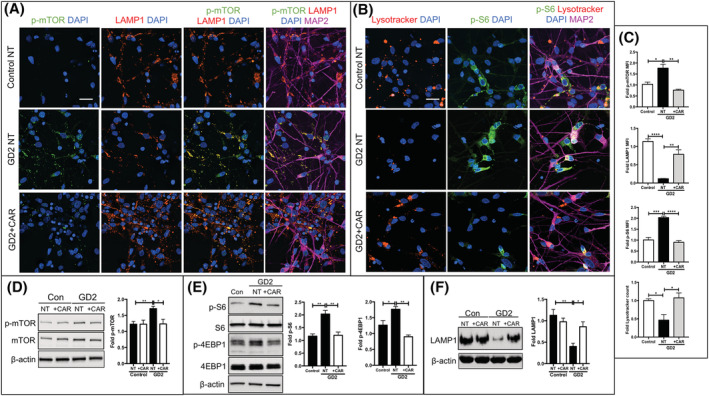
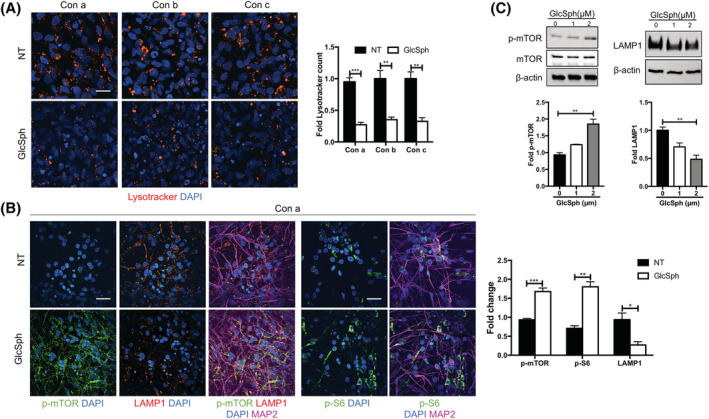
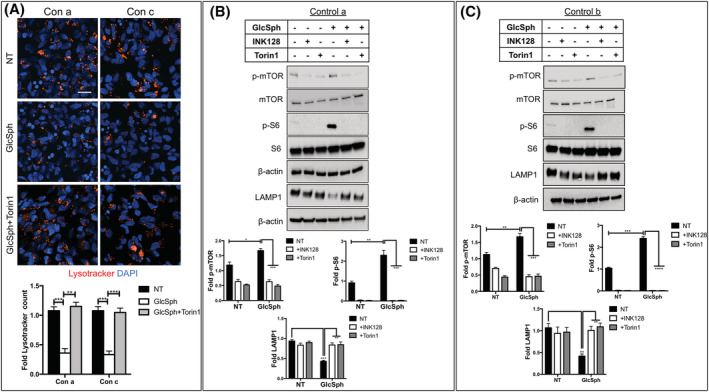
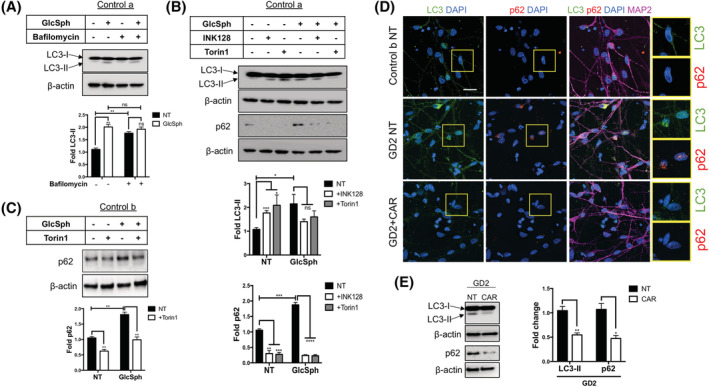
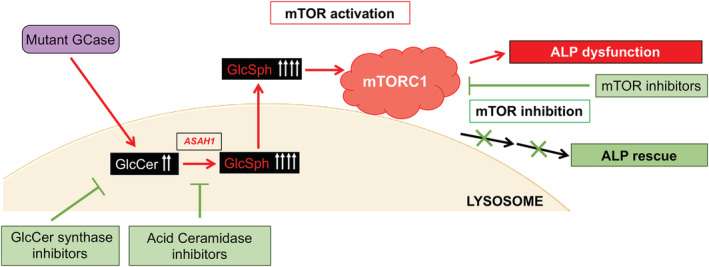
Gaucher disease (GD) is a lysosomal storage disorder caused by mutations in GBA1, the gene that encodes lysosomal β-glucocerebrosidase (GCase). Mild mutations in GBA1 cause type 1 non-neuronopathic GD, whereas severe mutations cause types 2 and 3 neuronopathic GD (nGD). GCase deficiency results in the accumulation of glucosylceramide (GlcCer) and glucosylsphingosine (GlcSph). GlcSph is formed by deacylation of GlcCer by the lysosomal enzyme acid ceramidase. Brains from patients with nGD have high levels of GlcSph, a lipid believed to play an important role in nGD, but the mechanisms involved remain unclear. To identify these mechanisms, we used human induced pluripotent stem cell-derived neurons from nGD patients. We found that elevated levels of GlcSph activate mammalian target of rapamycin (mTOR) complex 1 (mTORC1), interfering with lysosomal biogenesis and autophagy, which were restored by incubation of nGD neurons with mTOR inhibitors. We also found that inhibition of acid ceramidase prevented both, mTOR hyperactivity and lysosomal dysfunction, suggesting that these alterations were caused by GlcSph accumulation in the mutant neurons. To directly determine whether GlcSph can cause mTOR hyperactivation, we incubated wild-type neurons with exogenous GlcSph. Remarkably, GlcSph treatment recapitulated the mTOR hyperactivation and lysosomal abnormalities in mutant neurons, which were prevented by coincubation of GlcSph with mTOR inhibitors. We conclude that elevated GlcSph activates an mTORC1-dependent pathogenic mechanism that is responsible for the lysosomal abnormalities of nGD neurons. We also identify acid ceramidase as essential to the pathogenesis of nGD, providing a new therapeutic target for treating GBA1-associated neurodegeneration.

Keywords: drug target; experimental models; induced pluripotent stem cells; neural differentiation; neuropathy; signal transduction; stem/progenitor cell.


Conflict of interest statement

The authors declared no potential conflicts of interest.

Figures

FIGURE 1
FIGURE 1
GlcCer synthase inhibitors prevent the accumulation of GlcCer and GlcSph in GD NPCs. NPCs derived from WT control a, two hiPSC clones each of GD2a, GD2b, and GD3a donors, and one clone of a GD1 donor, were either left untreated (NT) or incubated with the GlcCer synthase inhibitors Eliglustat (ELI) or Ibiglustat (IBI) as described in Section 2. The neuronal cells were then analyzed by high‐performance liquid chromatography with tandem mass spectrometry (HPLC‐MS/MS) for the indicated species of GlcSph (A) and GlcCer (B‐D). The plots represent fold‐change compared to no treatment (NT) control a (mean ± SEM, n = 3). Control NT vs GD NT and GD NT vs treated GD, t test. *P < .05, **P < .01, ***P < .001. GD, Gaucher disease; GlcCer, glucosylceramide; GlcSph, glucosylsphingosine; hiPSC, human induced pluripotent stem cell; NPCs, neuronal progenitor cells; ns, nonsignificant; WT, wild type
FIGURE 2
FIGURE 2
Acid ceramidase inhibition in nGD NPCs decreases GlcSph levels and reverses the mTOR/lysosomal phenotype. A, HPLC‐MS/MS analysis showing GlcSph levels in WT (control a), GD2, and GD3 NPCs that were either left untreated (NT) or treated with the acid ceramidase inhibitor Carmofur (CAR) as described in Section 2. NPCs derived from two hiPSC clones each of a GD2a and a GD2b donor and one clone of a GD3a donor were utilized for this experiment. Data represent fold‐change compared to NT control a (mean ± SEM, n = 3). B,C, Representative immunofluorescence images of p‐S6 (B, green) and Lysotracker (C, red) in control a, GD2a, and GD3a NPCs that were either left untreated (NT) or incubated with Carmofur as in (A), above. Nuclei were stained with DAPI (blue). Magnification ×40. Scale bar = 25 μm. Plots at the right of (B) and (C) represent fold‐change in mean fluorescence intensity (MFI) of p‐S6 and Lysotracker counts, respectively (mean ± SEM, n = 3). Control NT vs GD NT and GD NT vs GD treated with Carmofur, t test. *P < .05, **P < .01, ***P < .001, ****P < .0001. DAPI, 4',6‐diamidino‐2‐phenylindole; GlcSph, glucosylsphingosine; hiPSC, human induced pluripotent stem cell; HPLC‐MS/MS, high‐performance liquid chromatography with tandem mass spectrometry; mTOR, mammalian target of rapamycin; nGD, neuronopathic Gaucher disease; NPCs, neuronal progenitor cells; WT, wild type
FIGURE 3
FIGURE 3
Acid ceramidase inhibition in GD2 neurons reduces mTOR hyperactivity and rescues lysosomal biogenesis. A,B, Representative immunofluorescence images of control a neurons, and GD2a neurons that were either not treated (NT) or incubated with Carmofur (CAR) as described in Section 2. The neurons were stained with Lysotracker (B, red) and with antibodies to p‐mTOR (A, green), LAMP1 (A, red), p‐S6 (B, green), and MAP2 (A, B, magenta). Nuclei were stained with DAPI (blue). Magnification ×40. Scale bar = 25 μm. C, The fold‐change in Lysotracker counts and MFI of p‐mTOR, LAMP1 and p‐S6 shown in the graphs (mean ± SEM, n = 4) were calculated as described in Section 2. D‐F, Immunoblot analysis of p‐mTOR, mTOR, p‐S6, S6, p‐4EBP1, 4EBP1, and LAMP1 in control a and GD2a neurons that were either left untreated (NT) or incubated with Carmofur (CAR) as in (A) and (B), above. Results in the adjacent plots are expressed as fold‐change with respect to the NT control a (mean ± SEM, n = 3). Control NT vs GD NT and GD NT vs GD treated with Carmofur, t test. *P < .05, **P < .01, ***P < .001, ****P < .0001. DAPI, 4',6‐diamidino‐2‐phenylindole; MFI, mean fluorescence intensity; mTOR, mammalian target of rapamycin
FIGURE 4
FIGURE 4
Treatment of WT NPCs and differentiated neurons with GlcSph recapitulates the mTOR/lysosomal phenotype of neuronopathic GD. A, Lysotracker staining (red) of WT NPCs from controls a, b, and c (Con a, Con b, and Con c) that were either left untreated (NT) or treated with GlcSph for 8 hours as described in Section 2. Nuclei were stained with DAPI (blue). Lysotracker counts plotted at the right of images are expressed as fold‐change compared to untreated control a (mean ± SEM, n = 4, t test). B, Immunofluorescence staining of p‐mTOR (green), LAMP1 (red), p‐S6 (green), MAP2 (magenta), and DAPI (nuclei‐blue) in WT (control a) neurons that were either left untreated (NT) or treated with GlcSph as in (A), above. Magnification in (A) and (B): ×40. Scale bar = 25 μm. The fold‐change in MFI of p‐mTOR, p‐S6, and LAMP1 is shown in graph at the right of image (mean ± SEM, n = 4, t test). C, Representative Western blot of p‐mTOR, mTOR, and LAMP1 in WT (control a) neurons treated with the indicated doses of GlcSph for 8 hours. The graphs below each immunoblot represents fold‐change with respect to untreated neurons (mean ± SEM, n = 3, one‐way analysis of variance [ANOVA]). *P < .05, **P < .01, ***P < .001. DAPI, 4',6‐diamidino‐2‐phenylindole; GD, Gaucher disease; GlcSph, glucosylsphingosine; MFI, mean fluorescence intensity; mTOR, mammalian target of rapamycin; NPCs, neuronal progenitor cells; WT, wild type
FIGURE 5
FIGURE 5
mTOR inhibitors prevent mTOR hyperactivation and lysosomal depletion induced by exogenous GlcSph. A, WT NPCs (controls a and c) were either left untreated (NT) or incubated with GlcSph for 8 hours in the absence or presence of Torin1 as described in Section 2. The cultures were then stained with Lysotracker (red) and with DAPI (blue). Magnification ×40. Scale bar = 25 μm. Graph below the image represents fold‐change in Lysotracker counts compared to the untreated controls (mean ± SEM, n = 3). B,C, Western blot analysis of p‐mTOR, mTOR, p‐S6, S6, and LAMP1 in WT control a (B) and control b (C) neurons that were either left untreated (NT), or incubated with INK128 alone, Torin1 alone, or were incubated with GlcSph in the absence or presence of INK128 and Torin1, as indicated in the figure. Quantitation of the Western blots is shown below the corresponding immunoblots. The graphs represent fold‐change with respect to the corresponding untreated Controls, and results are plotted as mean ± SEM (n = 3). The graphs in (A), (B), and (C) were assessed by t test between the indicated groups. *P < .05, **P < .01, ***P < .001, ****P < .0001. DAPI, 4',6‐diamidino‐2‐phenylindole; GlcSph, glucosylsphingosine; mTOR, mammalian target of rapamycin; NPCs, neuronal progenitor cells; WT, wild type
FIGURE 6
FIGURE 6
Inhibitors of mTOR and acid ceramidase reverse the autophagic block caused by GlcSph. A, control a neurons were either left untreated (NT) or incubated with GlcSph alone, Bafilomycin (Baf) alone, or were coincubated with both GlcSph and Baf as described in Section 2. Total cell lysates were prepared and Western blotting was performed to analyze the levels of LC3‐I and LC3‐II. B, Western blotting showing LC3 and p62 protein levels in WT (control a) neurons that were either left untreated (NT) or incubated with INK128 alone, Torin1 alone, or incubated with GlcSph in the absence or presence of INK128 and Torin1, as indicated in the figure. Quantitation of the Western blots is shown below the immunoblots. C, Western blot of p62 protein levels in control b neurons that were either left untreated (NT) or incubated with Torin1 alone, GlcSph alone, or were coincubated with GlcSph and Torin1. The graphs in (A), (B), and (C) represent fold‐change with respect to the corresponding NT Control, and results are plotted as mean ± SEM (n = 3). The differences were assessed by t test between the indicated groups. *P < .05, **P < .01, ***P < .001, ****P < .0001. D, Confocal immunofluorescence images of LC3 (green), p62 (red), and MAP2 (magenta) in untreated WT (control b) and GD2a neurons as well as GD2a neurons treated with Carmofur (CAR). Nuclei were stained with DAPI (blue). Magnification ×40. Scale bar = 25 μm. Insets on the right side of the images are enlarged areas from each panel. E, Western blot depicting LC3‐I, LC3‐II, and p62 protein expression in untreated (NT) or Carmofur (CAR)‐treated GD2a neurons. The results are expressed as fold‐change with respect to NT GD2a (mean ± SEM, n = 3, t test, *P < .05, **P < .01). DAPI, 4',6‐diamidino‐2‐phenylindole; GlcSph, glucosylsphingosine; mTOR, mammalian target of rapamycin; WT, wild type
FIGURE 7
FIGURE 7
Proposed model of GlcSph‐mediated lysosomal dysfunction in nGD neurons. Mutant GCase causes the accumulation of GlcCer, which is converted to GlcSph via an alternate metabolic pathway by acid ceramidase (ASAH1) in the lysosome. The excess GlcSph, which is water‐soluble, exits the lysosome into the cytoplasm and activates the mTOR complex 1 (mTORC1) leading to lysosomal depletion and autophagy block. Inhibitors of GlcCer synthase, ASAH1, and mTOR are able to suppress mTOR hyperactivation and rescue the ALP in mutant neurons. ALP, autophagy lysosomal pathway; GCase, β‐glucocerebrosidase; GlcCer, glucosylceramide; GlcSph, glucosylsphingosine; mTOR, mammalian target of rapamycin; nGD, neuronopathic Gaucher disease

Similar articles

Cited by

References

    1. Farfel‐Becker T, Vitner EB, Kelly SL, et al. Neuronal accumulation of glucosylceramide in a mouse model of neuronopathic Gaucher disease leads to neurodegeneration. Hum Mol Genet. 2014;23(4):843‐854. - PMC - PubMed
    1. Nilsson O, Svennerholm L. Accumulation of glucosylceramide and glucosylsphingosine (psychosine) in cerebrum and cerebellum in infantile and juvenile Gaucher disease. J Neurochem. 1982;39(3):709‐718. - PubMed
    1. Hallett PJ, Huebecker M, Brekk OR, et al. Glycosphingolipid levels and glucocerebrosidase activity are altered in normal aging of the mouse brain. Neurobiol Aging. 2018;67:189‐200. - PMC - PubMed
    1. Orvisky E, Sidransky E, McKinney CE, et al. Glucosylsphingosine accumulation in mice and patients with type 2 Gaucher disease begins early in gestation. Pediatr Res. 2000;48(2):233‐237. - PubMed
    1. Sidransky E. Gaucher disease: complexity in a "simple" disorder. Mol Genet Metab. 2004;83(1‐2):6‐15. - PubMed

Publication types

MeSH terms