Review
. 2021 Apr 7;32(4):872-894.
doi: 10.1021/jasms.0c00439. Epub 2021 Mar 3.

Spatially Resolved Mass Spectrometry at the Single Cell: Recent Innovations in Proteomics and Metabolomics

Affiliations
Review

Spatially Resolved Mass Spectrometry at the Single Cell: Recent Innovations in Proteomics and Metabolomics

Michael J Taylor et al. J Am Soc Mass Spectrom. .

Abstract

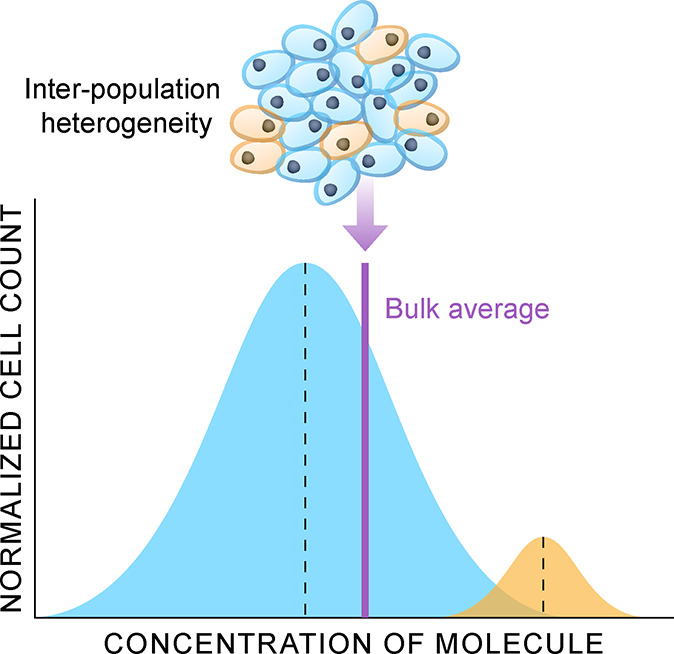
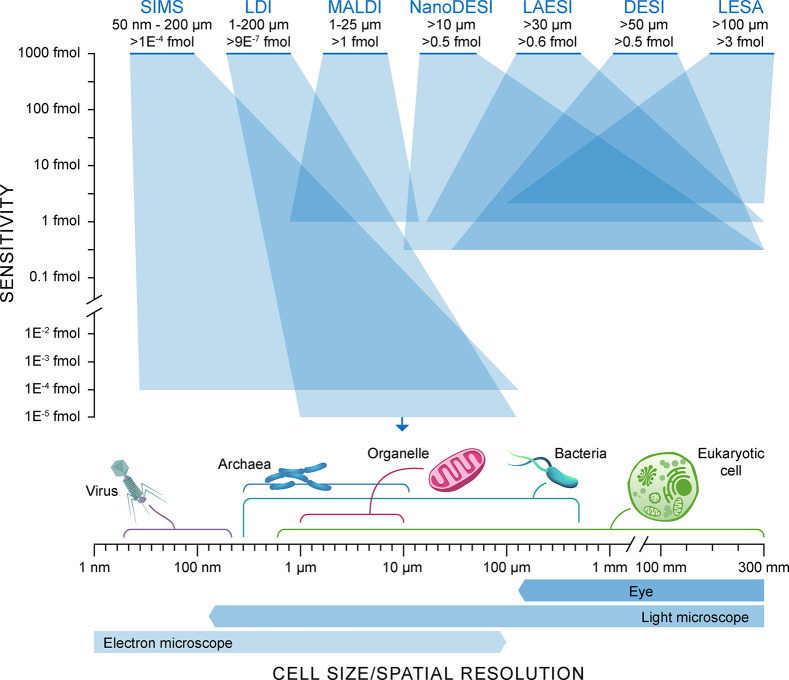
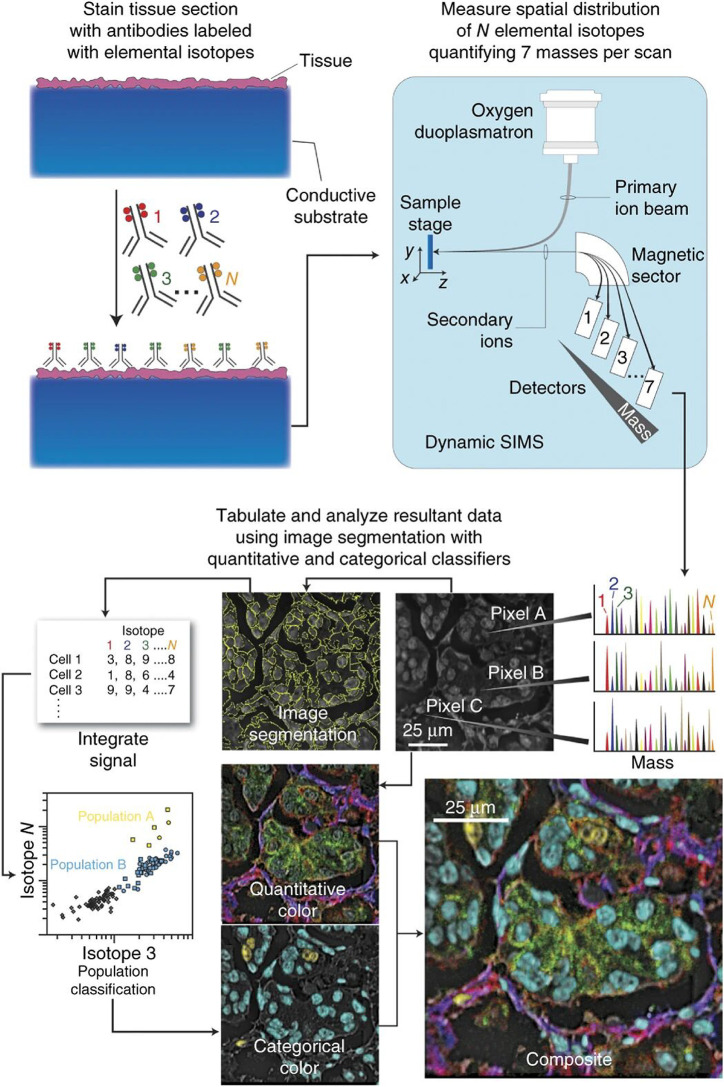
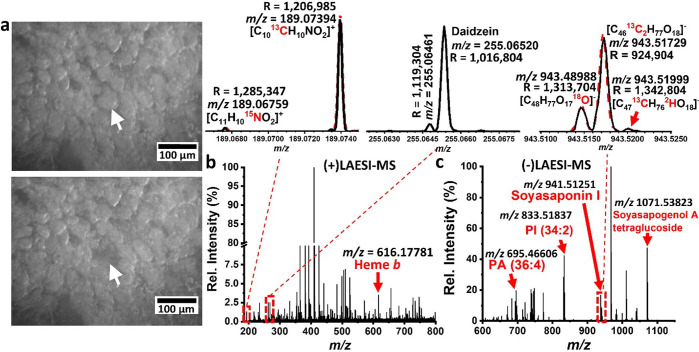
Biological systems are composed of heterogeneous populations of cells that intercommunicate to form a functional living tissue. Biological function varies greatly across populations of cells, as each single cell has a unique transcriptome, proteome, and metabolome that translates to functional differences within single species and across kingdoms. Over the past decade, substantial advancements in our ability to characterize omic profiles on a single cell level have occurred, including in multiple spectroscopic and mass spectrometry (MS)-based techniques. Of these technologies, spatially resolved mass spectrometry approaches, including mass spectrometry imaging (MSI), have shown the most progress for single cell proteomics and metabolomics. For example, reporter-based methods using heavy metal tags have allowed for targeted MS investigation of the proteome at the subcellular level, and development of technologies such as laser ablation electrospray ionization mass spectrometry (LAESI-MS) now mean that dynamic metabolomics can be performed in situ. In this Perspective, we showcase advancements in single cell spatial metabolomics and proteomics over the past decade and highlight important aspects related to high-throughput screening, data analysis, and more which are vital to the success of achieving proteomic and metabolomic profiling at the single cell scale. Finally, using this broad literature summary, we provide a perspective on how the next decade may unfold in the area of single cell MS-based proteomics and metabolomics.

Keywords: DESI; LAESI; LDI; MALDI; NanoDESI; SIMS; high-throughput omics; mass spectrometry imaging.


Conflict of interest statement

The authors declare no competing financial interest.

Figures

Figure 1
Figure 1
Illustration of how physiological state heterogeneity occurring across a cell population within a sample may not be resolved by bulk omics measurements (purple line). In this example, two discrete subpopulations of cells can be resolved by measuring each cell, which will resolve the predominate cell population (blue) from a minor cell population (yellow).
Figure 2
Figure 2
Representation of the techniques available for MS-based spatial metabolomics and proteomics. The range of sensitivities in femtomoles (y-axis) is compared against the spatial resolution range (x-axis) for these spatial-MS approaches. The spatial dynamic range is illustrated by the transparent blue boxes. Cell size dimensions and the lateral resolution of other structural imaging techniques are displayed along the x-axis for comparison.
Figure 3
Figure 3
Multiplexed ion beam imaging workflow for high-resolution spatial proteomics. Here, preserved tissue sections are mounted on conductive substrates and incubated with unique isotopic transition metal-tagged antibody reporters. An oxygen primary ion beam rasters the sample surface, ejecting and ionizing the isotope reporters, and their masses are subsequently measured via a mass analyzer. In this example, MIBI analysis of human breast tissue displaying multichannel overlays, where each color represents a separate protein specific reporter. Adapted with permission from ref (82). 2014 Nature Research.
Figure 4
Figure 4
Example single cell imaging results from TG-MALDI-2 in the analysis of Vero-B4 cell culture: (a) Bright-field microscopy image of Vero B cells with deposited DHB matrix; (b) background (m/z = 633.042) and (c–e) single ion images of PE (36:2), PC (34:1), and PC (34:1). (f) High resolution bright-field microscopy image of highlighted red region in a, and (g) overlay of ion images in b, c, and e. (h) in-line bright-field microscopy image from the TG-MALDI-2 source outlined region in f. Adapted with permission from ref (140). 2019 Nature Research.
Figure 5
Figure 5
Example of f-LAESI analysis using a 21T-FTICR-MS. Here, single soybean root nodule cells infected with B. japonicum were analyzed. (a) Identification and ablation of an infected soybean cell and (b, c) the resulting mass spectra data from positive- and negative-ion modes, respectively. The top left inset shows the captured IFS (black) for N-acetylglutamic acid overlaid on top of its simulated mass spectrum (red dashed line). The middle inset shows the resolving of two peaks that correspond to two different metabolites. The top right inset shows the IFS of dehydrosoyasaponin I (black) captured at a longer transient length. The peaks drawn with a red dashed line correspond to the simulated mass spectrum of the same ion. Adapted from ref (159).
Figure 6
Figure 6
Example of TOF-SIMS subcellular imaging, where the distribution of a drug is visualized in a single cell using the hybrid OrbiSIMS. (a) A sequence of total ion images captured every ∼400 nm of depth, as the cell was sputtered away. (b) Overlaid ion images of the PC headgroup in gray, m/z 157 (a nuclear marker) in magenta, and the drug (amiodarone) in green at each of the respective spatial locations in a, and (c) a 3D rendering of the cell that tomographically illustrates the location of PC, nucleus, and drug markers. Mass spectrum obtained from the ToF-MS (black) and the Orbitrap-MS (blue) of the (d) PC headgroup and (e) nuclear marker. Adapted with permission from ref (215). 2017 Nature Research.
Figure 7
Figure 7
Example of near-single cell untargeted proteomic analysis using nanoPOTS, which is adaptable method for high-throughput single cell screening applications. (a) Bright-field images of nanowells with dispersed HeLa cells in droplets. (b) Ion chromatograms corresponding to analysis of 12, 42, and 139 cells and (c–f) the unique peptides and protein group coverage from nanoPOTS processing of different liquid volumes. Data are expressed as means ± SD for experimental triplicates, and the scale bar in (a) is 500 μm. Adapted with permission from ref (75). 2018 Nature Research.
Figure 8
Figure 8
Automated parallel mass spectrometry imaging approach that provides high-confidence molecular structural identification. Here, (a) lipid classes and unique lipids were identified within the cerebellum of a rat brain. (b) Number of automatically assigned lipids using the ALEX framework and high-resolution FT-MS/MS in comparison to the number validated assignments from parallel MS/MS data and the (c) validated IDs across the different lipid classes. (d–h) Example single MS ion images of the different validated lipid species detected in (i) comparison to the H&E-stained tissue section. Adapted with permission from ref (298). 2018 Nature Research.

Similar articles

Cited by

References

    1. Zhu C.; Preissl S.; Ren B. Single-Cell Multimodal Omics: The Power of Many. Nat. Methods 2020, 17 (1), 11–14. 10.1038/s41592-019-0691-5. - DOI - PubMed
    1. Gemperline E.; Keller C.; Li L. Mass Spectrometry in Plant-Omics. Anal. Chem. 2016, 88 (7), 3422–3434. 10.1021/acs.analchem.5b02938. - DOI - PubMed
    1. Boughton B. A.; Thinagaran D.; Sarabia D.; Bacic A.; Roessner U. Mass Spectrometry Imaging for Plant Biology: A Review. Phytochem. Rev. 2016, 15 (3), 445–488. 10.1007/s11101-015-9440-2. - DOI - PMC - PubMed
    1. Gerber S. A.; Rush J.; Stemman O.; Kirschner M. W.; Gygi S. P. Absolute Quantification of Proteins and Phosphoproteins from Cell Lysates by Tandem MS. Proc. Natl. Acad. Sci. U. S. A. 2003, 100 (12), 6940–6945. 10.1073/pnas.0832254100. - DOI - PMC - PubMed
    1. Ankrah N. Y. D.; May A. L.; Middleton J. L.; Jones D. R.; Hadden M. K.; Gooding J. R.; LeCleir G. R.; Wilhelm S. W.; Campagna S. R.; Buchan A. Phage Infection of an Environmentally Relevant Marine Bacterium Alters Host Metabolism and Lysate Composition. ISME J. 2014, 8 (5), 1089–1100. 10.1038/ismej.2013.216. - DOI - PMC - PubMed

LinkOut - more resources