. 2021 Mar 3;17(3):e1008811.
doi: 10.1371/journal.pcbi.1008811. eCollection 2021 Mar.

Bridging the gap: Using reservoir ecology and human serosurveys to estimate Lassa virus spillover in West Africa

Affiliations

Bridging the gap: Using reservoir ecology and human serosurveys to estimate Lassa virus spillover in West Africa

Andrew J Basinski et al. PLoS Comput Biol. .

Abstract

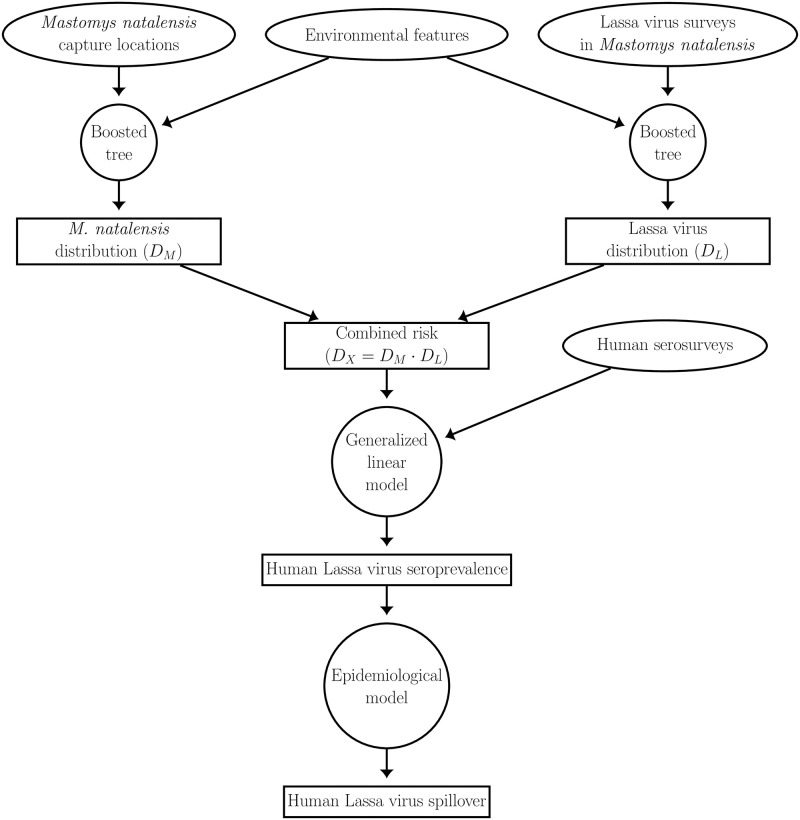
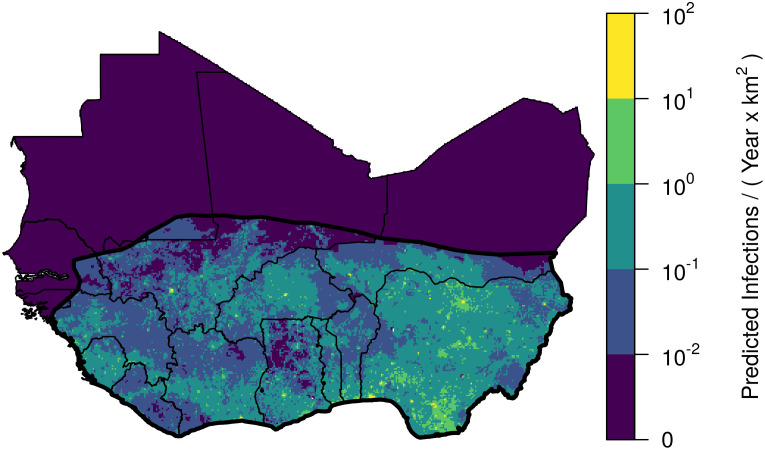
Forecasting the risk of pathogen spillover from reservoir populations of wild or domestic animals is essential for the effective deployment of interventions such as wildlife vaccination or culling. Due to the sporadic nature of spillover events and limited availability of data, developing and validating robust, spatially explicit, predictions is challenging. Recent efforts have begun to make progress in this direction by capitalizing on machine learning methodologies. An important weakness of existing approaches, however, is that they generally rely on combining human and reservoir infection data during the training process and thus conflate risk attributable to the prevalence of the pathogen in the reservoir population with the risk attributed to the realized rate of spillover into the human population. Because effective planning of interventions requires that these components of risk be disentangled, we developed a multi-layer machine learning framework that separates these processes. Our approach begins by training models to predict the geographic range of the primary reservoir and the subset of this range in which the pathogen occurs. The spillover risk predicted by the product of these reservoir specific models is then fit to data on realized patterns of historical spillover into the human population. The result is a geographically specific spillover risk forecast that can be easily decomposed and used to guide effective intervention. Applying our method to Lassa virus, a zoonotic pathogen that regularly spills over into the human population across West Africa, results in a model that explains a modest but statistically significant portion of geographic variation in historical patterns of spillover. When combined with a mechanistic mathematical model of infection dynamics, our spillover risk model predicts that 897,700 humans are infected by Lassa virus each year across West Africa, with Nigeria accounting for more than half of these human infections.


Conflict of interest statement

The authors have declared that no competing interests exist.

Figures

Fig 1
Fig 1. Map of the study region.
The dashed blue line indicates the study region from which rodent and human data originate. Dots indicate locations at which Lassa virus or arenavirus antibodies have been sampled in rodents or humans. Each rodent point shows the outcome of a serological or PCR test. Each human population point shows the location of a serosurvey.
Fig 2
Fig 2. Overview of the model.
Ellipses represent datasets, circles represent models, and rectangles represent model predictions.
Fig 3
Fig 3. Calculating the combined risk layer.
(A) Map shows the likelihood that each 0.05° pixel in West Africa contains the primary reservoir of Lassa virus, M. natalensis. Pink dots indicate locations of captures that were used to train the model. Black line indicates the IUCN M. natalensis range map. (B) Predicted distribution of Lassa virus in M. natalensis. Dots indicate locations in which M. natalensis were surveyed for the virus. (C) Combined risk, defined as the product of the above two layers.
Fig 4
Fig 4. Human arenavirus seroprevalence vs the combined risk layer.
Each circle represents a different serosurvey. The size of the circle indicates the number of humans that were tested. Solid black line shows the quasi-binomial prediction of seroprevalence, and the red dashed lines show the 95% confidence intervals. Confidence intervals were obtained by fitting the model 1000 times on random samples taken from the dataset with replacement.
Fig 5
Fig 5. Predicted human seroprevalence of Lassa virus in West Africa.
Dots show locations of human serosurveys, and dot color indicates the residual of the predicted seroprevalence. White dots indicate locations for which measured seroprevalence fell within 0.1 of the prediction. Measured seroprevalence at red dots was 0.1 or more greater than that predicted, and seroprevalence at blue dots was 0.1 or more below the prediction.
Fig 6
Fig 6. Predicted spatial density of Lassa virus infections in humans.
Map shows the predicted infections per km2. Yellow colors, representing a high number of infections, tend to occur in areas with high human population density and a high predicted seroprevalence.

References

    1. Jones KE, Patel NG, Levy MA, Storeygard A, Balk D, Gittleman JL, et al.. Global trends in emerging infectious diseases. Nature. 2008;451(7181):990–993. 10.1038/nature06536 - DOI - PMC - PubMed
    1. Plowright RK, Parrish CR, McCallum H, Hudson PJ, Ko AI, Graham AL, et al.. Pathways to zoonotic spillover. Nat Rev Microbiol. 2017;15(8):502–510. 10.1038/nrmicro.2017.45 - DOI - PMC - PubMed
    1. Hughes JM, Wilson ME, Pike BL, Saylors KE, Fair JN, LeBreton M, et al.. The origin and prevention of pandemics. Clin Infect Dis. 2010;50(12):1636–1640. 10.1086/652860 - DOI - PMC - PubMed
    1. Fichet-Calvet E, Rogers DJ. Risk maps of Lassa fever in West Africa. PLoS Negl Trop Dis. 2009;3(3):e388. 10.1371/journal.pntd.0000388 - DOI - PMC - PubMed
    1. Mylne AQ, Pigott DM, Longbottom J, Shearer F, Duda KA, Messina JP, et al.. Mapping the zoonotic niche of Lassa fever in Africa. Trans R Soc Trop Med Hyg. 2015;109(8):483–492. 10.1093/trstmh/trv047 - DOI - PMC - PubMed

Publication types