. 2021 Mar 3;16(3):e0247980.
doi: 10.1371/journal.pone.0247980. eCollection 2021.

Association between meteorological factors and the prevalence dynamics of Japanese encephalitis

Affiliations

Association between meteorological factors and the prevalence dynamics of Japanese encephalitis

Taotian Tu et al. PLoS One. .

Abstract

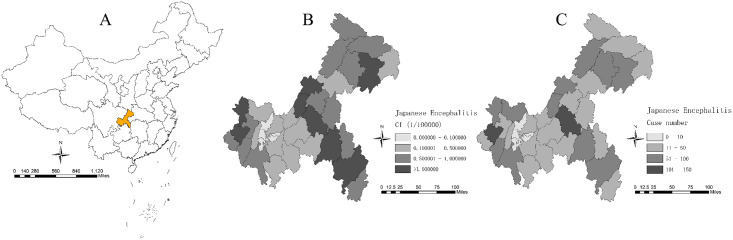
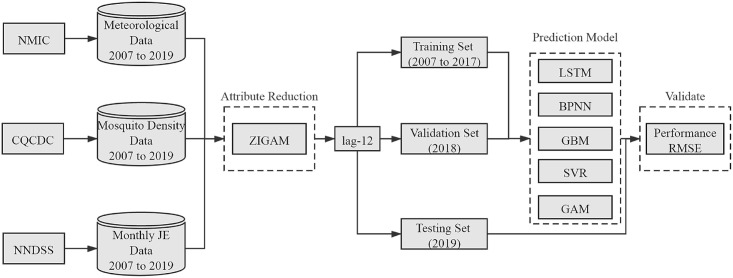
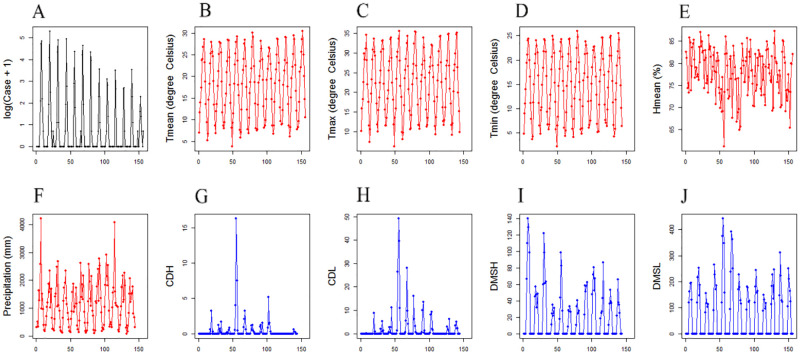
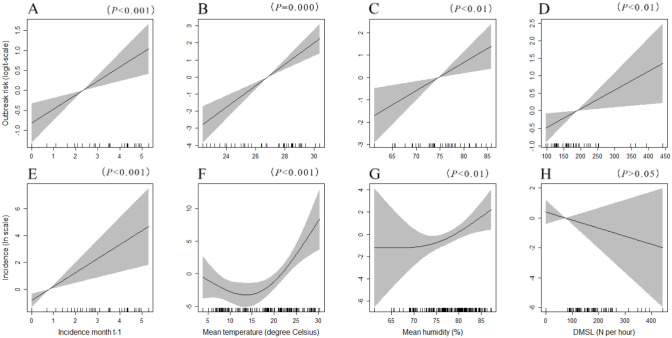
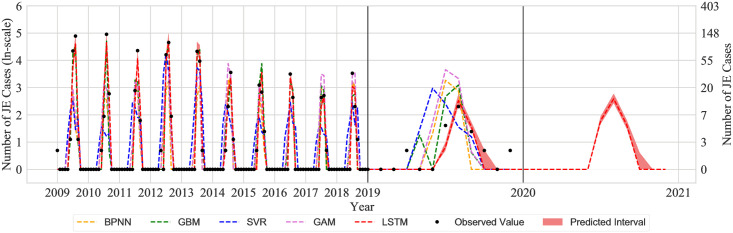
Japanese encephalitis (JE) is an acute infectious disease caused by the Japanese encephalitis virus (JEV) and is transmitted by mosquitoes. Meteorological conditions are known to play a pivotal role in the spread of JEV. In this study, a zero-inflated generalised additive model and a long short-term memory model were used to assess the relationship between the meteorological factors and population density of Culex tritaeniorhynchus as well as the incidence of JE and to predict the prevalence dynamics of JE, respectively. The incidence of JE in the previous month, the mean air temperature and the average of relative humidity had positive effects on the outbreak risk and intensity. Meanwhile, the density of all mosquito species in livestock sheds (DMSL) only affected the outbreak risk. Moreover, the region-specific prediction model of JE was developed in Chongqing by used the Long Short-Term Memory Neural Network. Our study contributes to a better understanding of the JE dynamics and helps the local government establish precise prevention and control measures.


Conflict of interest statement

The authors have declared that no competing interests exist.

Figures

Fig 1
Fig 1. Spatial distribution of the study area and Japanese encephalitis (JE) cases.
(A) The location is in Chongqing, China. (B) Spatial distribution of JE cases at the county level from 2007 to 2019 in Chongqing. (C) Cumulative incidence (CI) of JE cases at the county level from 2007 to 2019 in Chongqing.
Fig 2
Fig 2. Summarized workflow for the construction of the LSTM-based forecasting model for JE cases and its comparison with other candidate models.
NMIC: National Meteorological Information Center; CQCDC: Chongqing Center for Disease Control and Prevention; NNDSS: National Notifiable Disease Surveillance System; BPNN: Back Propagation Neural Network; GBM: Gradient Boosting Machine; SVR: Support Vector Regression; GAM: Generalized Additive Model.
Fig 3
Fig 3. Monthly time series plots in Chongqing from 2007 to 2019.
Monthly time series of the JE incidence (A), the mean air temperature (B), the maximum air temperature (C), the minimum air temperature (D), the average of relative humidity (E), the precipitation (F), the C. tritaeniorhynchus density in human houses (CDH) (G), the C. tritaeniorhynchus density in livestock sheds (CDL) (H), the density of all mosquito species in human houses (DMSH) (I) and the density of all mosquito species in livestock sheds (DMSL) (J) respectively.
Fig 4
Fig 4. Analysis of potentially non-linear influences on the incidence of JE in Chongqing based on data from 2007–2019.
In order to explain the zero inflation, (A) − (D) depict a separate binomial sub-model that quantifies predictor effects on the outbreak risk (logit-scale probability of incidence > 0) and (E) − (H) depict a lognormal sub-model that quantifies predictor effects on the outbreak intensity when an outbreak occurs [ln(incidence)].
Fig 5
Fig 5. Time series of the incidence of JE in Chongqing.
Data from 2008–2017 were used to train the LSTM model, data from 2018 were used as validation set and data from 2019 were utilised for model testing. In the figure, the observed values are represented by the black point, the predicted values of BPNN are represented by yellow line, the predicted values of GBM are represented by green line, the predicted values of SVR are represented by blue line, the predicted values of GAM are represented by purple line, the predicted values of LSTM are represented by red lines and the predicted interval of LSTM is represented by a light red area.

Similar articles

Cited by

References

    1. Campbell GL, Hills SL, Fischer M, Jacobson JA, Hoke CH, Hombach JM, et al.. Estimated global incidence of Japanese encephalitis: A systematic review. Bull World Health Organ. 2011;89(10):766–74. 10.2471/BLT.10.085233 - DOI - PMC - PubMed
    1. Erlanger TE, Weiss S, Keiser J, Utzinger J, Wiedenmayer K. Past, present, and future of Japanese Encephalitis. Emerg Infect Dis. 2009;15(1):1–7. 10.3201/eid1501.080311 - DOI - PMC - PubMed
    1. Kumar P, Pisudde PM, Sarthi PP, Sharma MP, Keshri VR. Status and trend of acute encephalitis syndrome and Japanese encephalitis in Bihar, India. Natl Med J India. 2017;30(6):317–20. 10.4103/0970-258X.239070 - DOI - PubMed
    1. Gao XY, Nasci R, Liang GD. The neglected arboviral infections in mainland China. PLoS Negl Trop Dis. 2010;4(4):e624. 10.1371/journal.pntd.0000624 - DOI - PMC - PubMed
    1. Zheng YY, Li MH, Wang HY, Liang GD. Japanese encephalitis and Japanese encephalitis virus in mainland China. Rev Med Virol. 2012;22(5):301–22. 10.1002/rmv.1710 - DOI - PubMed

Publication types

LinkOut - more resources