. 2021 May 13;137(19):2609-2620.
doi: 10.1182/blood.2020005517.

Prolonged maintenance of hematopoietic stem cells that escape from thrombopoietin deprivation

Affiliations

Prolonged maintenance of hematopoietic stem cells that escape from thrombopoietin deprivation

Ayako Nakamura-Ishizu et al. Blood. .

Abstract

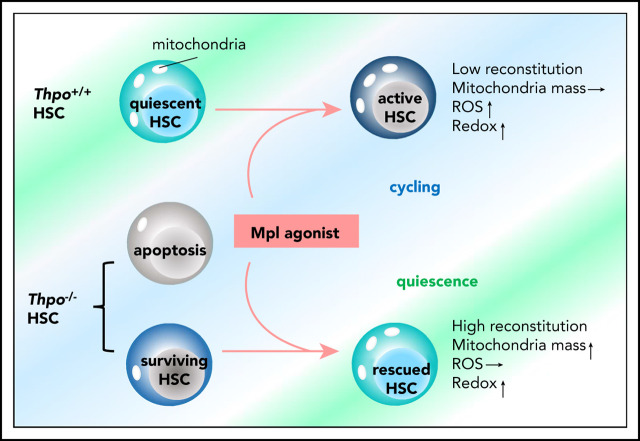
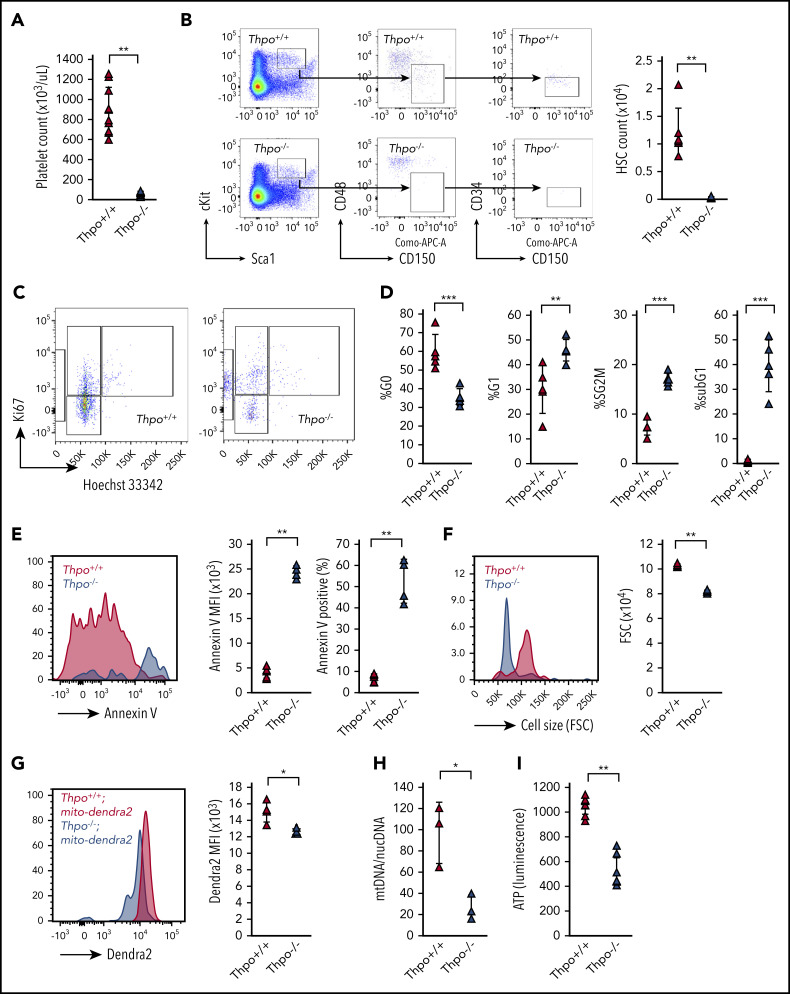
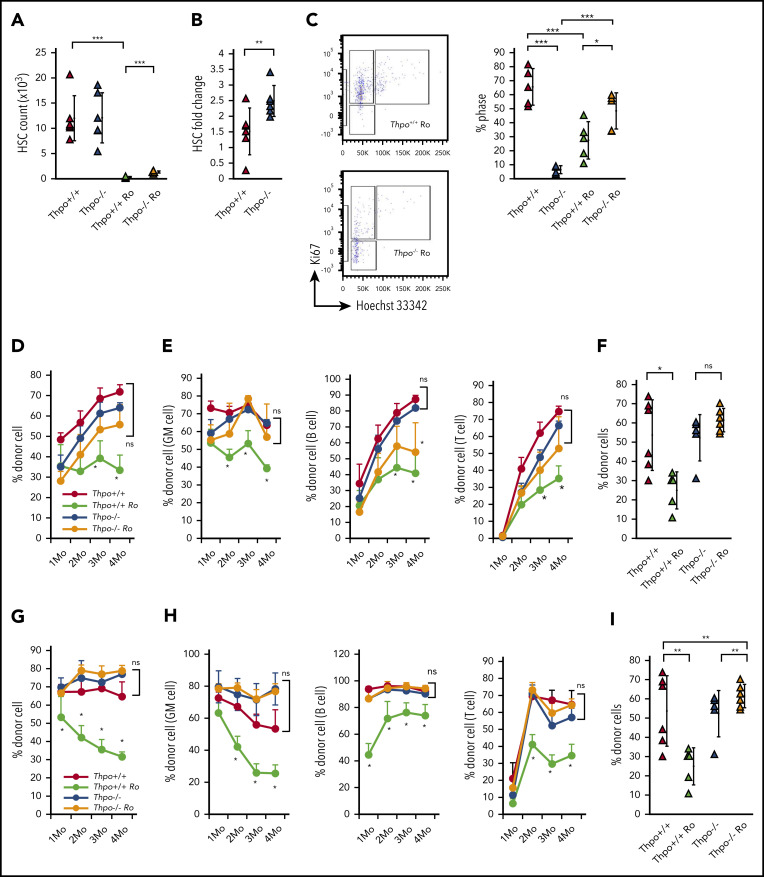
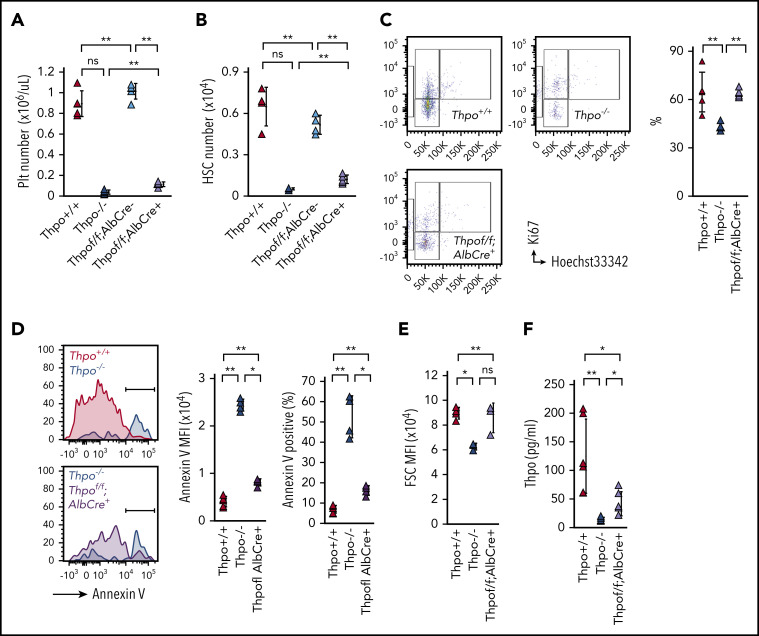
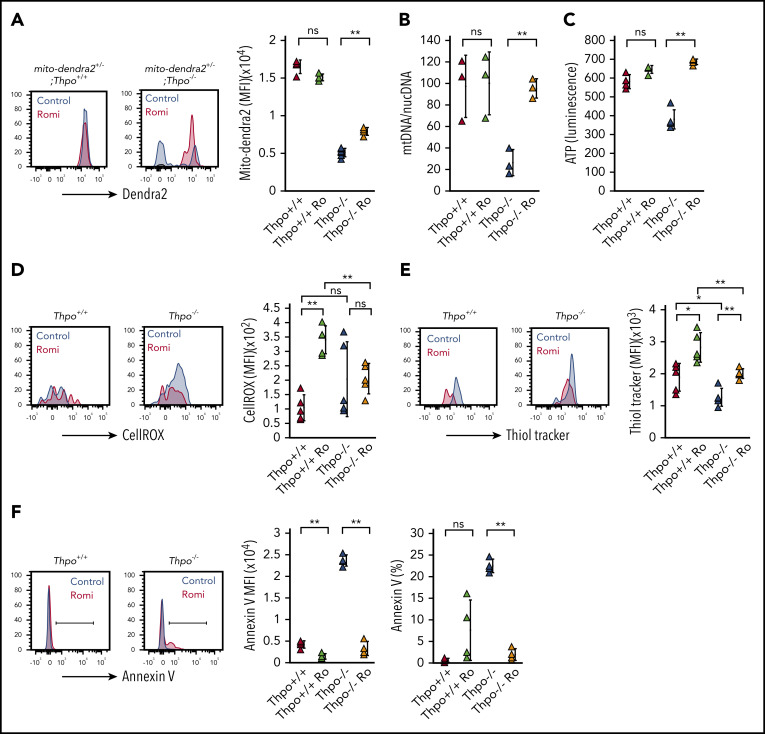
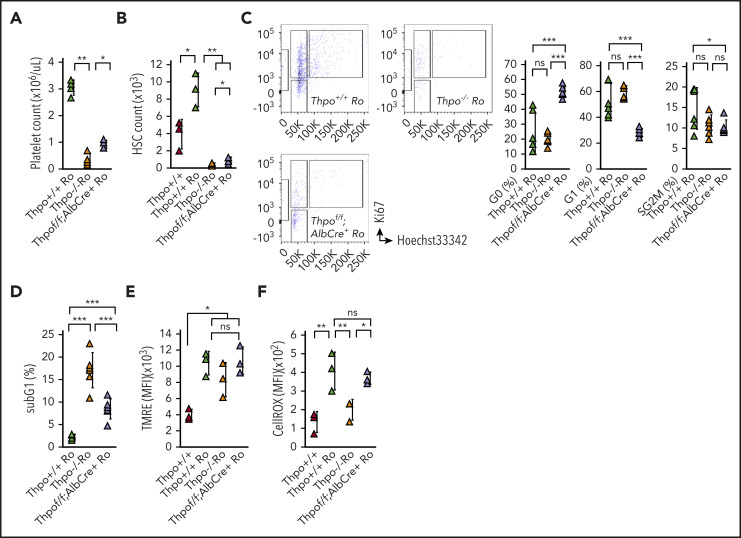
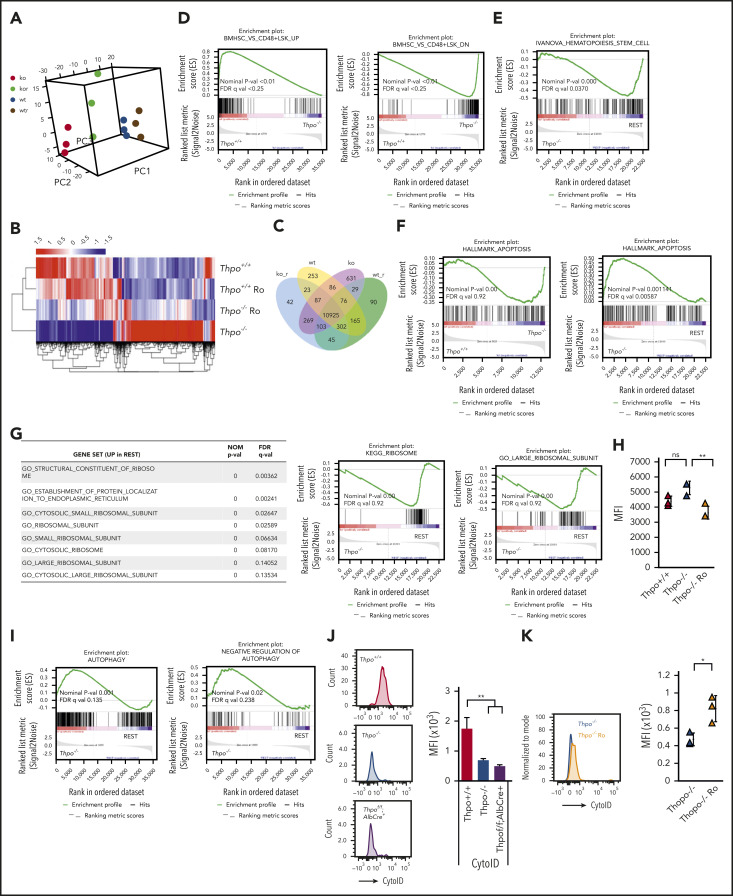
Hematopoietic stem cells (HSC) rarely divide, rest in quiescence, and proliferate only upon stress hematopoiesis. The cytokine thrombopoietin (Thpo) has been perplexingly described to induce quiescence and promote self-renewal divisions in HSCs. To clarify the contradictory effect of Thpo, we conducted a detailed analysis on conventional (Thpo-/-) and liver-specific (Thpofl/fl;AlbCre+/-) Thpo-deletion models. Thpo-/- HSCs exhibited profound loss of quiescence, impaired cell cycle progression, and increased apoptosis. Thpo-/- HSCs also exhibited diminished mitochondrial mass and impaired mitochondrial bioenergetics. Abnormal HSC phenotypes in Thpo-/- mice were reversible after HSC transplantation into wild-type recipients. Moreover, Thpo-/- HSCs acquired quiescence with extended administration of a Thpo receptor agonist, romiplostim, and were prone to subsequent stem cell exhaustion during competitive bone marrow transplantation. Thpofl/fl;AlbCre+/- HSCs exhibited similar stem cell phenotypes but to a lesser degree compared with Thpo-/- HSCs. HSCs that survive Thpo deficiency acquire quiescence in a dose-dependent manner through the modification of their metabolic state.


Figures

None
Graphical abstract
Figure 1.
Figure 1.
Thpo deficiency inhibits cell cycle progression, induces apoptosis, and impairs mitochondrial function in HSCs. (A) PB platelet counts in Thpo+/+ and Thpo−/− mice (n > 5). (B) Representative flow cytometric plot of BM HSCs (Lin- cKit+ Sca1+ CD48 CD150+ CD34) and quantification of BM HSC number in Thpo+/+ and Thpo−/− mice (n > 5). (C) Representative flow cytometric plot of cell cycle analysis of Thpo+/+ and Thpo−/− HSCs using Ki-67 and Hoechst 33342 staining. (D) Frequency of cell cycle states (G0, G1, S/G2/M and subG1) in Thpo+/+ and Thpo−/− HSCs (n = 4). (E) Representative flow cytometric plot and quantification (mean fluorescence intensity [MFI]) and percentage of positively gated cells) of Annexin V staining in Thpo+/+ and Thpo−/− HSCs (n = 4). (F) Representative flow cytometric plot and MFI of FSC parameter in Thpo+/+ and Thpo−/− HSCs (n = 4). (G) Representative flow cytometric plot and MFI of dendra2 fluorescence in Thpo+/+;mito-dendra2+/− and Thpo−/−;mito-dendra2+/− HSCs (n = 4). (H) Ratio of mitochondrial DNA (mtDNA)/nuclear DNA (nucDNA) quantified using qPCR in Thpo+/+ and Thpo−/− HSCs (n = 4). (I) ATP content measured in luminescence of Thpo+/+ and Thpo−/− HSCs (n > 5). *P < .05, **P < .01, ***P < .001, Student t test (A-B,E-I), Fisher’s least significant difference test (D).
Figure 2.
Figure 2.
Stem cell phenotype of HSCs from Thpo−/− mice is reversible. (A) PB platelet count fold change in Thpo+/+, Thpo−/−, Thpo+/+ Ro, and Thpo−/− Ro mice (n > 5). (B) Fold change in HSC number in BM (2 femurs and 2 tibias) of Thpo+/+, Thpo−/− with romiplostim treatment. (C) Representative flow cytometric plot of cell cycle analysis Thpo+/+ Ro and Thpo−/− Ro HSCs and percentage of HSCs in the G0 stage in Thpo+/+, Thpo−/−, Thpo+/+ Ro, and Thpo−/− Ro HSCs. (D-F) Primary competitive BM transplantation of 500 HSCs isolated from Thpo+/+, Thpo−/−, Thpo+/+ Ro, or Thpo−/− Ro mice (n = 5). (D) PB chimerism of total mononuclear cells. (E) PB chimerism of GM cells (Mac1+ Gr1+), B cells (B220+), and T cells (CD4+ CD8+). (F) BM chimerism of HSCs (Lin cKit+ Sca1+ CD48- CD150+ CD34). (G-I) Secondary competitive BM transplantation of 2 × 10⁶ BM mononuclear cells isolated from recipients of primary BM transplantation. (G) PB chimerism of total mononuclear cells (n = 5). (H) PB chimerism of GM cells, B cells, and T cells (n = 5). (I) BM chimerism of HSCs (n = 5). *P < .05, **P < .01, Student t test (A-B), Fisher’s least significant difference test (C), Tukey test (D-I).
Figure 3.
Figure 3.
HSC phenotype is mitigated in Thpofl/fl;AlbCre+/− knockout mice. (A-B) PB platelet (Plt) counts (A) and BM HSC number (per femur) (B) in Thpo+/+, Thpo−/−, Thpofl/fl;AlbCre−/− Thpofl/fl;AlbCre+/−, and mice (n > 5). (C) Representative flow cytometric plot of cell cycle analysis and quantification of percentage of HSCs in the G0 phase of Thpo+/+, Thpofl/fl;AlbCre+/−, and Thpo−/− mice (n > 5). (D) Representative flow cytometric plot and quantification (mean fluorescence intensity [MFI] and percentage of positively gated cells) of Annexin V staining in Thpo+/+, Thpofl/fl;AlbCre+/−, and Thpo−/− HSCs (n = 4). (E) MFI of FSC parameter in Thpo+/+, Thpofl/fl;AlbCre+/−, and Thpo−/− HSCs (n = 4). (F) Thpo concentration in blood plasma of Thpo+/+, Thpofl/fl;AlbCre+/−, and Thpo−/− mice (n > 5). *P < .05, **P < .01, Tukey test (A-B,D-F), Fisher’s least significant difference test (C).
Figure 4.
Figure 4.
HSCs from Thpo−/− mice exhibit attenuated oxidative stress upon romiplostim administration. (A) Representative plots and mean fluorescence intensity (MFI) of dendra2 fluorescence expressed in HSCs from mito-dendra2+/−;Thpo+/+ and mito-dendra2+/−;Thpo−/− mice, with or without administration of romiplostim (n = 5). (B) Ratio of mitochondrial DNA (mtDNA)/nuclear DNA (nucDNA) quantified by qPCR in Thpo+/+, Thpo−/−, Thpo+/+ Ro, and Thpo−/− Ro HSCs (n = 4). (C) ATP content measured in luminescence of Thpo+/+, Thpo−/−, Thpo+/+ Ro and Thpo−/− Ro HSCs (n > 5). Representative plots and MFI of CellROX staining (D) and ThiolTracker staining (E) in Thpo+/+, Thpo−/−, Thpo+/+ Ro, and Thpo−/− Ro HSCs (n = 5). (F) Representative flow cytometric plot, MFI, and percentage of positively gated cells based on Annexin V staining in Thpo+/+, Thpo−/−, Thpo+/+ Ro, and Thpo−/− Ro HSCs (n = 4). *P < .05, **P < .01, Student t test.
Figure 5.
Figure 5.
Rapid response of HSCs from Thpofl/fl;AlbCre+/− mice to romiplostim. Romiplostim was administered IV to Thpo+/+, Thpofl/fl;AlbCre+/−, and Thpo−/− mice for 5 consecutive days. (A) PB platelet count in Thpo+/+, Thpofl/fl;AlbCre+/− and Thpo−/− mice treated with romiplostim (Thpo+/+ Ro, Thpofl/fl;AlbCre+/− Ro, and Thpo−/− Ro) (n = 5). (B) BM HSC number in Thpo+/+, Thpo+/+ Ro, Thpofl/fl;AlbCre+/− Ro, and Thpo−/− Ro mice (n = 5). (C) Representative flow cytometric plot and percentage of G0, G1, and S/G2/M HSCs in Thpo+/+ Ro, Thpofl/fl;AlbCre+/− Ro, and Thpo−/− Ro mice (n = 5). (D) Percentage of subG1 HSCs in Thpo+/+ Ro, Thpofl/fl;AlbCre+/− Ro, and Thpo−/− Ro mice (n = 5). Mean fluorescence intensity (MFI) of tetramethylrhodamine, ethyl ester staining (TMRE) (E) and CellROX staining (F) in Thpo+/+,Thpo+/+ Ro, Thpofl/fl;AlbCre+/− Ro, and Thpo−/− Ro mice (n = 5). *P < .05, **P < .01, ***P < .001. Student t test (A-B,D-F), Fisher’s least significant difference test (C).
Figure 6.
Figure 6.
Thpo deficiency broadly impairs organelle function and turnover. (A-C) Principal component analysis of RNA sequence on Thpo+/+ (wt), Thpo−/− (ko), Thpo+/+ Ro (wtr), and Thpo−/− Ro (kor) HSCs. Heat map analysis (B) and Venn diagram (C) for differentially expressed genes in Thpo+/+ (wt), Thpo−/− (ko), Thpo+/+ Ro (wtr), and Thpo−/− Ro (kor) HSCs. (D) Gene set enrichment analysis (GSEA) analysis of HSC- and progenitor-related gene sets in Thpo+/+ and Thpo−/− HSCs. (E) GSEA analysis for enrichment in HSC-related gene set for Thpo−/− and REST (Thpo+/+, Thpo+/+ Ro, and Thpo−/− Ro HSCs). (F) GSEA analysis of apoptosis-related gene set for Thpo+/+, Thpo−/−, and REST HSCs. (G) Table and GSEA plots showing enrichment in ribosome-associated gene sets upregulated in REST compared with Thpo−/− HSCs. (H) Mean fluorescence intensity (MFI) of OPP incorporation in Thpo+/+, Thpo−/−, and Thpo−/− Ro HSCs (n = 5). (I) Analysis of autophagy-related gene set enrichment in Thpo−/− and REST HSCs. (J) Representative plots and MFI of Cyto-ID staining in Thpo+/+, Thpofl/fl;AlbCre+/−, and Thpo−/− HSCs (n = 5). (K) Representative plot and MFI of Cyto-ID staining in Thpo−/− and Thpo−/− Ro HSCs (n = 5). *P < .05, **P < .01, Student t test. FDR, false discovery rate; NOM, nominal; p-val, P value; q-val, q value.

Similar articles

Cited by

References

    1. Wilson A, Laurenti E, Oser G, et al. Hematopoietic stem cells reversibly switch from dormancy to self-renewal during homeostasis and repair. Cell. 2008;135(6):1118-1129. - PubMed
    1. Cheshier SH, Morrison SJ, Liao X, Weissman IL. In vivo proliferation and cell cycle kinetics of long-term self-renewing hematopoietic stem cells. Proc Natl Acad Sci USA. 1999;96(6):3120-3125. - PMC - PubMed
    1. Foudi A, Hochedlinger K, Van Buren D, et al. Analysis of histone 2B-GFP retention reveals slowly cycling hematopoietic stem cells. Nat Biotechnol. 2009;27(1):84-90. - PMC - PubMed
    1. Walter D, Lier A, Geiselhart A, et al. Exit from dormancy provokes DNA-damage-induced attrition in haematopoietic stem cells. Nature. 2015;520(7548):549-552. - PubMed
    1. Nakamura-Ishizu A, Takizawa H, Suda T. The analysis, roles and regulation of quiescence in hematopoietic stem cells. Development. 2014;141(24):4656-4666. - PubMed

Publication types

MeSH terms