. 2021 May;27(5):1330-1342.
doi: 10.3201/eid2705.204949. Epub 2021 Mar 3.

Prevalence and Clinical Profile of Severe Acute Respiratory Syndrome Coronavirus 2 Infection among Farmworkers, California, USA, June-November 2020

Collaborators

Prevalence and Clinical Profile of Severe Acute Respiratory Syndrome Coronavirus 2 Infection among Farmworkers, California, USA, June-November 2020

Joseph A Lewnard et al. Emerg Infect Dis. 2021 May.

Abstract

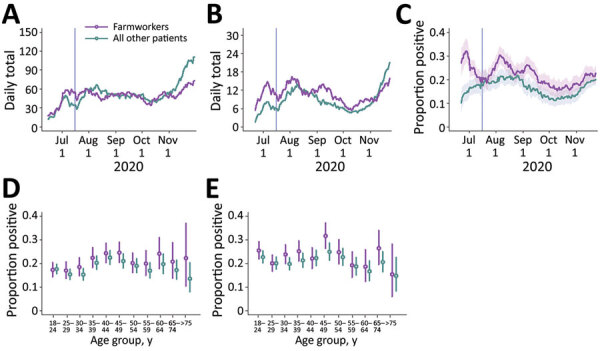
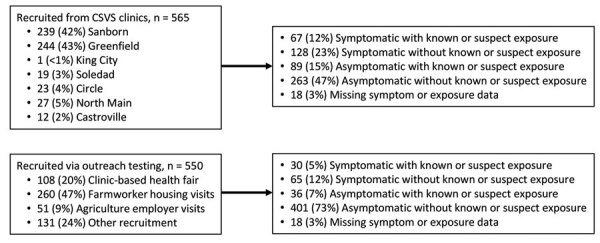
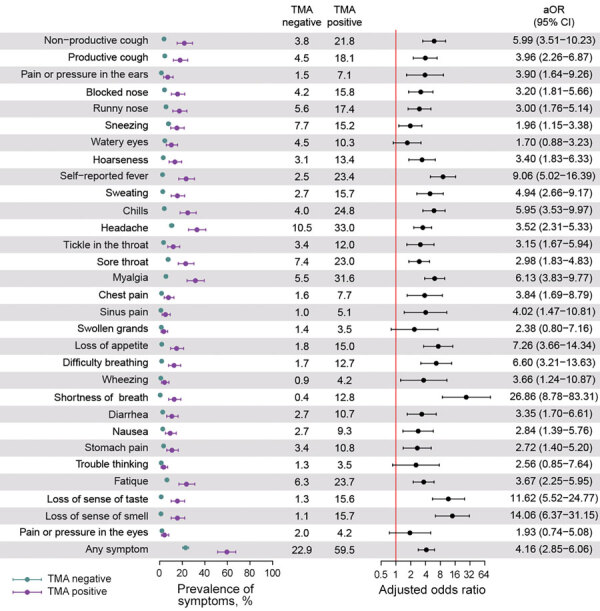
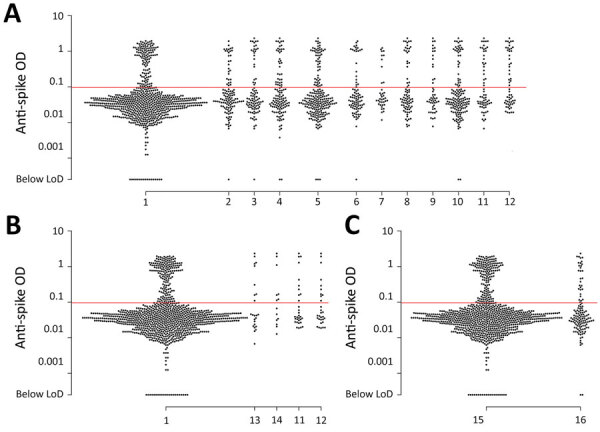
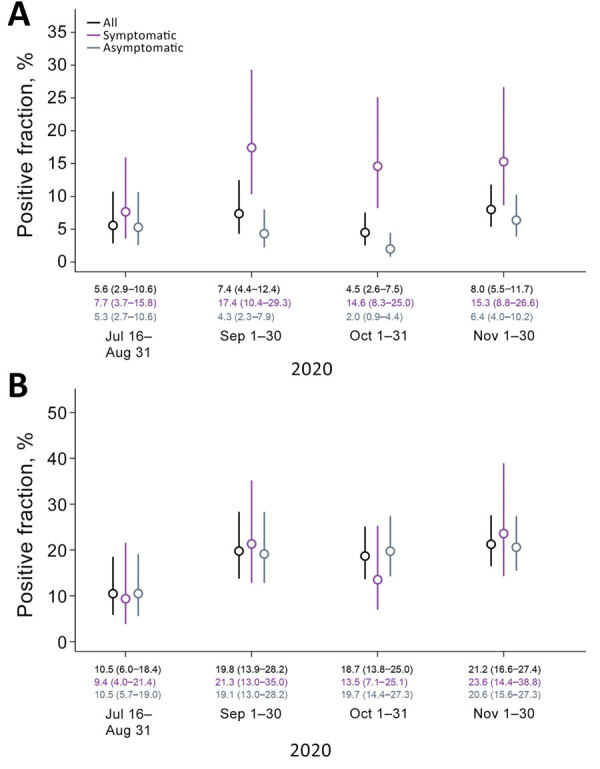
During the ongoing coronavirus disease (COVID-19) pandemic, farmworkers in the United States are considered essential personnel and continue in-person work. We conducted prospective surveillance for severe acute respiratory syndrome coronavirus 2 (SARS-CoV-2) infection and antibody prevalence among farmworkers in Salinas Valley, California, during June 15-November 30, 2020. We observed 22.1% (1,514/6,864) positivity for SARS-CoV-2 infection among farmworkers compared with 17.2% (1,255/7,305) among other adults from the same communities (risk ratio 1.29, 95% CI 1.20-1.37). In a nested study enrolling 1,115 farmworkers, prevalence of current infection was 27.7% among farmworkers reporting >1 COVID-19 symptom and 7.2% among farmworkers without symptoms (adjusted odds ratio 4.16, 95% CI 2.85-6.06). Prevalence of SARS-CoV-2 antibodies increased from 10.5% (95% CI 6.0%-18.4%) during July 16-August 31 to 21.2% (95% CI 16.6%-27.4%) during November 1-30. High SARS-CoV-2 infection prevalence among farmworkers underscores the need for vaccination and other preventive interventions.

Keywords: COVID-19; California; SARS; SARS-CoV-2; Salinas Valley; United States; coronavirus; coronavirus disease; essential workers; farmworkers; infection prevalence; respiratory infections; serosurvey; severe acute respiratory syndrome coronavirus 2; viruses; zoonoses.


Figures

Figure 1
Figure 1
Cases of severe acute respiratory syndrome coronavirus 2 (SARS-CoV-2) diagnosed at Clínica de Salud del Valle de Salinas (CSVS), Monterey County, California, USA, June 15–November 30, 2020. We plotted the 2-week moving averages of the number of patients tested by CSVS (A); the number of SARS-CoV-2 infections diagnosed (B); and the proportion of tests yielding positive results (C). Shading indicates 95% CIs. Vertical lines indicate the date the cross-sectional study began, July 16. We also plotted age- and sex- stratified test-positive fractions for female (D) and male (E) patients. Bars indicate ranges; circles indicate medians.
Figure 2
Figure 2
Participants recruited into the cross-sectional study of coronavirus disease (COVID-19) among farmworkers, Monterey County, California, USA, July 16–November 30, 2020. Number of farmworkers recruited at each participating CSVS clinic and outreach venues in the community. Number and proportion of participants reporting symptoms or exposure to known or suspected COVID-19 cases during the prior 2 weeks for both the clinic-based and outreach samples. CSVS, Clínica de Salud del Valle de Salinas.
Figure 3
Figure 3
Association of symptoms and current TMA-positive severe acute respiratory syndrome coronavirus 2 (SARS-CoV-2) infection in cross-sectional study of farmworkers, Monterey County, California, USA, July 16–November 30, 2020. Illustration of the prevalence of each symptom during the 2 weeks preceding testing among persons who tested positive and negative for SARS-CoV-2 infection via TMA and the aOR conveying the association of each symptom with current infection. We used logistic regression to determine aORs, controlling for age group, sex, and recruitment venue (i.e., clinic-based or outreach sample). Bars denote 95% CIs around point estimates (circles). aOR, adjusted odds ratio; TMA, transcription-mediated amplification nucleic acid assay.
Figure 4
Figure 4
Scatter plot of anti-spike IgG reactivity and association with recalled coronavirus disease (COVID-19) symptoms in a cross-sectional study of farmworkers, Monterey County, California, USA, July 16–November 30, 2020. A) Reactivity among persons who reported experiencing or not experiencing various symptoms potentially associated with COVID-19 since December 2019: 1, none of the symptoms listed here; 2, blocked nose (p = 0.027); 3, sweating (p = 0.010); 4, chills (p = 0.013); 5, headache (p = 0.034); 6, tickling in throat (p = 0.029); 7, sinus pain or pressure (p = 0.034); 8, loss of appetite (p<0.001); 9, shortness of breath (p = 0.006); 10, fatigue (p = 0.032); 11, loss of taste (p<0.001); 12, loss of smell (p<0.001). B) Reactivity among persons who reported experiencing or not experiencing various symptoms in the 2 weeks before enrollment (data not shown for symptoms with p>0.1): 1, none of the symptoms listed here; 13, chest pain (p = 0.061); 14, wheezing (p = 0.043); 11, loss of taste (p = 0.037); 12, loss of smell (p = 0.072). C) Reactivity among persons who had a positive or negative severe acute respiratory syndrome coronavirus 2 transcription-mediated amplification (TMA) nucleic acid assay result at the enrollment visit: 15, TMA-positive (p = 0.325); 16 TMA-negative. Reported p values are measured in logistic regression models with the occurrence of each symptom as the outcome and antibody ELISA OD values (log-transformed) as predictors and adjusted for age group and sex. Red lines indicate assay LoD. LoD, limit of detection; OD, optical density.
Figure 5
Figure 5
Prevalence of severe acute respiratory syndrome coronavirus 2 (SARS-CoV-2) positivity by transcription-mediated amplification (TMA) and seropositivity over time, Monterey County, California, USA, July 16–November 30, 2020. A) SARS-CoV-2 TMA; B) SARS-CoV-2 IgG ELISA. Estimated prevalence of SARS-CoV-2 infection and seropositivity in a sample population reached by outreach testing, reweighted to correct for differences in the population seeking testing over the course of the study. Lines delineate 95% CI around mean estimates (circles); medians and 95% CIs appear along the baseline.

References

    1. Lewnard JA, Lo NC. Scientific and ethical basis for social-distancing interventions against COVID-19. Lancet Infect Dis. 2020;20:631–3. 10.1016/S1473-3099(20)30190-0 - DOI - PMC - PubMed
    1. The President’s Coronavirus Guidelines for America. 30 days to slow the spread. 2020. Mar 16 [cited 2021 Jan 21]. https://trumpwhitehouse.archives.gov/wp-content/uploads/2020/03/03.16.20...
    1. Dyal JW, Grant MP, Broadwater K, Bjork A, Waltenburg MA, Gibbins JD, et al. COVID-19 among workers in meat and poultry processing facilities—19 states, April 2020. MMWR Morb Mortal Wkly Rep. 2020;69:69. 10.15585/mmwr.mm6918e3 - DOI - PubMed
    1. Steinberg J, Kennedy ED, Basler C, Grant MP, Jacobs JR, Ortbahn D, et al. COVID-19 outbreak among employees at a meat processing facility—South Dakota, March–April 2020. MMWR Morb Mortal Wkly Rep. 2020;69:1015–9. 10.15585/mmwr.mm6931a2 - DOI - PMC - PubMed
    1. Stephenson J. COVID-19 Outbreaks among food production workers may intensify pandemic’s disproportionate effects on people of color. JAMA Heal Forum. 2020. Jun 19 [Epub ahead of print]. - PubMed