. 2021 Apr 15;81(8):1749-1765.e8.
doi: 10.1016/j.molcel.2021.02.012. Epub 2021 Mar 2.

Complex-dependent histone acetyltransferase activity of KAT8 determines its role in transcription and cellular homeostasis

Affiliations

Complex-dependent histone acetyltransferase activity of KAT8 determines its role in transcription and cellular homeostasis

Aliaksandra Radzisheuskaya et al. Mol Cell. .

Abstract

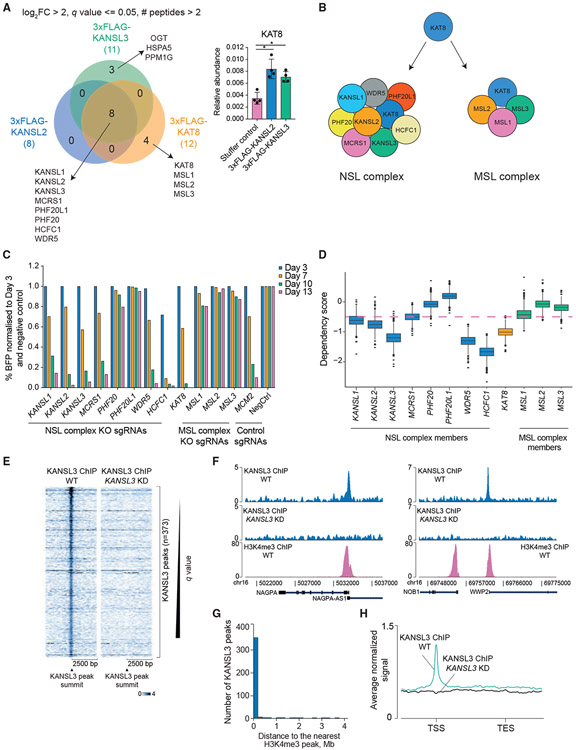
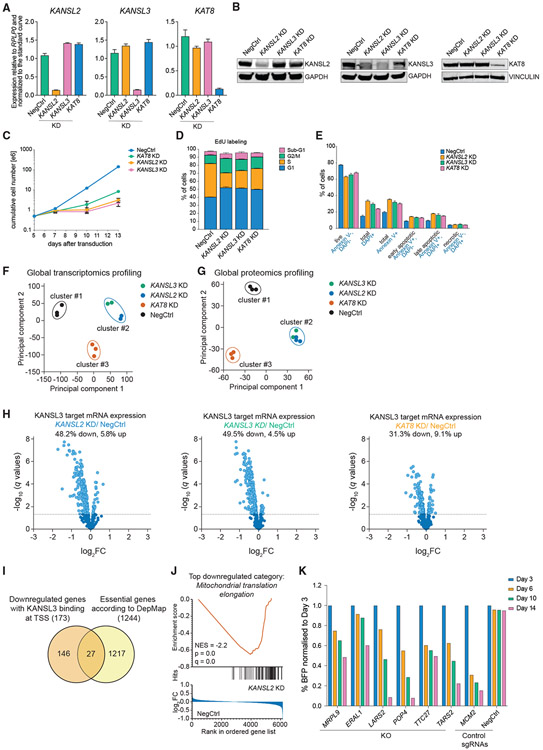
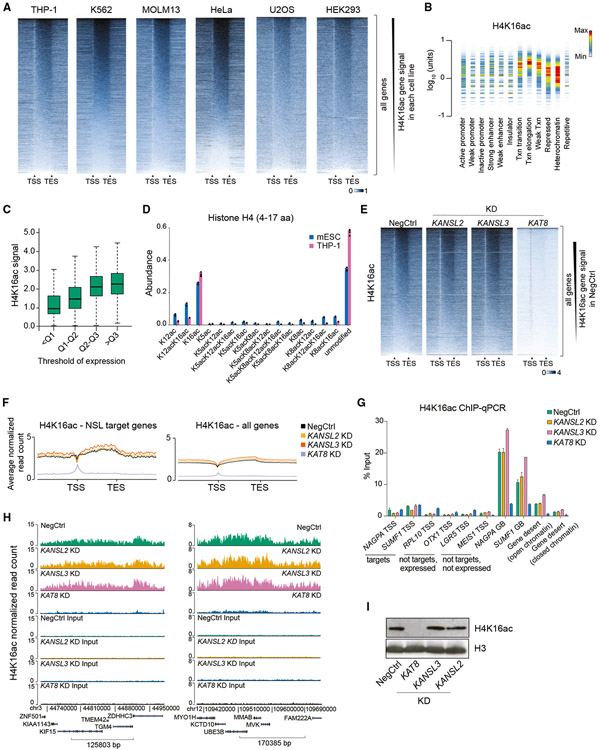
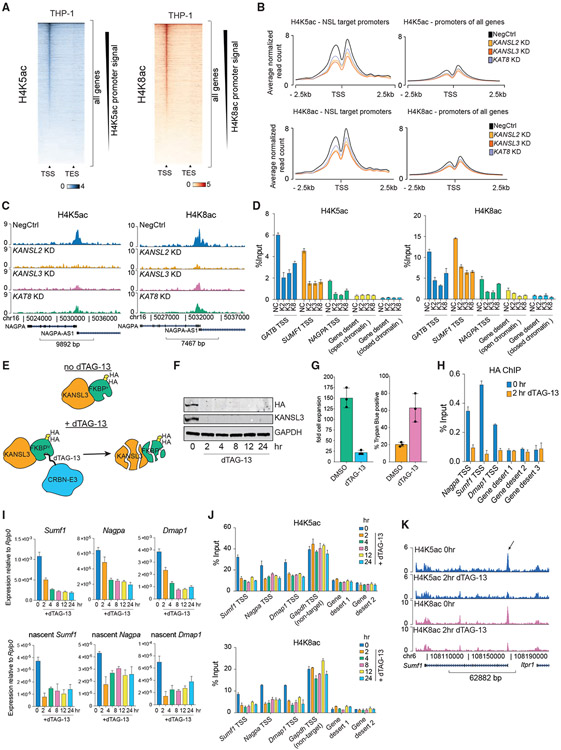
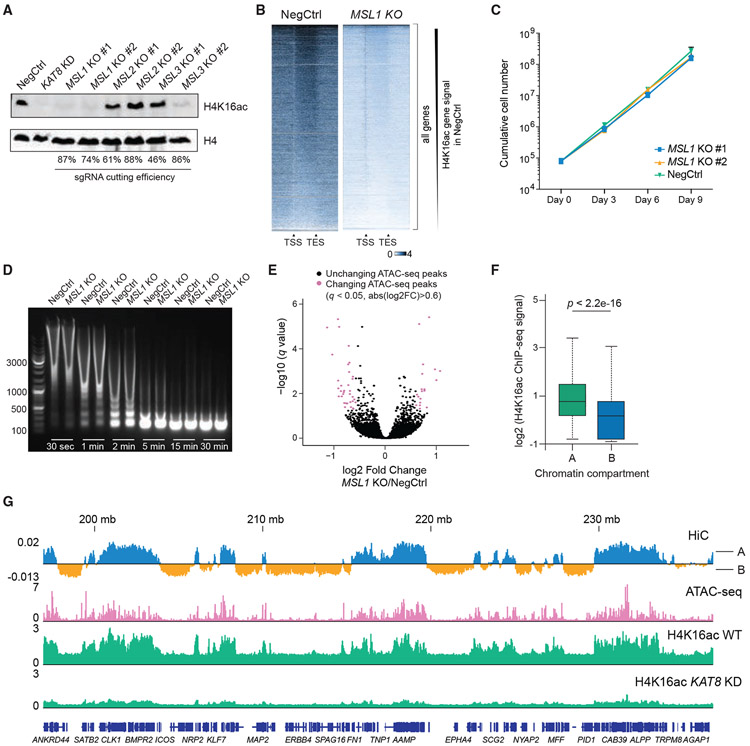
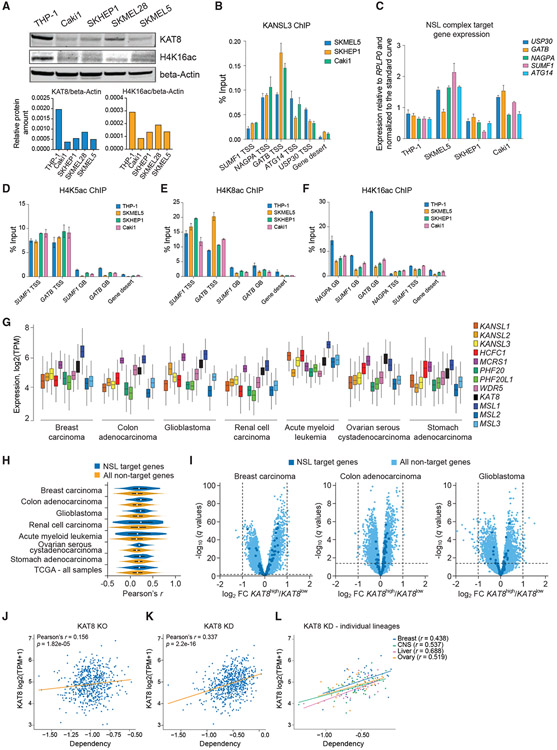
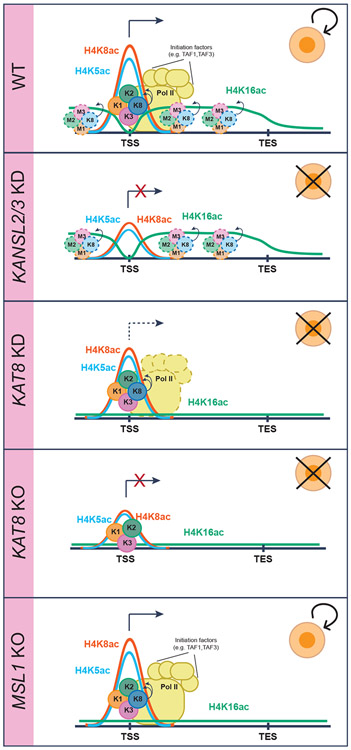
Acetylation of lysine 16 on histone H4 (H4K16ac) is catalyzed by histone acetyltransferase KAT8 and can prevent chromatin compaction in vitro. Although extensively studied in Drosophila, the functions of H4K16ac and two KAT8-containing protein complexes (NSL and MSL) are not well understood in mammals. Here, we demonstrate a surprising complex-dependent activity of KAT8: it catalyzes H4K5ac and H4K8ac as part of the NSL complex, whereas it catalyzes the bulk of H4K16ac as part of the MSL complex. Furthermore, we show that MSL complex proteins and H4K16ac are not required for cell proliferation and chromatin accessibility, whereas the NSL complex is essential for cell survival, as it stimulates transcription initiation at the promoters of housekeeping genes. In summary, we show that KAT8 switches catalytic activity and function depending on its associated proteins and that, when in the NSL complex, it catalyzes H4K5ac and H4K8ac required for the expression of essential genes.

Keywords: H4K16ac; H4K5ac; H4K8ac; KAT8; MSL complex; NSL complex; chromatin; histone acetylation; transcription.


Conflict of interest statement

Declaration of interests EpiCypher is a commercial developer and supplier of reagents (recombinant semi-synthetic modified nucleosomes) and the antibody characterization platforms used in this study. K.H. is a consultant for Inthera Bioscience AG and a scientific advisor for Hannibal Health Innovation.

Figures

Figure 1.
Figure 1.. The NSL complex is essential for cell survival and predominantly localizes to transcription start sites
(A) Venn diagram of KANSL2, KANSL3, and KAT8 interactors (log2 fold enrichment over untagged cell line > 2, minimum two peptides identified per protein, and q ≤ 0.05). KAT8 did not reach the selected enrichment threshold in the KANSL2 and KANSL3 immunoprecipitations but was significantly enriched over the untagged cell line (bar blot; values are shown as mean ± SD). *q ≤ 0.05. (B) NSL and MSL complex composition in human cells. (C) CRISPR KO competition assays testing essentiality of the NSL and MSL complex subunits. Cutting efficiency of all sgRNAs was verified using Sanger sequencing with subsequent sequence trace decomposition. (D) Boxplot describing distribution of the DepMap dependency scores for the NSL and MSL complex subunits. Genes with dependency scores ≤ −0.5 are considered essential (pink dashed line). (E) Heatmaps of normalized KANSL3 ChIP-seq signal at 5,000 bp regions surrounding all significant KANSL3 peaks. (F) Representative tracks of normalized KANSL3 and H3K4me3 ChIP-seq signals. (G) Distribution of distances between KANSL3 peaks and the nearest H3K4me3 ChIP-seq peaks. (H) Average normalized KANSL3 ChIP-seq signal across the genes nearest to KANSL3 peaks. TSS, transcription start site, TES, transcription end site. See also Figure S1 and Table S1.
Figure 2.
Figure 2.. The NSL complex is required for expression of a subset of essential genes in human cells
(A and B) qRT-PCR (A) and western blotting (B) analysis of KANSL2, KANSL3, and KAT8 expression 3 days after transduction of THP-1/cdCas9-KRAB cells with corresponding sgRNAs. In (A), values are normalized to RPLP0 and shown as mean ± SD. (C) Growth curves of THP-1/cdCas9-KRAB cells transduced with a NegCtrl sgRNA or sgRNAs against KANSL2, KANSL3, or KAT8. (D and E) Cell cycle (E) and apoptosis (F) analysis 7 days after KANSL2, KANSL3, or KAT8 KD. The values are shown as mean ± SD. (F and G) Principal-component and non-hierarchical clustering analysis of the RNA-seq (F) and proteomics (G) expression data from NSL complex KD series. (H) Volcano plots describing expression changes for all genes with a nearby KANSL3 ChIP-seq peak (KANSL3 targets) in NSL complex KD series. Differentially expressed genes are indicated in light blue (q < 0.05). (I) Venn diagram indicating overlap between downregulated KANSL3 target genes and the list of pan-essential genes from the DepMap project. (J) The gene set enrichment analysis (GSEA) enrichment plot for GO:0070125 gene set (mitochondrial translation elongation) on the basis of differential protein expression after KANSL2 KD. (K) CRISPR KO competition assays for the selected NSL complex target genes. See also Figure S2 and Table S2.
Figure 3.
Figure 3.. Depletion of KAT8 but not KANSL2 and KANSL3 abrogates global H4K16ac levels
(A) Heatmaps of H4K16ac ChIP-seq signal at all genes in six human cell lines (gene length is normalized). The signal is normalized to the total number of reads. TSS, transcription start site; TES, transcription end site. (B) Density plot of normalized THP-1 H4K16ac ChIP-seq signal across different chromatin states defined by the Broad Institute ChromHMM project in K562 cells. Similar results were obtained using K562 H4K16ac ChIP-seq data. Txn, transcription. Color in the density plot conveys shape of the signal distribution normalized to maximum within one lane. The amount of H4K16ac is shown on the y axis. (C) Boxplots demonstrating statistical summary of H4K16ac ChIP-seq signal in gene bodies of genes binned according to quantile (Q) distribution of expression in THP-1 cells. All groups are significantly different (p < 2.2e-16, two-sided Wilcoxon rank-sum test). (D) Bar plot indicating abundances of individual H4 peptides (amino acids 4–17) with different acetylation combinations in mouse ESCs and human THP-1 cells measured using mass spectrometry. (E) Heatmaps of H4K16ac ChIP-seq signal at all genes in NSL complex KD series. The signal is normalized to the number of Drosophila reads (see STAR methods). (F) Average normalized H4K16ac ChIP-seq profiles across NSL target genes or all genes in NSL complex KD series. (G) qRT-PCR quantitation of H4K16ac ChIP signal at selected loci after KDs of KANSL2, KANSL3, or KAT8. TSS, transcription start site; GB, gene body. Values are shown as mean ± SD. (H) Example H4K16ac ChIP-seq tracks in NSL complex KD series. (I) Western blotting analysis of H4K16ac and H3 levels after KANSL2, KANSL3, or KAT8 KDs. See also Figure S3 and Tables S3 and S4.
Figure 4.
Figure 4.. The NSL complex catalyzes H4K5 and H4K8 acetylation and is required for transcription initiation
(A) Heatmap of normalized H4K5ac antibody #1 and H4K8ac ChIP-seq signal at all genes in wild-type THP-1 cells. (B) Average normalized H4K5ac antibody #1 and H4K8ac ChIP-seq profiles across NSL target genes or all genes in NSL complex KD series. (C) Examples of H4K5ac antibody #1 and H4K8ac ChIP-seq tracks at a representative NSL complex target gene. (D) qRT-PCR quantitation of H4K5ac and H4K8ac ChIP signal at selected loci after KD of KANSL2, KANSL3, or KAT8. TSS, transcription start site; GB, gene body; NC, NegCtrl; K2, K3, and K8 respectively stand for KANSL2, KANSL3, and KAT8 KD. Values are shown as mean ± SD. (E) Schematic representation of the dTAG Kansl3 degron system. FKBPF36V is indicated as FKBPV. (F) Western blot of HA-tagged KANSL3 and GAPDH in Kansl3 degron-knockin cell line at different times after dTAG-13 addition. (G) Bar plots representing fold cell expansion and percentage of Trypan blue-positive cells after 4 days of dTAG-13 treatment. (H) qRT-PCR analysis of HA-tagged KANSL3 binding at selected target genes and control regions in Kansl3 degron-knockin cell line at 0 and 2 h after dTAG-13 treatment. Values are shown as mean ± SD. (I) qRT-PCR analysis of total and nascent mRNA expression of NSL complex target genes in Kansl3 degron-knockin cell line at different times after dTAG-13 treatment. Values are normalized to Rplp0 and shown as mean ± SD. (J) qRT-PCR quantitation of H4K5ac and H4K8ac ChIP signal at selected loci in Kansl3 degron-knockin cell line at different times of dTAG-13 treatment. Values are mean ± SD. (K) H4K5ac and H4K8ac ChIP-seq tracks at Sumf1 locus (NSL complex target gene) in Kansl3 degron-knockin cell line at 0 and 2 h after dTAG-13 treatment. Arrow indicates Sumf1 TSS. See also Figures S4-S6 and Tables S3 and S5.
Figure 5.
Figure 5.. H4K16ac is associated with open chromatin but does not regulate chromatin accessibility in vivo
(A) Western blot analysis of H4K16ac and H4 in THP-1/Cas9 cells transduced with sgRNAs targeting MSL complex members. (B) Heatmaps of H4K16ac ChIP-seq signal at all genes in wild-type (NegCtrl) or MSL1-KO cells. The signal is normalized to the number of Drosophila reads (see STAR methods). (C) Growth curves of THP-1/Cas9 cells transduced with a NegCtrl sgRNA or two independent sgRNAs against MSL1. (D) Agarose gel electrophoresis image comparing chromatin digestion profiles of wild-type and MSL1-KO cells at different times after MNase addition. (E) Volcano plot illustrating changes in ATAC-seq peaks after MSL1 KO in THP-1 cells. (F) Boxplot summarizing H4K16ac ChIP-seq signal intensity in HiC-defined compartments A and B. p value was calculated using Wilcoxon rank-sum test. (G) Example tracks demonstrating correlation between H4K16ac and open chromatin (ATAC-seq peaks and HiC-defined compartments A) in THP-1 cells. See also Figure S7 and Table S6.
Figure 6.
Figure 6.. KAT8-low cancers retain NSL complex function but lose H4K16ac globally
(A) Western blot analysis and quantitation of KAT8, H4K16ac, and beta-actin in THP-1, Caki1, SKHEP1, SKMEL28, and SKMEL5 cells. (B) qRT-PCR quantitation of KANSL3 ChIP signal at a subset of NSL complex target TSSs in SKMEL5, SKHEP1, and Caki1 cells. Values are shown as mean ± SD. (C) qRT-PCR gene expression analysis of a subset of NSL complex target genes in THP-1, Caki1, SKHEP1, and SKMEL5 cells. Values are normalized to RPLP0 and shown as mean ± SD. (D–F) qRT-PCR analysis of H4K5ac (D), H4K8ac (E), and H4K16ac (F) ChIP signal at gene bodies (GBs) and TSS regions of a subset of NSL complex target genes in THP-1, SKMEL5, SKHEP1, and Caki1 cells. Values are shown as mean ± SD. (G) Expression of the NSL and MSL complex members in different types of human cancer cells. Data are from The Cancer Genome Atlas. (H) Vioplots demonstrating distribution of Pearson’s correlation coefficients (r) for KAT8 expression versus expression of 20,501 genes measured using RNA-seq in 10,433 cancer samples in The Cancer Genome Atlas for NSL complex target genes (as defined in THP-1 cells) and non-target genes. (I) Volcano plots illustrating gene expression differences between the KAT8high and KAT8low human cancer samples (defined by median KAT8 expression) in the selected dataset from The Cancer Genome Atlas datasets. (J and K) Scatterplots describing relationship between KAT8 expression level and cell sensitivity to KAT8 KO (J) defined using CRISPR KO (DepMap CERES dependency score) in 721 cancer cell lines or KAT8 KD (K) defined using RNAi (DepMap DEMETER2 dependency score) in 640 cancer cell lines. The robust Pearson’s correlation coefficient was calculated by bootstrapping 10% of the data. (L) Scatterplot describing relationship between KAT8 expression level and cell sensitivity to KAT8 KD in selected cancer lineages.
Figure 7.
Figure 7.. Model for the function of the NSL and MSL complexes
As part of the NSL complex, KAT8 binds to a subset of active gene promoters, where it stimulates TAF1 binding, through H4K5 and H4K8 acetylation. This facilitates Pol II recruitment and transcription initiation. As part of the MSL complex, KAT8 catalyzes the bulk of H4K16ac in open chromatin regions and, especially, in gene bodies. K1, KANSL1; K2, KANSL2; K3, KANSL3; K8, KAT8; M1, MSL1; M2, MSL2; M3, MSL3.

References

    1. Akhtar A, and Becker PB (2000). Activation of transcription through histone H4 acetylation by MOF, an acetyltransferase essential for dosage compensation in Drosophila. Mol. Cell 5, 367–375. - PubMed
    1. Allahverdi A, Yang R, Korolev N, Fan Y, Davey CA, Liu C-F, and Nordenskiöld L (2011). The effects of histone H4 tail acetylations on cation-induced chromatin folding and self-association. Nucleic Acids Res. 39, 1680–1691. - PMC - PubMed
    1. Anamika K, Krebs AR, Thompson J, Poch O, Devys D, and Tora L (2010). Lessons from genome-wide studies: an integrated definition of the coactivator function of histone acetyl transferases. Epigenetics Chromatin 3, 18, 10. - PMC - PubMed
    1. Anders S, McCarthy DJ, Chen Y, Okoniewski M, Smyth GK, Huber W, and Robinson MD (2013). Count-based differential expression analysis of RNA sequencing data using R and Bioconductor. Nat. Protoc 8, 1765–1786. - PubMed
    1. Armstrong RL, Penke TJR, Strahl BD, Matera AG, McKay DJ, MacAlpine DM, and Duronio RJ (2018). Chromatin conformation and transcriptional activity are permissive regulators of DNA replication initiation in Drosophila. Genome Res. 28, 1688–1700. - PMC - PubMed

Publication types