. 2021 Apr 7;109(7):1118-1136.e11.
doi: 10.1016/j.neuron.2021.02.009. Epub 2021 Mar 2.

SARM1 is a metabolic sensor activated by an increased NMN/NAD+ ratio to trigger axon degeneration

Affiliations

SARM1 is a metabolic sensor activated by an increased NMN/NAD+ ratio to trigger axon degeneration

Matthew D Figley et al. Neuron. .

Abstract

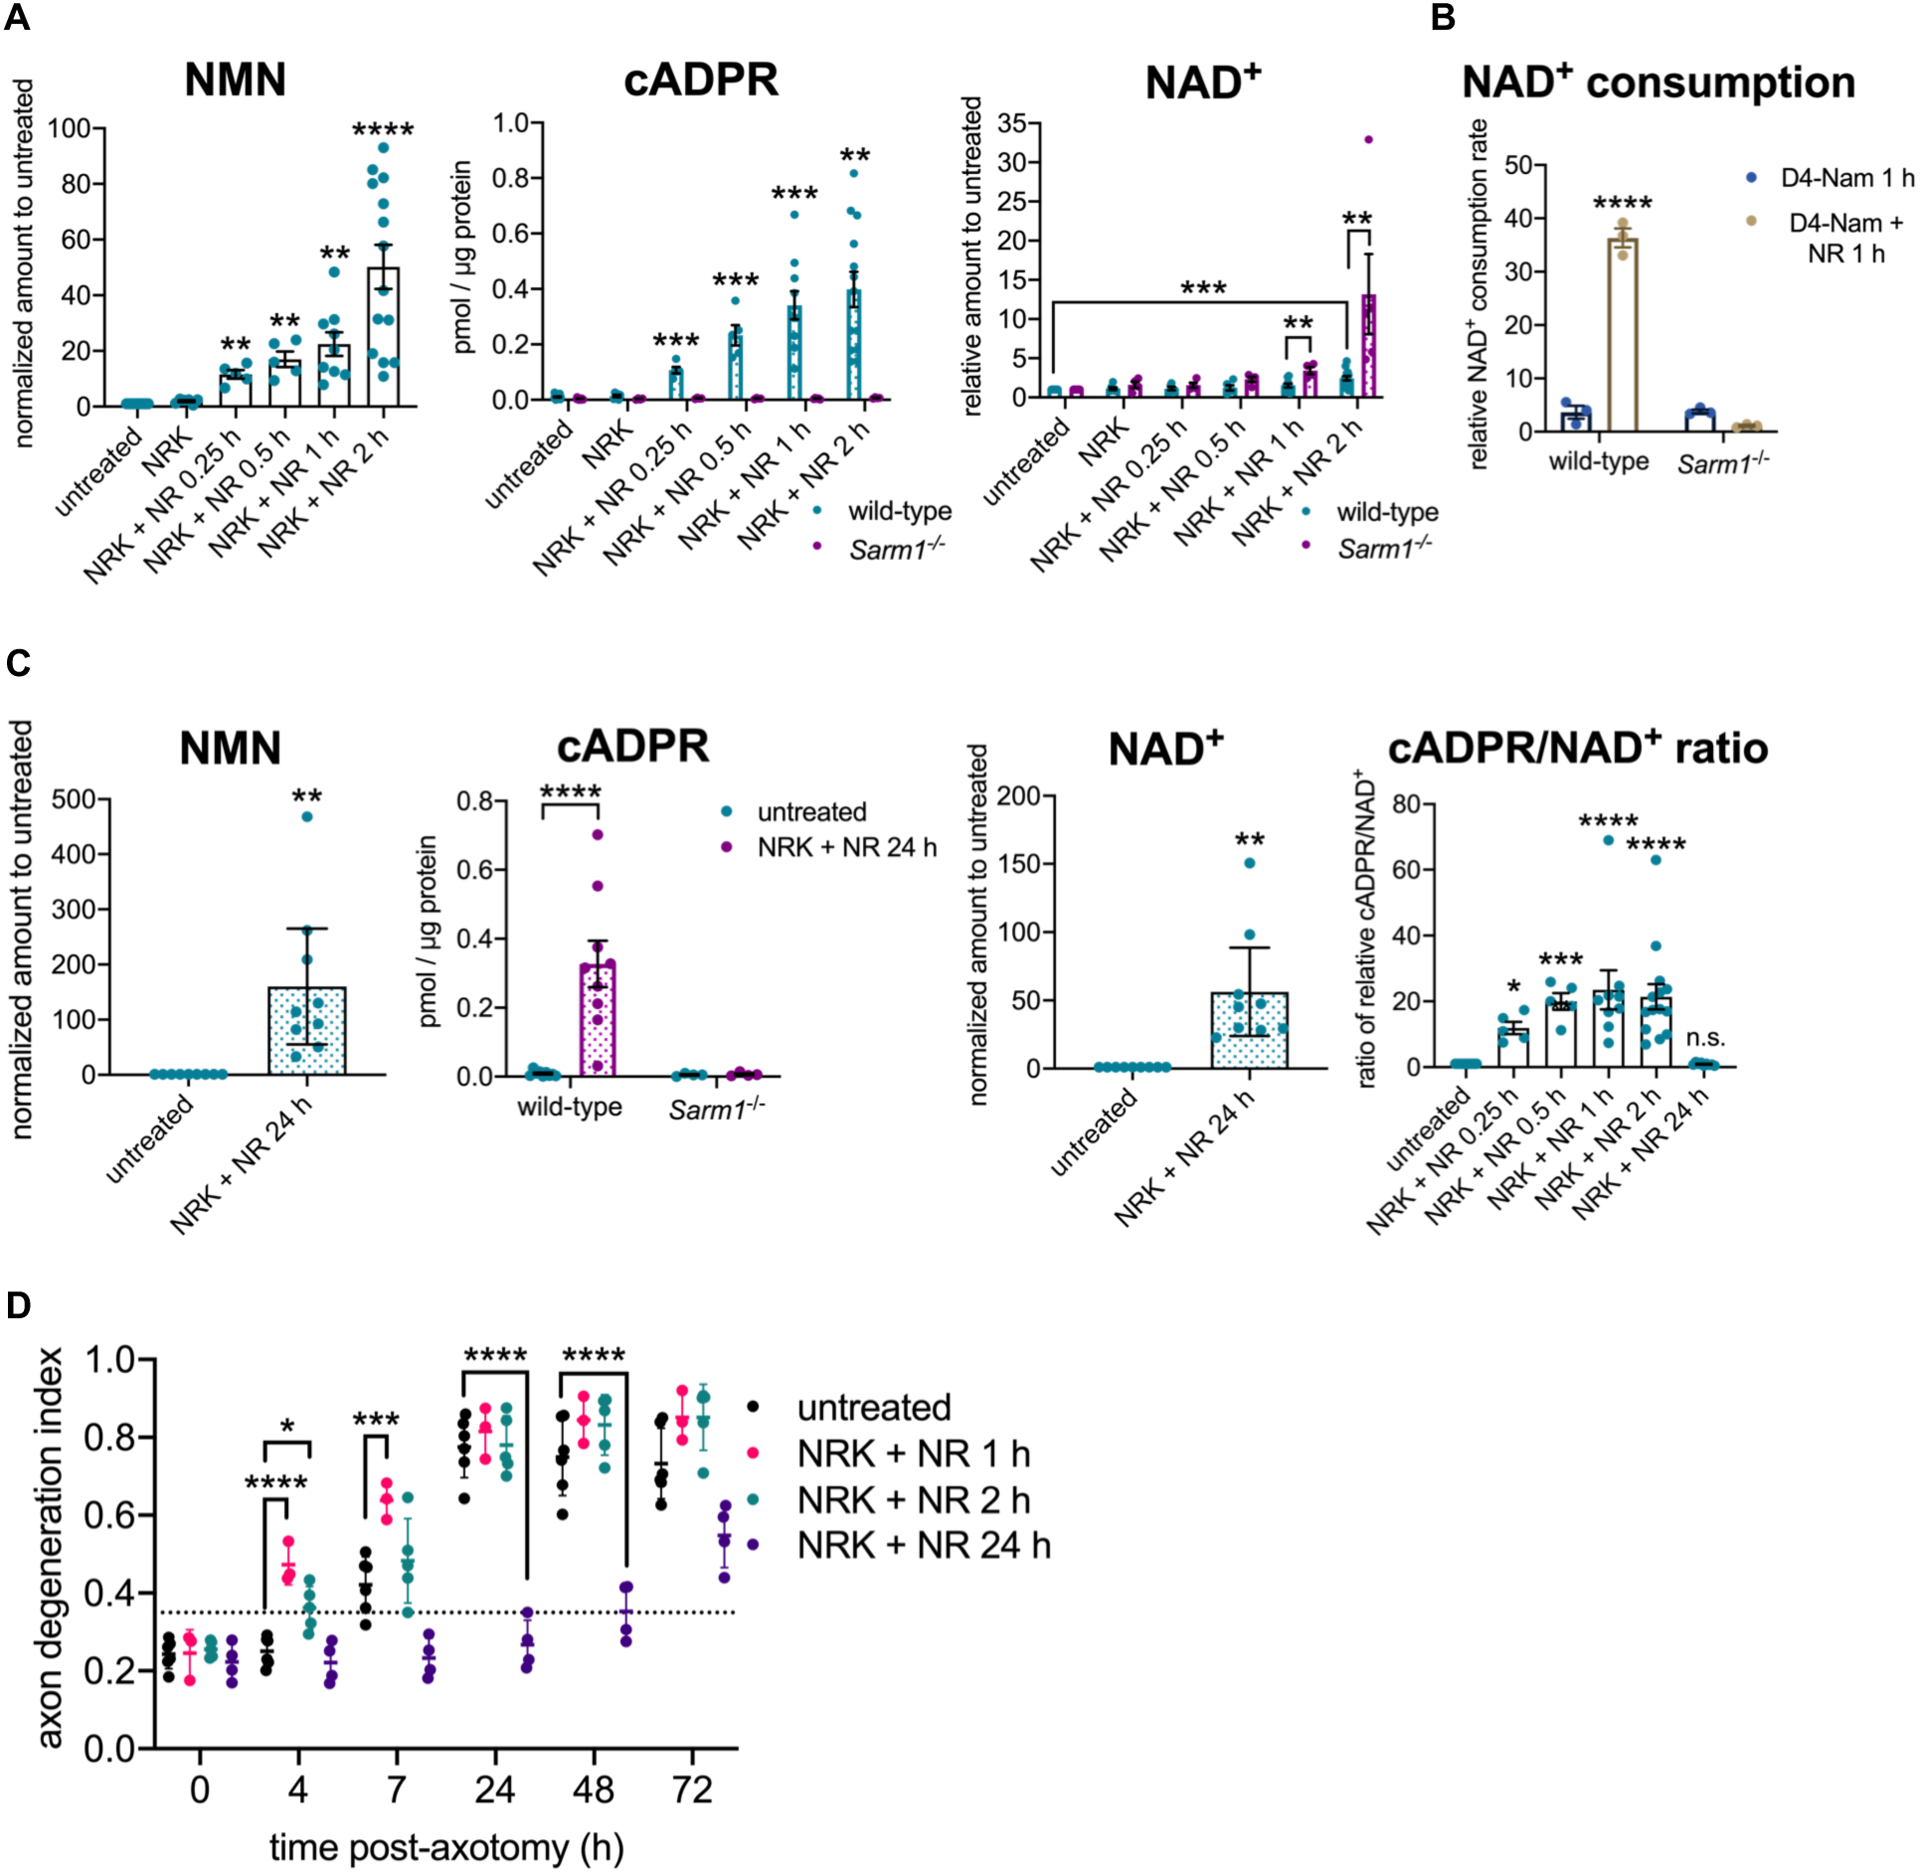
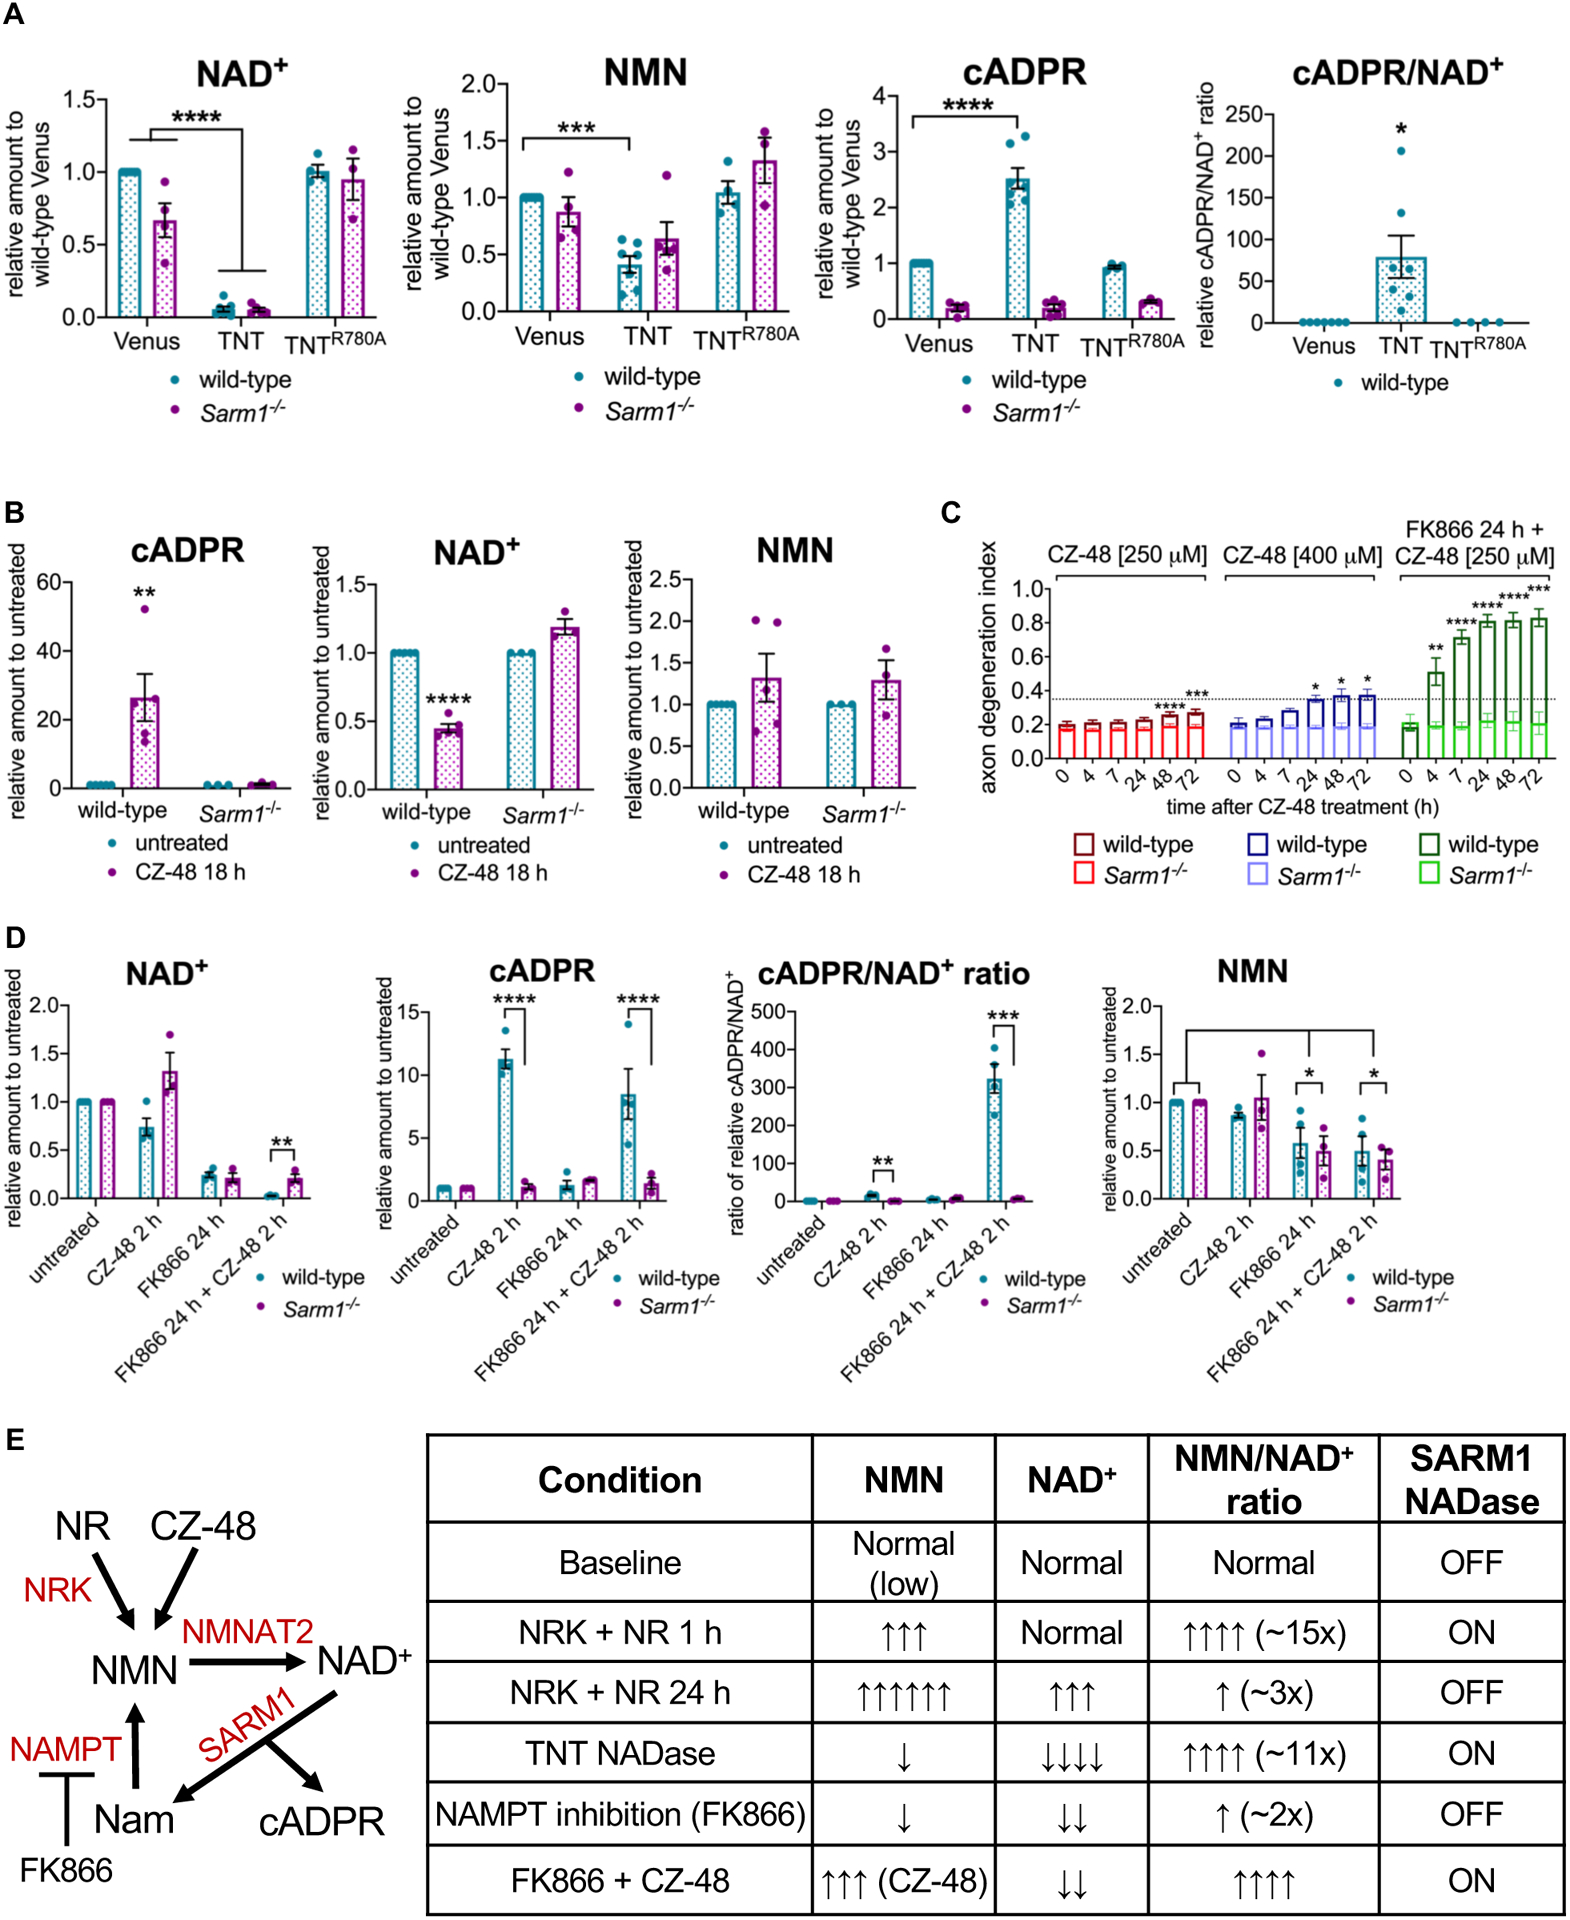
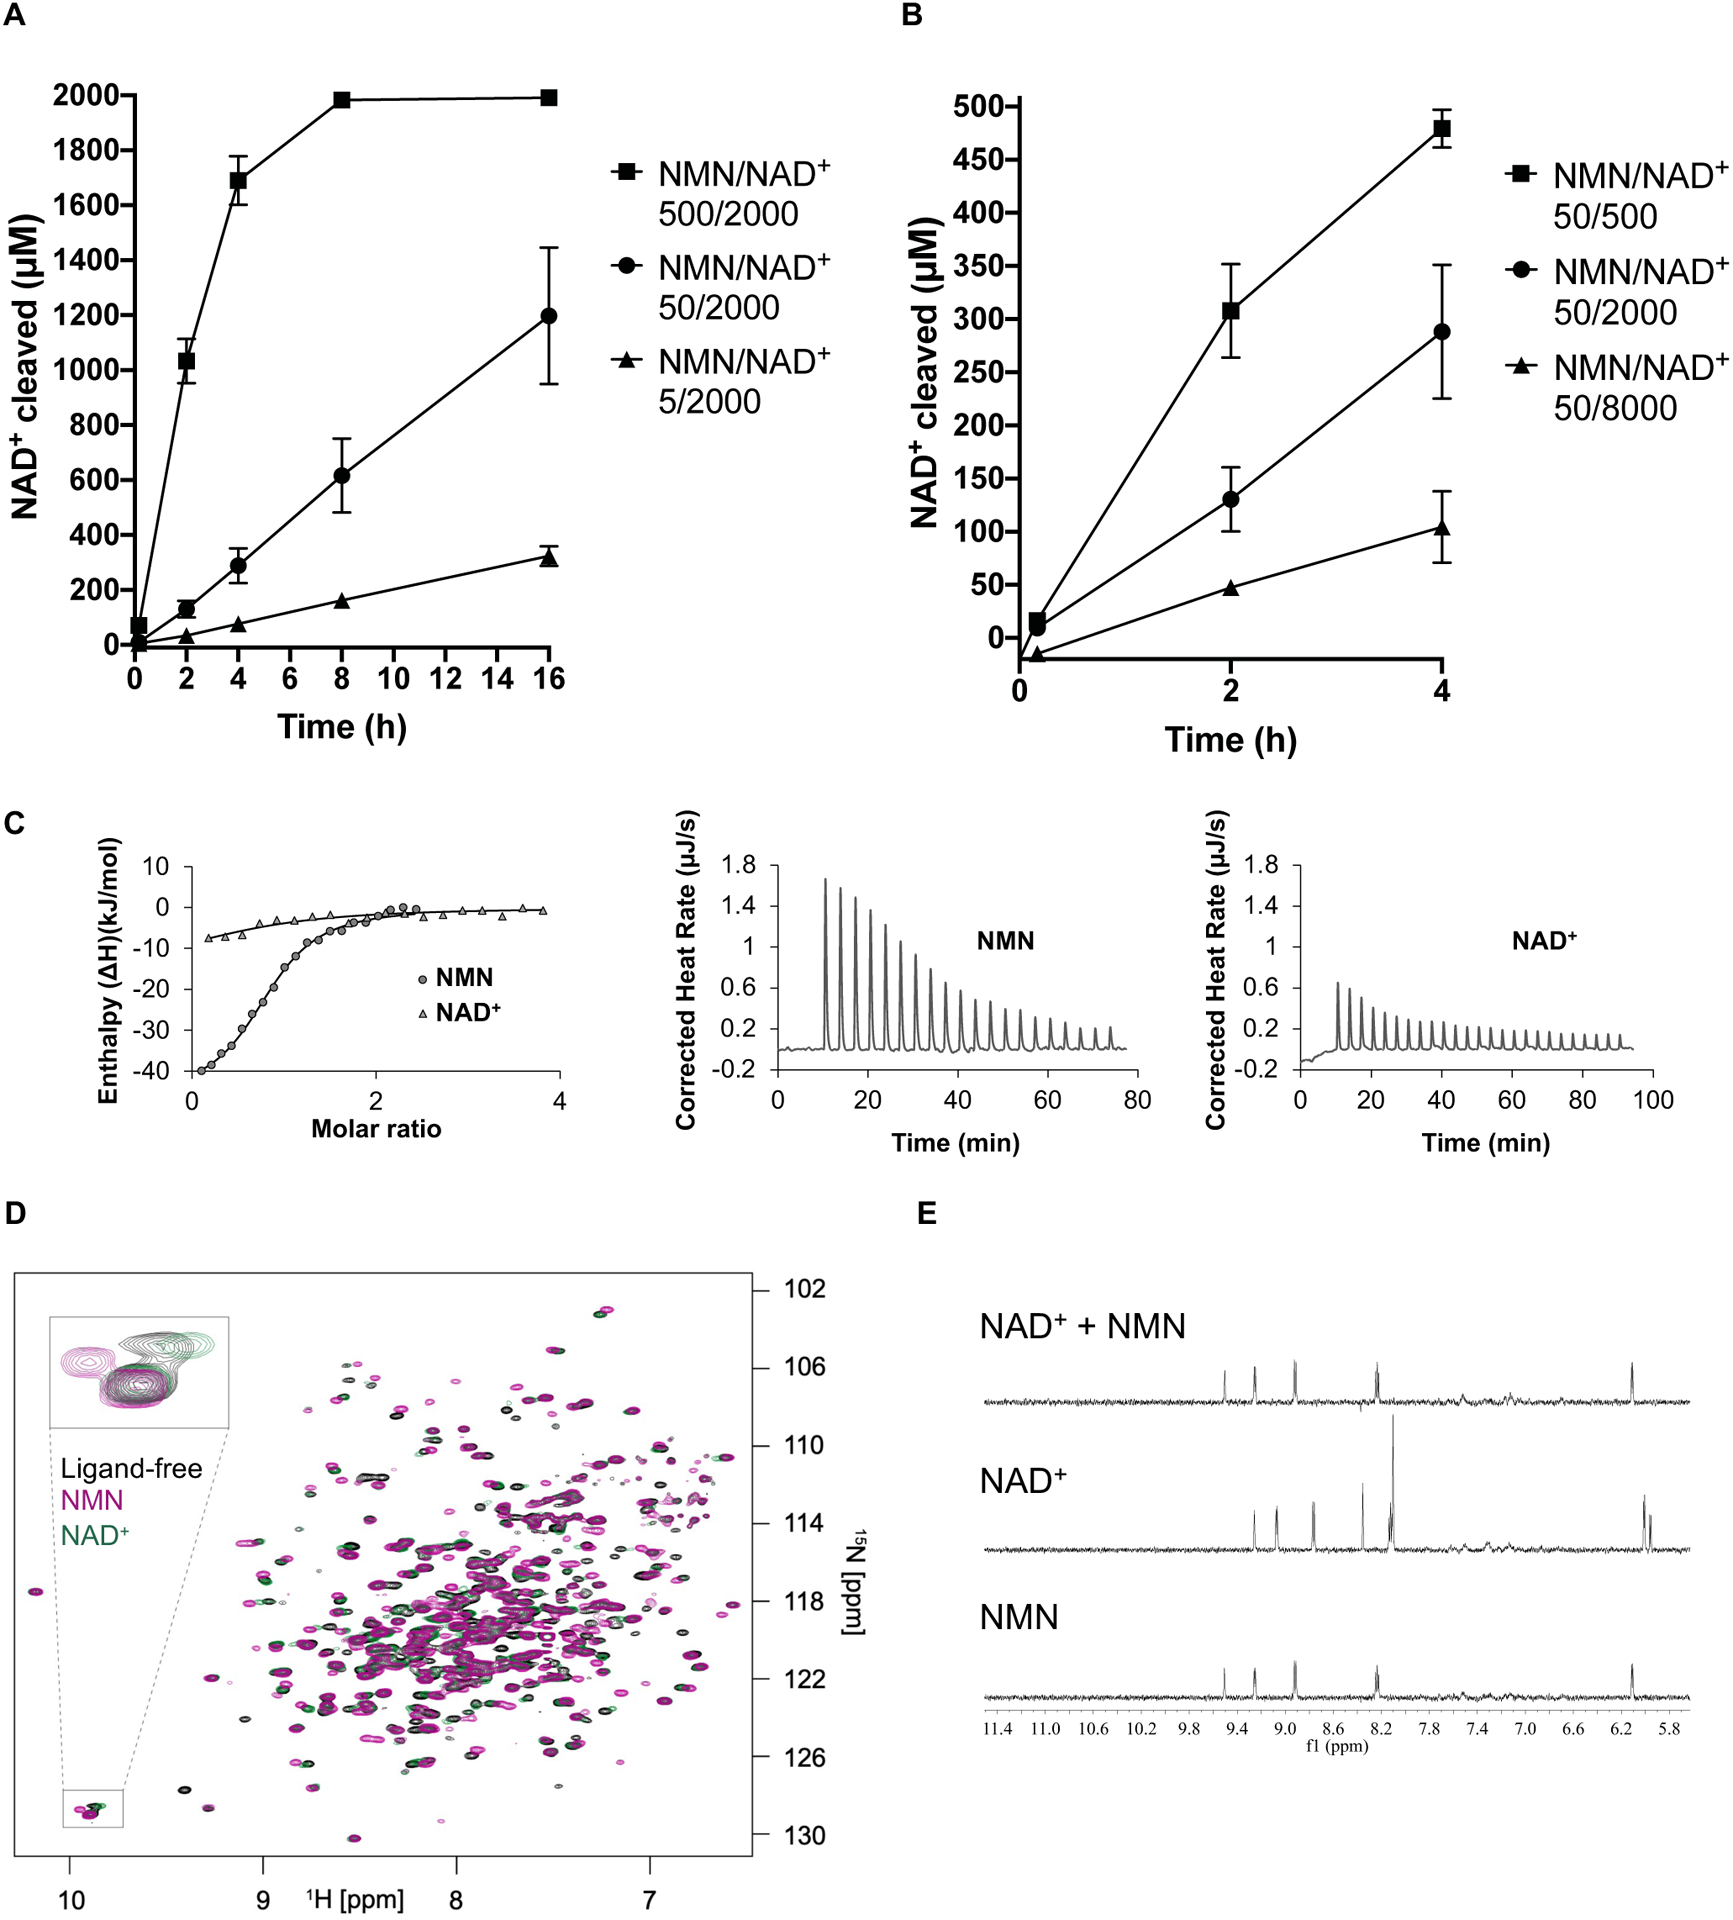
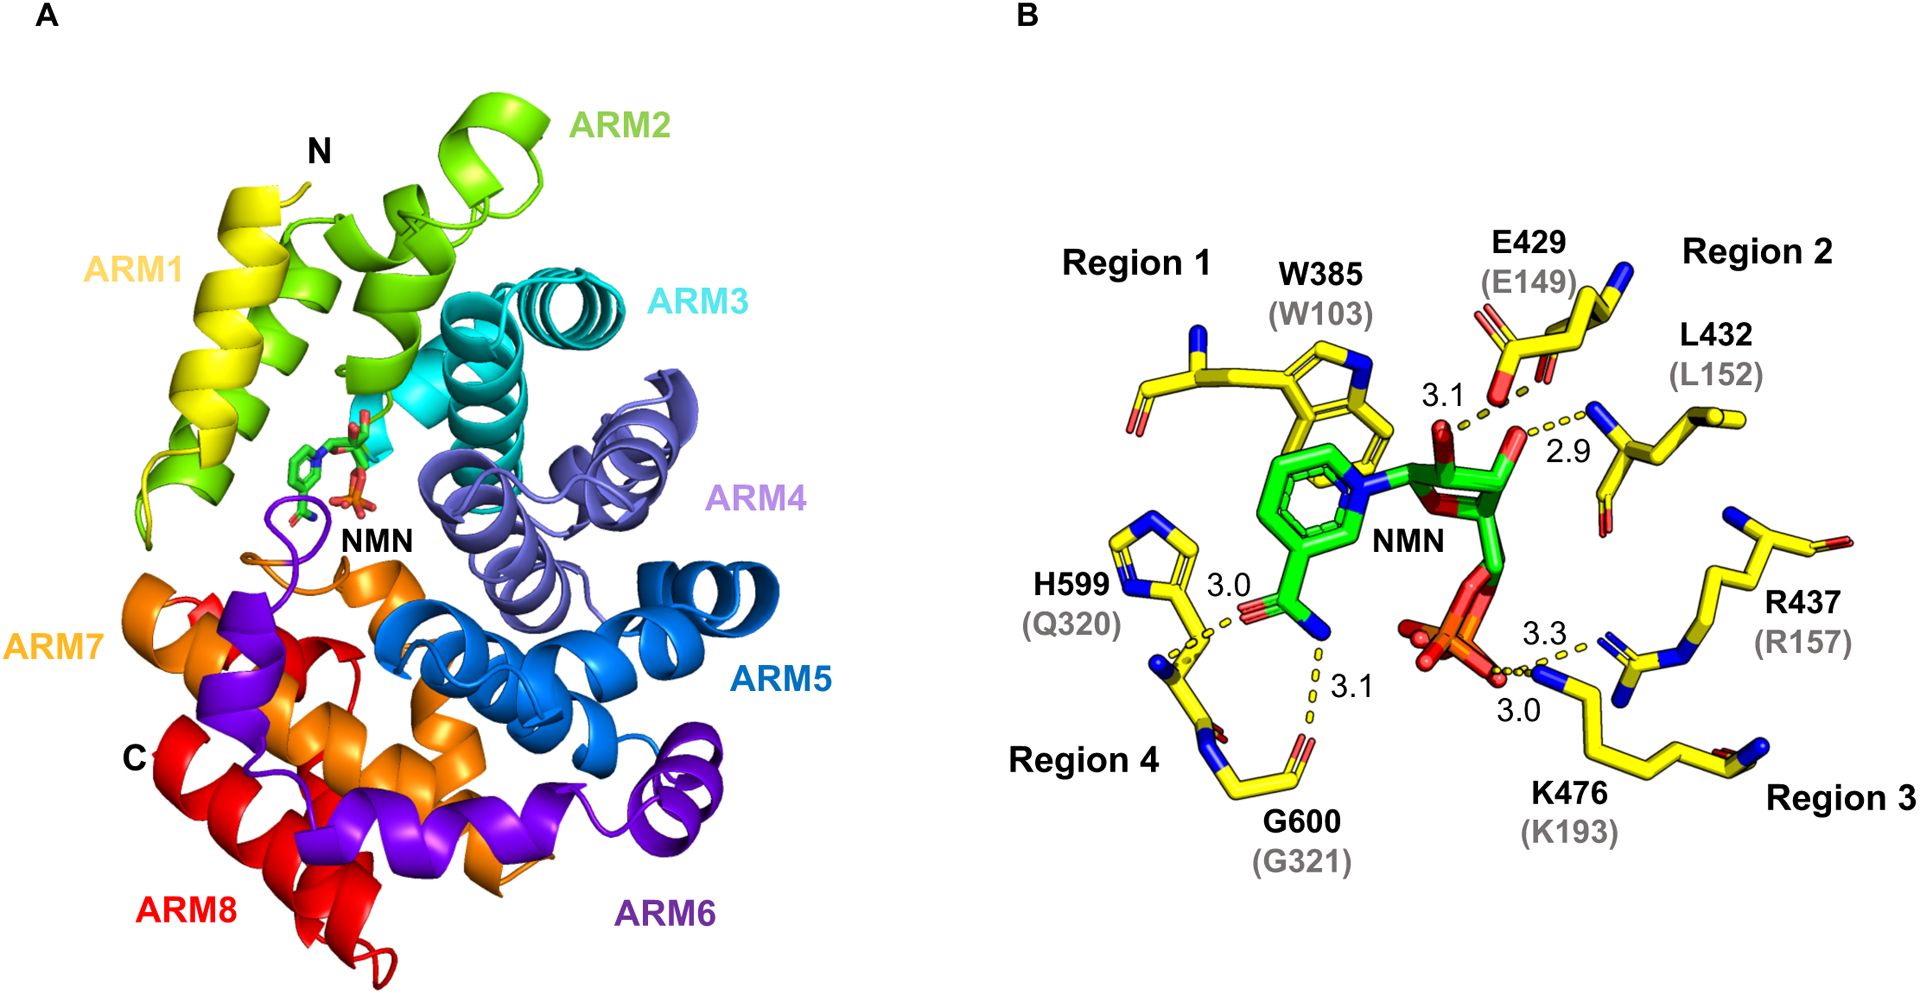
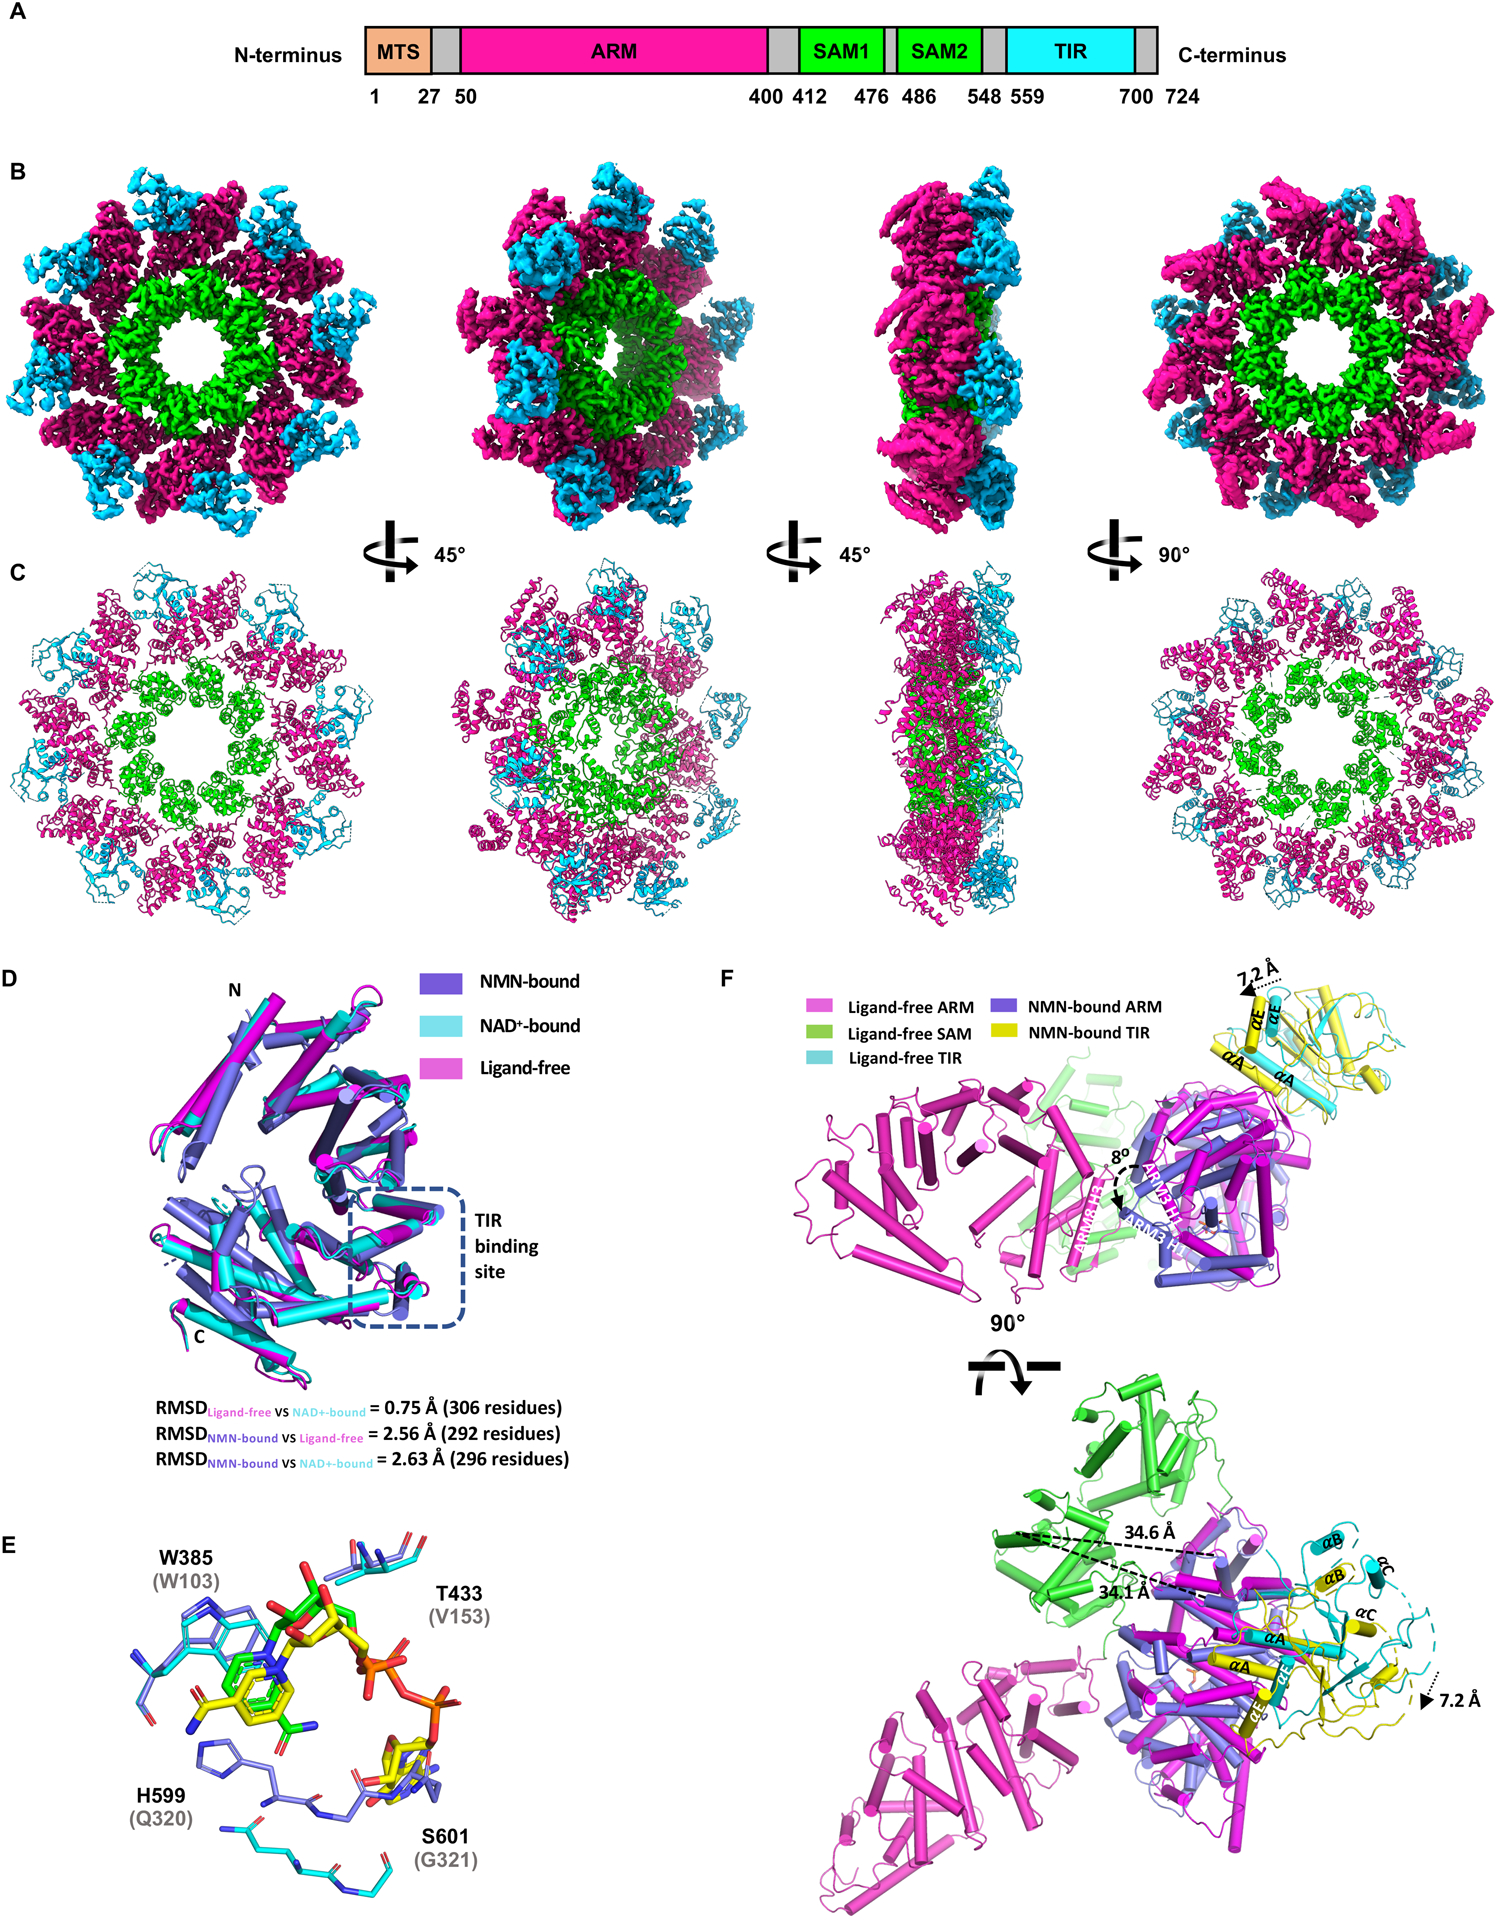
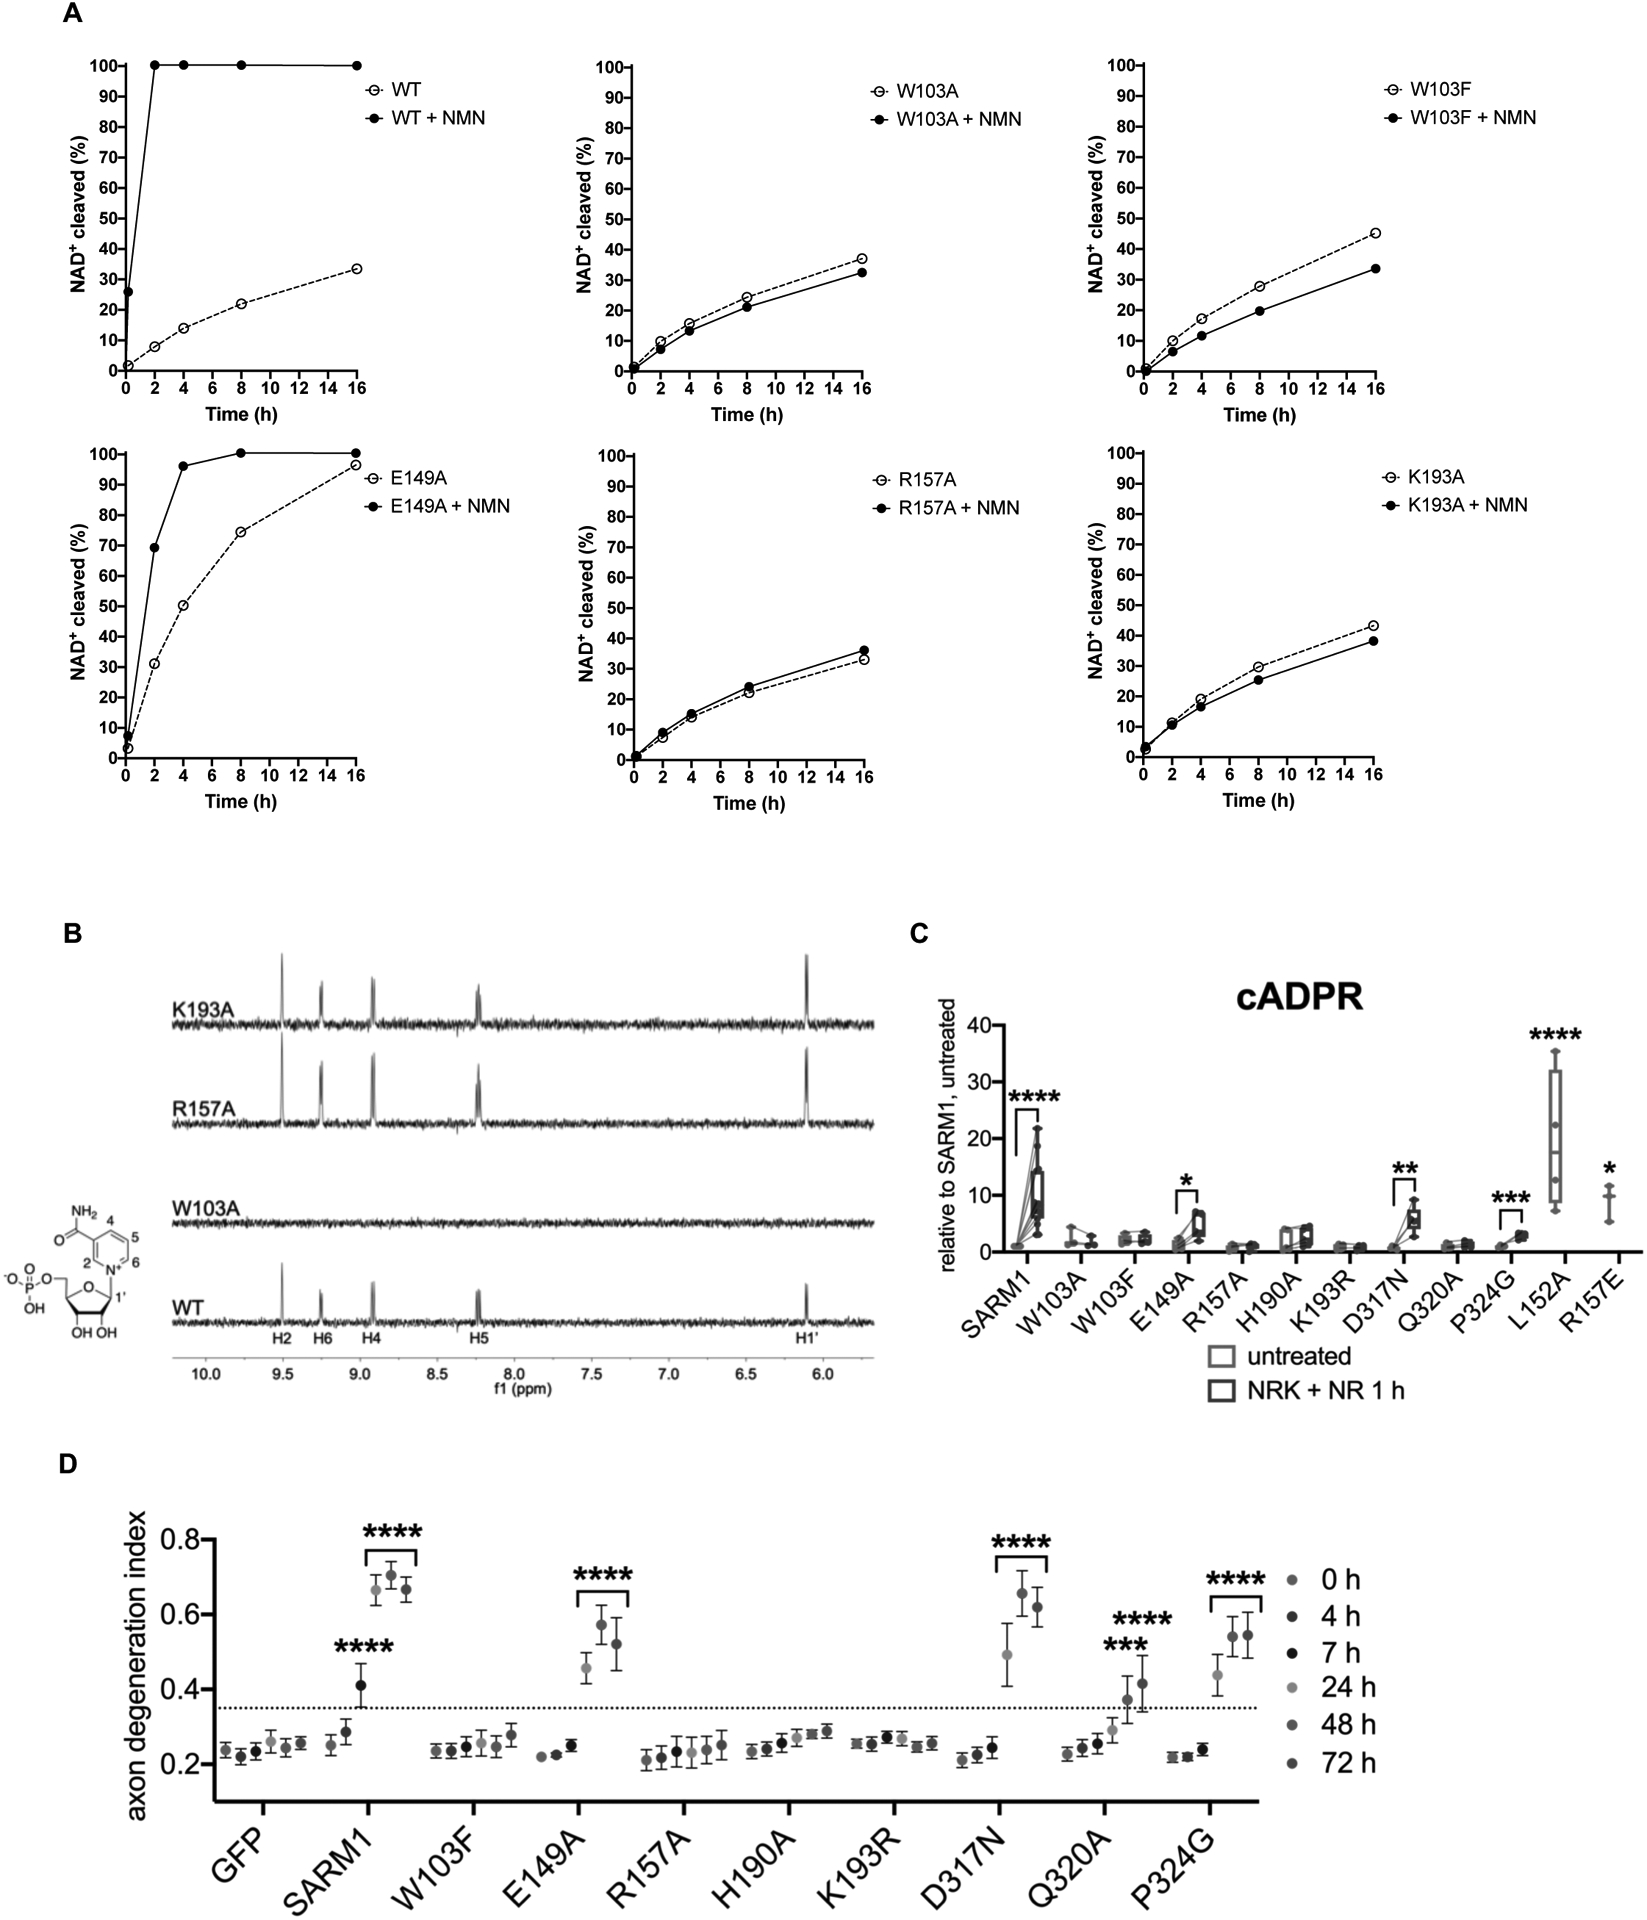
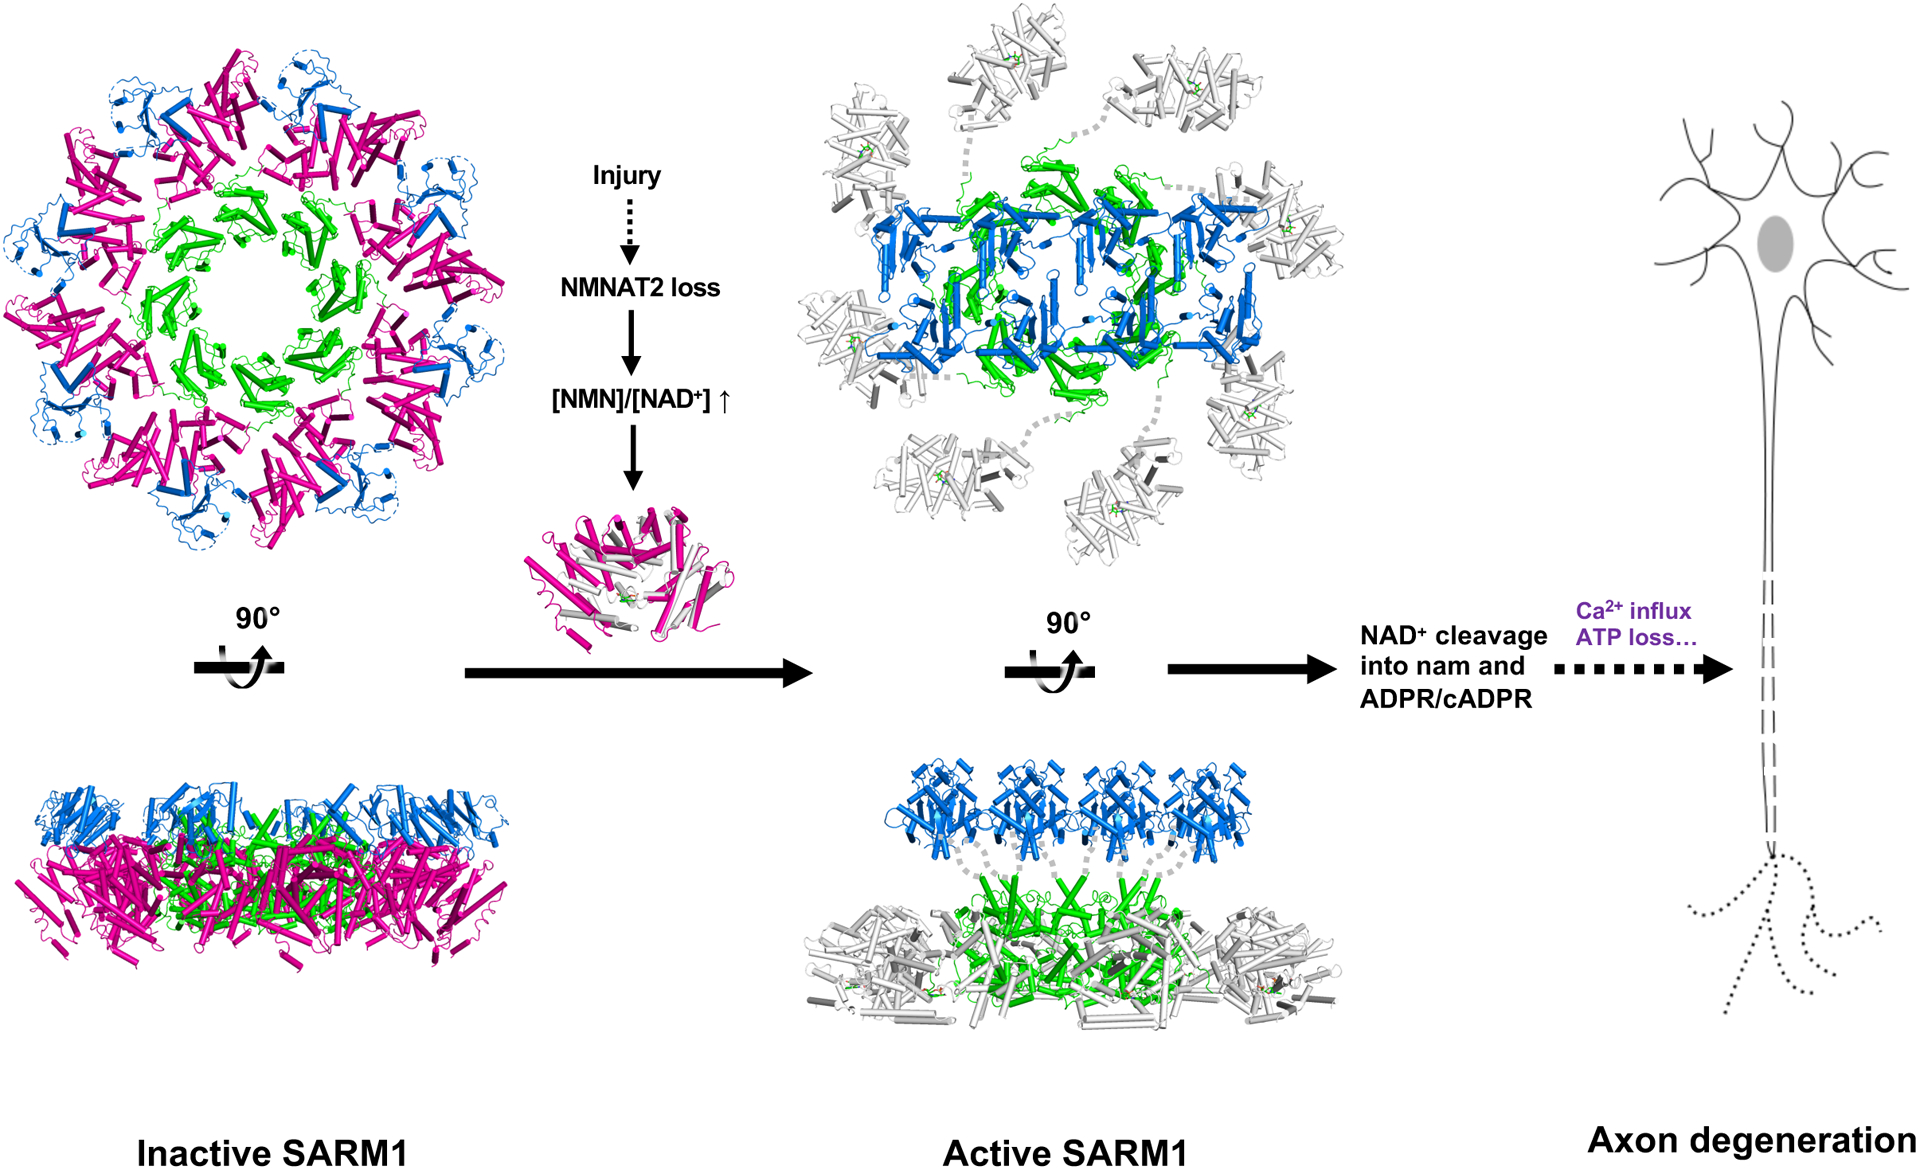
Axon degeneration is a central pathological feature of many neurodegenerative diseases. Sterile alpha and Toll/interleukin-1 receptor motif-containing 1 (SARM1) is a nicotinamide adenine dinucleotide (NAD+)-cleaving enzyme whose activation triggers axon destruction. Loss of the biosynthetic enzyme NMNAT2, which converts nicotinamide mononucleotide (NMN) to NAD+, activates SARM1 via an unknown mechanism. Using structural, biochemical, biophysical, and cellular assays, we demonstrate that SARM1 is activated by an increase in the ratio of NMN to NAD+ and show that both metabolites compete for binding to the auto-inhibitory N-terminal armadillo repeat (ARM) domain of SARM1. We report structures of the SARM1 ARM domain bound to NMN and of the homo-octameric SARM1 complex in the absence of ligands. We show that NMN influences the structure of SARM1 and demonstrate via mutagenesis that NMN binding is required for injury-induced SARM1 activation and axon destruction. Hence, SARM1 is a metabolic sensor responding to an increased NMN/NAD+ ratio by cleaving residual NAD+, thereby inducing feedforward metabolic catastrophe and axonal demise.

Keywords: ARM domain; NADase; TIR domain; X-ray crystallography; allostery; cryo-EM; nicotinamide riboside.


Conflict of interest statement

Declaration of interests A.D. and J.M. are co-founders, scientific advisory board members, and shareholders of Disarm Therapeutics. B.K. is shareholder of Disarm Therapeutics. Y. Sasaki and B.K. are consultants to Disarm Therapeutics. B.K. and T.V. receive research funding from Disarm Therapeutics. R.O.H. and T.B. are employees and shareholders in Disarm Therapeutics. K.C. and P.S.K. are employees of Evotec (UK) Ltd. The authors declare no additional competing interests.

Figures

Figure 1.
Figure 1.
NMN activates SARM1 in primary neurons in the absence of injury. A NMN (nicotinamide mononucleotide), cADPR (cyclic adenosine diphosphate ribose), and NAD+ (nicotinamide adenine dinucleotide) levels from wild-type or Sarm1−/− primary mouse eDRG neurons with lentiviral expression of NRK1 and treated with NR (nicotinamide riboside) [100 μM]. NMN and NAD+ levels are shown relative to untreated control, and cADPR as concentration in pmol/μg protein, measured by LC-MS-MS. Data correspond to means from replicate experiments and error bars denote ±SEM. Statistical significance was determined by Sidak’s multiple comparisons test, relative to untreated neurons, or by unpaired t-tests with corrections for multiple comparisons using the Holm-Sidak method, comparing wild-type to Sarm1−/− for each condition. * denotes P value=<0.05; **=<0.01; ***=<0.001; ****=<0.0001. B Relative NAD+ consumption rate in primary mouse eDRG neurons after D4-nicotinamide (D4-Nam) [300 μM] +/− 1 h NR [100 μM] treatment. Data correspond to means from replicate experiments and error bars denote ±SEM. Statistical significance was determined by two-way ANOVA with Tukey’s multiple comparisons test. * denotes P value=<0.05; **=<0.01; ***=<0.001; ****=<0.0001. C NMN, cADPR and NAD+ levels from primary eDRG neurons from wild-type or Sarm1−/− mice. NMN and NAD+ levels relative to untreated control, and cADPR as concentration in pmol/μg protein, measured by LC-MS-MS, are shown. Ratio of relative cADPR to relative NAD+ levels from primary mouse eDRG neurons treated with NR are also shown. Data correspond to means from replicate experiments and error bars denote ±SEM. Statistical significance was determined by t-test (NMN, NAD+); Two-way ANOVA with Tukey’s multiple comparison test (cADPR) or Dunnett’s multiple comparison test (relative to untreated) (cADPR/NAD+). * denotes P value=<0.05; **=<0.01; ***=<0.001; ****=<0.0001. D Axon degeneration time course after axotomy, quantified as degeneration index (DI), where a DI of 0.35 or above represents degenerated axons, indicated by a horizontal dotted line. Data correspond to means from replicate experiments and error bars denote ±SD. Statistical significance was determined by two-way ANOVA with Dunnett’s multiple comparison test, comparing each condition to the others at each time point. * denotes P value=<0.05; **=<0.01; ***=<0.001; ****=<0.0001. See also Figure S1.
Figure 2.
Figure 2.
NMN/NAD+ ratio controls SARM1 activation in neurons. A NAD+, NMN, cADPR levels and the relative cADPR/NAD+ ratios from primary eDRG neurons from wild-type or Sarm1−/− mice expressing Venus control, TNT or TNTR780A after four days, relative to Venus control, measured by LC-MS-MS. Data correspond to means from replicate experiments and error bars denote ±SEM. Statistical significance was determined by two-way ANOVA with Dunnett’s multiple comparison test, comparing each condition to Venus-expressing control neurons. * denotes P value=<0.05; **=<0.01; ***=<0.001; ****=<0.0001. B cADPR, NAD+ and NMN levels from primary eDRG neurons from wild-type or Sarm1−/− mice, after treatment with CZ-48 [250 μM] for 18 h, relative to untreated control, measured by LC-MS-MS. Data correspond to means from replicate experiments and error bars denote ±SEM. Statistical significance was determined by multiple unpaired t-tests with corrections for multiple comparisons using the Holm-Sidak method. * denotes P value=<0.05; **=<0.01; ***=<0.001; ****=<0.0001. C Axon-degeneration time course after treatment with CZ-48 [250 or 400 μM] or 24 h pre-treatment with FK866 [100 nM] + CZ-48 [250 μM], in primary eDRG neurons from wild-type or Sarm1−/− mice, and quantified as degeneration index (DI), where a DI of 0.35 or above represents degenerated axons. Data correspond to means from replicate experiments and error bars denote ±SD. Statistical significance was determined by two-way ANOVA with Dunnett’s multiple comparison test, comparing each time-point to time 0 h within each condition. * denotes P value=<0.05; **=<0.01; ***=<0.001; ****=<0.0001. D NAD+ and cADPR and NMN levels, and relative cADPR/NAD+ ratio from primary eDRG neurons from wild-type or Sarm1−/− mice after treatment with 2 h CZ-48 [250 μM], FK866 24 h [100 nM], or FK866 24 h [100 nM] + 2 h CZ-48 [250 μM], relative to untreated control, measured by LC-MS-MS. Data correspond to means from replicate experiments and error bars denote ±SEM. Statistical significance was determined by unpaired t-tests with corrections for multiple comparisons using the Holm-Sidak method, comparing wild-type to Sarm1−/− for each condition (NAD+, cADPR, and cADPR/NAD+), or two-way ANOVA with correction for multiple comparisons using the Holm-Sidak method, comparing each condition to untreated within each genotype (NMN). * denotes P value=<0.05; **=<0.01; ***=<0.001; ****=<0.0001. E Schematic of NAD+ pathway and experimental manipulations used in Figures 1 and 2. A summary table of experimental conditions from Figures 1 and 2 and their effects on NMN and NAD+ levels, the NMN/NAD+ ratio, and SARM1 NADase activity. See also Figure S2.
Figure 3.
Figure 3.
NMN/NAD+ ratio controls NADase activity of recombinantly produced SARM1. A Increasing the NMN/NAD+ ratio by raising the NMN concentration (5–500 μM) leads to higher NAD+-cleavage activity by hSARM1 (500 nM). Initial NAD+ concentration was 2000 μM for all NMR samples. The mean and range of two experiments are shown. B Increasing the NMN/NAD+ ratio by lowering initial NAD+ concentration (8 mM – 500 uM) leads to higher NAD+ cleavage activity by hSARM1 (500 nM). The NMN concentration was 50 μM for all NMR samples. Only data from the initial 4 h are shown as the reaction for the 500 μM NAD sample was almost complete by 4 h. The mean and range of two experiments are shown. C Integrated (left) and raw (right) ITC data for the titration of 0.4 mM NMN with 60 μM dSARM1ARM and 1 mM NAD+ with 80 μM dSARM1ARM. D Overlay of 15N-TROSY-HSQC NMR spectra, showing the effect of NMN (0.15 mM, purple) and NAD+ (0.15 mM, green) binding to 15N-labelled dSARM1ARM (0.15 mM, black). The inset shows an expansion of the tryptophan indole chemical shift region of the spectrum, where NMN addition causes a larger chemical shift change, and in the opposite direction, than addition of NAD+. E Expansions of STD NMR spectra, showing saturation-transfer signals in the aromatic region for dSARM1ARM (40 μM) interactions with NMN (1 mM), NAD+ (1 mM), and NMN plus NAD+ (1 mM of each). See also Figure S3.
Figure 4.
Figure 4.
Crystal structure of NMN-bound dSARM1ARM. A Crystal structure of dSARM1ARM (cartoon representation) interacting with NMN (stick representation). B Interaction between dSARM1ARM and NMN (stick representation). Hydrogen bonds are shown as yellow dashed lines, labelled with distances in Å. The phosphate of NMN occupies two alternative positions. The predicted NMN binding residues in hSARM1 are shown in parentheses. See also Figure S4 and S5 and Table S1, S2 and S3.
Figure 5.
Figure 5.
Cryo-EM structure of hSARM1. A A schematic representation of the hSARM1 domain architecture. B Electrostatic potential density map of the hSARM1 octamer. C Cartoon representation of the hSARM1 octamer. D Structural superpositions of NMN-bound dSARM1ARM (slate; residues 373–676), ligand-free hSARM1 (magenta; residues 90–400) and NAD+-bound hSARM1 (cyan; PDB: 7CM6; residues 90–400; (Jiang et al., 2020)). The ARM:TIR interface is indicated by a dashed black box. E Structural superposition of the NMN-binding site in NMN-bound dSARM1ARM (slate) and the NAD+-binding site in NAD+-bound hSARM1 (cyan; PDB:7CM6; (Jiang et al., 2020)). The structures were aligned using residues W385 and T433 in dSARM1ARM and W103 and V153 in hSARM1. NMN and NAD+ are shown in green and yellow stick representation, respectively. Labelled residues correspond to dSARM1, with equivalent hSARM1 residues shown in parentheses. F Structural superposition of ARM8 in NMN-bound dSARM1ARM (slate) and ligand-free hSARM1 (magenta) suggests that the ARM domain would rotate and potentially clash with the ARM domain of adjacent subunits (magenta) upon NMN binding. Structure movements are indicated by black dashed arrows and SAM-TIR distances are indicated by dashed lines. Helices are presented as cylinders. See also Figure S6 and Table S4.
Figure 6.
Figure 6.
Mutations in the NMN-binding pocket of human SARM1 block NMN- and injury-dependent SARM1 activation. A Multiple binding-site mutants disrupt NMN-activation of hSARM1 (500 nM) enzyme activity. The NMN concentration was 500 μM for all NMR samples. B STD NMR spectra showing NMN (500 μM) binding to hSARM1 mutants (5.25 μM). C cADPR levels from primary eDRG neurons from Sarm1−/− mice expressing wild-type or mutant SARM1 from lentivirus for 5 days, untreated or after 1 h NR [100 μM] treatment, relative to levels from untreated wild-type SARM1 expressing neurons, measured by LC-MS-MS. Data correspond to means from replicate experiments. The box represents the 25–75% and the whiskers extend to maximum and minimum values, to include all data points. Statistical significance was determined by unpaired t-tests comparing untreated to NRK + NR 1 h conditions. Lines connect paired data from individual biological replicates. Two-way ANOVA with Dunnett’s test for multiple comparisons was used to compare untreated SARM1 to untreated SARM1 L152A and R157E. * denotes P value=<0.05; **=<0.01; ***=<0.001; ****=<0.0001. D Axon degeneration time course after axotomy in primary eDRG neurons from Sarm1−/− mice expressing wild-type or mutant SARM1 from lentivirus, quantified as degeneration index (DI), where a DI of 0.35 or above represents degenerated axons. Data correspond to means from replicate experiments and error bars denote ±SEM. Statistical significance was determined by two-way ANOVA with Dunnett’s multiple comparison test, comparing each time-point to time 0 h within each condition. * denotes P value=<0.05; **=<0.01; ***=<0.001; ****=<0.0001. See also Figure S7.
Figure 7.
Figure 7.
Schematic model of SARM1 activation. In the inactive state, the ARM domain (magenta) interacts with the TIR domain (blue), separating it from the neighboring TIR domains. Upon injury, NMN interaction induces a more compact conformation of the ARM domain (grey), which leads to destabilization of the peripheral ARM domain ring, and disruption of the ARM:TIR lock. This permits the TIR domains to associate with each other, form the catalytic site, cleave NAD+, and trigger axon degeneration. The SAM domains are shown in lime.

Comment in

References

    1. Afonine PV, et al. (2012). Towards automated crystallographic structure refinement with phenix.refine. Acta Crystallogr. D Biol. Crystallogr 68, 352–367. - PMC - PubMed
    1. Afonine PV, Klaholz BP, Moriarty NW, Poon BK, Sobolev OV, Terwilliger TC, Adams PD, and Urzhumtsev A (2018). New tools for the analysis and validation of cryo-EM maps and atomic models. Acta Crystallogr. D Biol. Crystallogr 74, 814–840. - PMC - PubMed
    1. Araki T, Sasaki Y, and Milbrandt J (2004). Increased nuclear NAD biosynthesis and SIRT1 activation prevent axonal degeneration. Science 305, 1010–1013. - PubMed
    1. Bepler T, Morin A, Rapp M, Brasch J, Shapiro L, Noble AJ, and Berger B (2019). Positive-unlabeled convolutional neural networks for particle picking in cryo-electron micrographs. Nat. Methods 16, 1153–1160. - PMC - PubMed
    1. Berendsen HJC, Postma JPM, van Gunsteren WF, DiNola A, and Haak JR (1984). Molecular dynamics with coupling to an external bath. J. Chem. Phys 81, 3684–3690.

Publication types

MeSH terms