. 2021 Apr 14;29(4):551-563.e5.
doi: 10.1016/j.chom.2021.02.019. Epub 2021 Feb 25.

Robust SARS-CoV-2 infection in nasal turbinates after treatment with systemic neutralizing antibodies

Affiliations

Robust SARS-CoV-2 infection in nasal turbinates after treatment with systemic neutralizing antibodies

Dongyan Zhou et al. Cell Host Microbe. .

Abstract

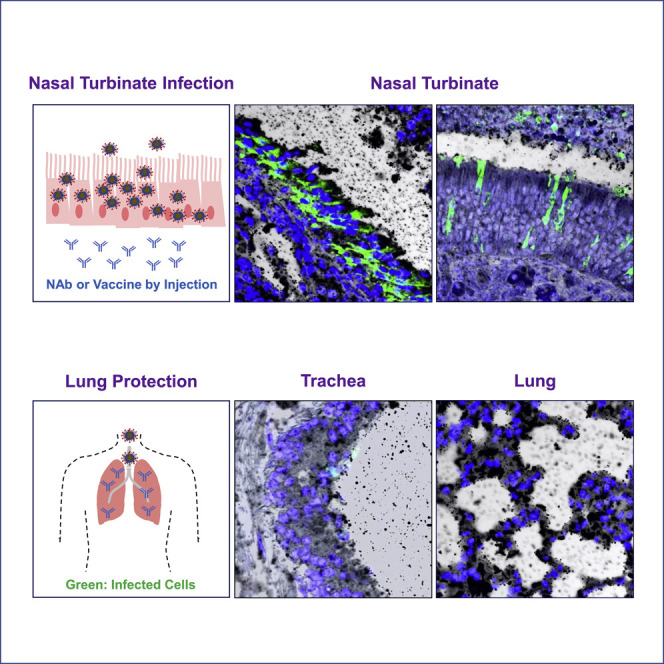
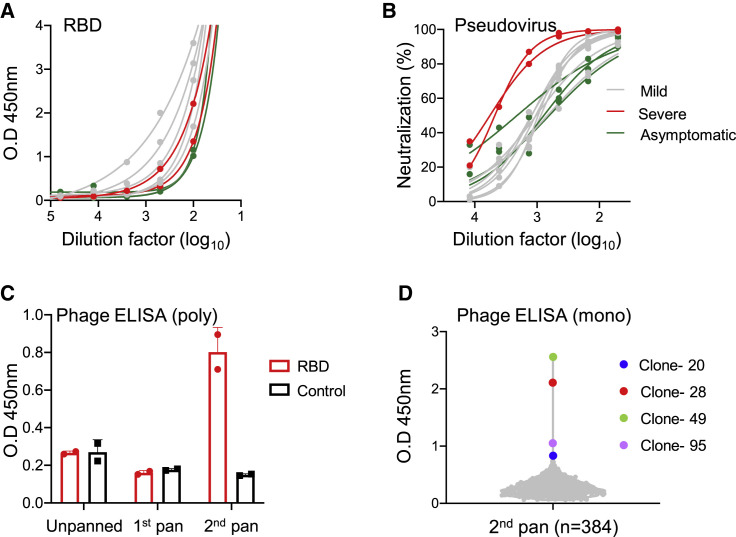
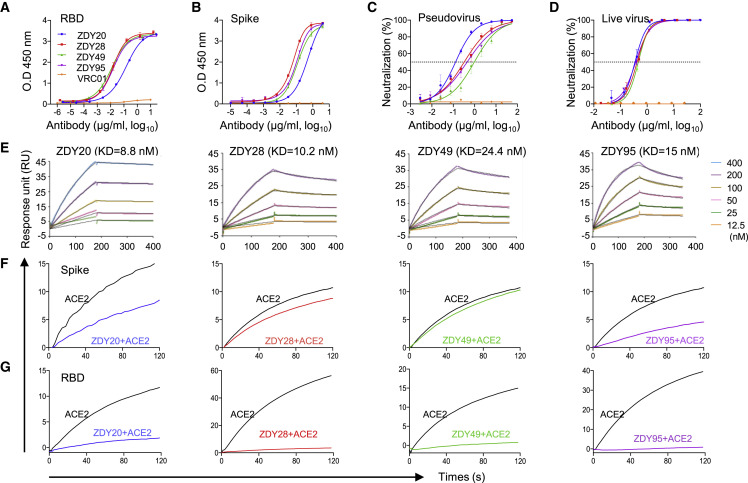
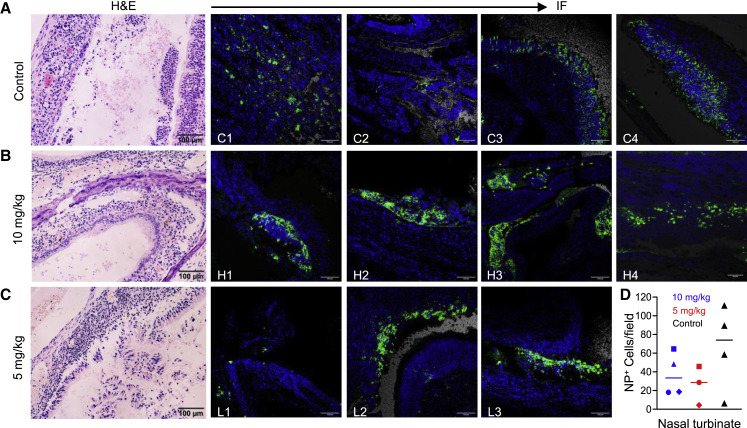
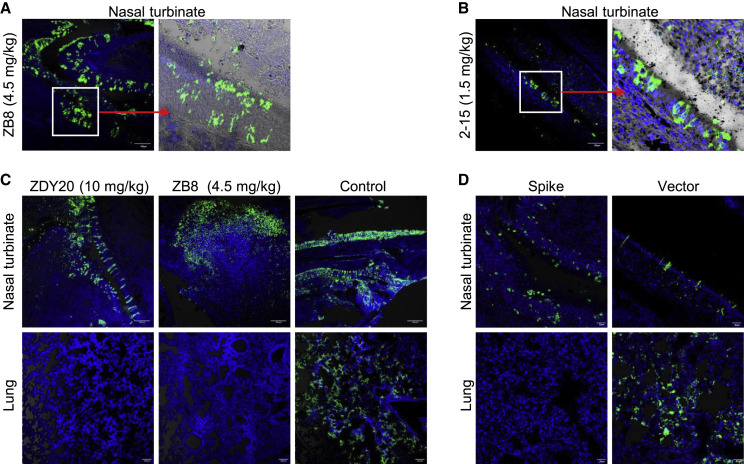
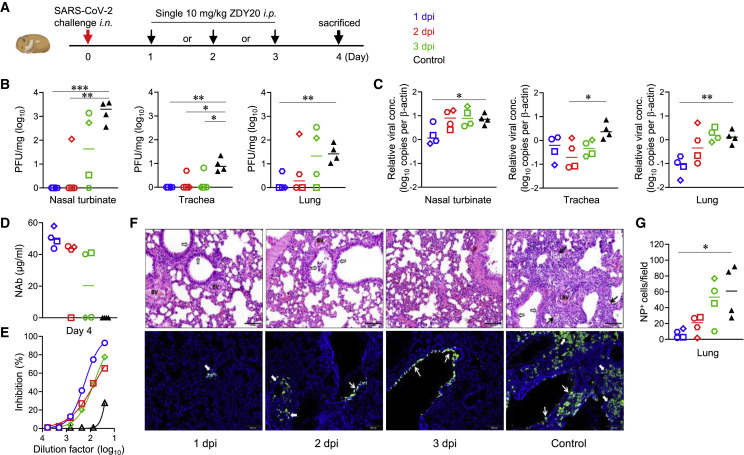
Severe acute respiratory syndrome coronavirus 2 (SARS-CoV-2) is characterized by a burst in the upper respiratory portal for high transmissibility. To determine human neutralizing antibodies (HuNAbs) for entry protection, we tested three potent HuNAbs (IC50 range, 0.0007-0.35 μg/mL) against live SARS-CoV-2 infection in the golden Syrian hamster model. These HuNAbs inhibit SARS-CoV-2 infection by competing with human angiotensin converting enzyme-2 for binding to the viral receptor binding domain (RBD). Prophylactic intraperitoneal or intranasal injection of individual HuNAb or DNA vaccination significantly reduces infection in the lungs but not in the nasal turbinates of hamsters intranasally challenged with SARS-CoV-2. Although postchallenge HuNAb therapy suppresses viral loads and lung damage, robust infection is observed in nasal turbinates treated within 1-3 days. Our findings demonstrate that systemic HuNAb suppresses SARS-CoV-2 replication and injury in lungs; however, robust viral infection in nasal turbinate may outcompete the antibody with significant implications to subprotection, reinfection, and vaccine.

Keywords: COVID-19; SARS-CoV-2; human neutralizing antibody; lung injury; nasal turbinate; phage display; receptor binding domain; upper respiratory tract.


Conflict of interest statement

Declaration of interests J.F.-W.C. has received travel grants from Pfizer Corporation Hong Kong and Astellas Pharma Hong Kong Corporation Limited and was an invited speaker for Gilead Sciences Hong Kong Limited and Luminex Corporation. The other authors declare no conflicts of interest except for a provisional patent application filed for human monoclonal antibodies generated in our laboratory by the University of Hong Kong. The funding sources had no role in study design, data collection, analysis, interpretation, or writing of the report.

Figures

None
Graphical abstract
Figure 1
Figure 1
Screening of SARS-CoV-2 neutralizing antibodies from convalescent patients (A) Humoral immune responses to SARS-CoV-2 were analyzed in each patient by endpoint ELISA for binding to viral RBD. (B) The pseudovirus assay was used to measure neutralization activity. Color-coded lines showed antibody responses from patients categorized according to disease severity. (C and D) A phage-displayed antibody Fab library (C) and monoclonal phage colonies (D) were tested against RBD by ELISA throughout the panning procedure. Unpanned phage library, first round and second round amplified phage polyclones (poly) were tested at a 1:5 dilution by phage ELISA. An unrelated antigen was used as a control. A total of 384 single colonies (mono) were picked and verified for binding with RBD by ELISA. The four strongest single-phage binders were color coded and named according to the clone numbers. See also Figures S1–S3 and Tables S1, S2, and S7.
Figure 2
Figure 2
In vitro characterization of SARS-CoV-2-specific HuNAbs (A) Binding profiles of four color-coded candidate HuNAbs (ZDY20, 28, 49, and 95) to viral RBD were determined. HIV-1-specific HuNAb VRC01 served as a negative control. (B) Binding profiles of four HuNAbs to viral SARS-CoV-2 spike trimer were also determined. (C) Neutralization activities of four candidate HuNAbs were tested against pseudovirus in 293T-ACE2 cells. (D) Four candidate HuNAbs were also tested against live SARS-CoV-2 in Vero-E6 cells. Both neutralization assays were performed in triplicate wells, and the results are shown as the mean ± SEM. (E) Binding kinetics of four candidate HuNAbs to SARS-CoV-2 spike trimer protein by the SPR. The black lines indicate the experimentally derived curves, whereas the colored lines represent fitted curves from serially diluted antibody concentrations injected in the experiment. The KD results are representative of two independent experiments. (F and G) HuNAb competition with ACE2 for binding to SARS-CoV-2 spike trimer (F) and soluble RBD (G) measured by the SPR. The plots show distinct binding patterns of ACE2 to the spike or RBD protein with (colored curve) or without (black curve) prior incubation with each tested HuNAb. The results are representative of two independent experiments and color coded for each HuNAb. See also Tables S3 and S4.
Figure 3
Figure 3
Efficacy of ZDY20 prophylaxis against live SARS-CoV-2 in Syrian hamsters (A) Experimental schedule and color coding for three experimental groups. Two groups of hamsters received a single intraperitoneal injection of ZDY20 at doses of 10 mg/kg (n = 4) and 5 mg/kg (n = 3) one day before the live virus challenge (−1 dpi). Another group was given the control antibody VRC01 at 10 mg/kg (n = 4). On day 0, each hamster was intranasally inoculated with a challenge dose of 100 μL of Dulbecco’s modified Eagle medium containing 105 plaque-forming units of SARS-CoV-2 (HKU-001a strain, GenBank accession no: MT230904.1). The hamsters were sacrificed at 4 dpi for analysis. (B) Infectious virions were tested by viral plaque assay in nasal turbinate, trachea, and lung tissue homogenates. PFUs per mg of tissue extractions were compared between different groups in log10-transformed units. (C) The relative viral concentration (normalized by β-actin) was determined in nasal turbinate, trachea, and lung tissue homogenates by the sensitive RT-PCR assay. (D and E) Serum concentration (D) and neutralizing activity (E) of HuNAb ZDY20 were determined by ELISA and pseudovirus assays, respectively. Open symbols represent corresponding samples collected at 4 dpi in the same color-coding groups. (F) Representative images of hamster lung tissues by H&E (100×, left panel) and immunofluorescence (IF) staining (50×, right panel). For viral NP antigen in the sections (50×) stained by IF, the lungs of control hamsters showed diffuse NP expression in large areas of alveoli (thick arrows) and in bronchiolar epithelium (thin arrows). SARS-CoV-2 N protein (NP) was stained green, and cell nuclei were counterstained with DAPI (blue). No NP expression was observed in lung sections of hamsters treated with high-dose antibody (10 mg/kg). In low-dose antibody-treated hamsters, NP expression was occasionally observed in a small area of alveoli (thick arrows) and in the epithelium of a few bronchiolar sections (thin arrows). (G) NP+ cells per 50×field were compared in the lungs of three experimental groups. Data of individual animals were indicated by different symbols, and different colors represented different groups. Statistics were generated using ordinary one-way ANOVA and multiple comparisons test. p < 0.05; ∗∗p < 0.01; ∗∗∗p < 0.001. See also Figures S4 and S9 and Table S5.
Figure 4
Figure 4
Robust SARS-CoV-2 infection in nasal turbinates at 4 dpi in the HuNAb ZDY20 prophylaxis experiment by H&E and IF staining (A) H&E staining showed that both the respiratory epithelium (left) and olfactory epithelium (right) are affected by extensive submucosal infiltration and epithelial cell death, resulting in loss of the whole surface layer of epithelial cells. The nasal cavity contains exudates mixed with red blood cells and immune cells. The images of IF staining showed the abundancy and distribution of NP+ cells in the nasal turbinates of each control animal (C1-4). SARS-CoV-2 N protein (NP) was stained green, and cell nuclei were counterstained with DAPI (blue). (B) H&E staining showed submucosal immune cell infiltration and a large amount of epithelial cell desquamation. The images of IF staining showed the abundancy and distribution of NP+ cells in the nasal turbinates of each animal that received the high dose of 10 mg/kg ZDY20 (H1-4). (C) Similarly, H&E staining showed submucosal immune cell infiltration and a large amount of epithelial cell desquamation. The images of IF staining showed the abundancy and distribution of NP+ cells in the nasal turbinate of each animal that received the low dose of 5 mg/kg ZDY20 (L1-3). (D) NP+ cells per 50×field were compared in nasal turbinates of three animal groups. Data of individual animals were indicated by different symbols, and different colors represented different groups. See also Figure S4.
Figure 5
Figure 5
Robust SARS-CoV-2 infection in nasal turbinates at 4 dpi in the intraperitoneally injected HuNAb ZB8 and 2-15, intranasally administrated ZDY20 and ZB8, and DNA vaccine prophylaxis experiments SARS-CoV-2 NP was stained green by IF staining, and cell nuclei were counterstained with DAPI (blue). (A and B) Representative images of IF staining in nasal turbinates of hamsters intraperitoneally injected with 4.5 mg/kg ZB8 (A) and 1.5 mg/kg 2-15 (B), respectively, 24 h before the live virus challenge (Figures S5 and S6). The images of IF staining showed the abundancy and distribution of NP+ cells at 50× magnification. The inset image was enlarged at 100× magnification to show that infected NP+ cells can reach toward mucosal epithelial surface. (C) Representative images of IF staining of hamster lung (bottom) and nasal turbinate (top) in the intranasal HuNAb prophylaxis experiment (Figure S7). The animals were intranasally administrated with 10 mg/kg ZDY20 and 4.5 mg/kg ZB8, respectively, 12 h before the live virus challenge. The images showed abundant and diffused distribution of NP+ cells in the nasal turbinates but not in the lungs. Control animals showed diffused NP+ expression in both nasal turbinates and lungs. Images were shown at the 50× magnification. (D) Representative images of IF staining of hamster nasal turbinate (top) and lung (bottom) in the spike-based DNA vaccine experiment (Figure S8). The images of IF staining showed the abundancy and distribution of NP+ cells in nasal turbinate but few in lung of a representative vaccinated hamster. The vector control hamster had abundant NP+ cells both in nasal turbinate and lung. Images were shown at the 100× magnification. See also Figures S4–S7 and Table S6.
Figure 6
Figure 6
Postchallenge ZDY20 therapy suppresses SARS-CoV-2 replication in the lungs and acute lung injury (A) Experimental schedule and color coding for each experimental group. After the live intranasal SARS-CoV-2 challenge, three groups of hamsters (n = 4 per group) received a single intraperitoneal injection of 10 mg/kg ZDY20 at 1, 2, or 3 dpi. The hamsters were sacrificed at 4 dpi for final analysis. (B) A viral plaque assay was used to quantify infectious viruses in nasal turbinate, trachea, and lung tissue homogenates. Log10-transformed PFUs per mg of tissue extractions were compared between treated hamsters at different time points and control animals. (C) Sensitive RT-PCR was used to quantify the viral RNA copy numbers (normalized by β-actin) in nasal turbinate, trachea, and lung tissue homogenates. (D and E) Serum concentration (D) and neutralizing activity (E) of HuNAb ZDY20 were determined by ELISA and pseudovirus assays, respectively. (F) Representative images of hamster lung tissues by H&E (100×, top panel) and IF (50×, bottom panel). For the H&E staining results, the lungs of control hamsters showed peribronchiolar infiltration and bronchiolar epithelial cell death (open arrows), diffuse alveolar wall thickening, and patchy areas of alveolar space infiltration and exudation (arrows). One blood vessel in the middle of the section showed vasculitis (BV, blood vessel). For IF-stained viral NP antigen in the sections (50×), the lungs of control hamsters showed NP expression in bronchiolar epithelium (thin arrows) and diffuse NP expression in large areas of alveoli (thick arrows). SARS-CoV-2 NP was stained green, and cell nuclei were counterstained with DAPI (blue). In ZDY20-treated hamsters, NP expression was much confined to a small area of alveoli (thick arrows) or in the epithelia of bronchioles (thin arrows). (G) NP+ cells per 50×field were compared in the lungs of four experimental groups. Data of individual animals were indicated by different symbols, and different colors represented different groups. Statistics were generated using ordinary one-way ANOVA and multiple comparisons test. p < 0.05; ∗∗p < 0.01; ∗∗∗p < 0.001. See also Figures S4 and S9 and Table S5.
Figure 7
Figure 7
Postchallenge ZDY20 therapy does not suppress SARS-CoV-2 replication in nasal turbinates considerably by IF staining and correlation analysis (A) Abundant numbers of NP+ cells in nasal turbinates of hamsters treated at 1, 2, and 3 dpi compared with the untreated control animal. SARS-CoV-2 NP was stained green, and cell nuclei were counterstained with DAPI (blue). Images were shown at the 50× magnification. (B) There were no significant differences among the nasal turbinates from four groups of experimental hamsters for NP+ cells per 50×field. (C) A negative correlation was found between NP+ cells per 50×field in the lungs and the amount of peripheral ZDY20. No significant correlation was found between NP+ cells per 50×field in nasal turbinates and the amount of peripheral ZDY20. (D) There was a significant negative correlation between the tissue antibody concentration of ZDY20 and the number of infectious viral particles (PFUs) either in lung or in nasal turbinate homogenates. Correlation analyses were performed by linear regression using GraphPad Prism 6.0. Color-coded and different shapes of symbols were consistent with those in Figures 3 and 6. See also Figures S4, S6, S7, and S9 and Tables S5 and S6.

Similar articles

Cited by

References

    1. Baum A., Ajithdoss D., Copin R., Zhou A., Lanza K., Negron N., Ni M., Wei Y., Mohammadi K., Musser B., et al. REGN-COV2 antibodies prevent and treat SARS-CoV-2 infection in rhesus macaques and hamsters. Science. 2020;370:1110–1115. - PMC - PubMed
    1. Boulware D.R., Pullen M.F., Bangdiwala A.S., Pastick K.A., Lofgren S.M., Okafor E.C., Skipper C.P., Nascene A.A., Nicol M.R., Abassi M., et al. A Randomized Trial of Hydroxychloroquine as Postexposure Prophylaxis for Covid-19. N. Engl. J. Med. 2020;383:517–525. - PMC - PubMed
    1. Cao Y., Su B., Guo X., Sun W., Deng Y., Bao L., Zhu Q., Zhang X., Zheng Y., Geng C., et al. Potent Neutralizing Antibodies against SARS-CoV-2 Identified by High-Throughput Single-Cell Sequencing of Convalescent Patients’ B Cells. Cell. 2020;182:73–84.e16. - PMC - PubMed
    1. Chames J.M.P. In: Antibody Engineering: Methods and Protocols. Second Edition. Chames P., editor. Humana Press Inc.; 2012. Phage display and selections on purified antigens; pp. 213–224. - PubMed
    1. Chan J.F.-W., Zhang A.J., Yuan S., Poon V.K.-M., Chan C.C.-S., Lee A.C.-Y., Chan W.-M., Fan Z., Tsoi H.-W., Wen L., et al. Simulation of the clinical and pathological manifestations of Coronavirus Disease 2019 (COVID-19) in golden Syrian hamster model: implications for disease pathogenesis and transmissibility. Clinical Infectious Diseases. 2020;71:2428–2446. - PMC - PubMed

Publication types

Substances