

Fetal sex modulates placental microRNA expression, potential microRNA-mRNA interactions, and levels of amino acid transporter expression and substrates: INFAT study subpopulation analysis of n-3 LCPUFA intervention during pregnancy and associations with offspring body composition
- PMID: 33657992
- PMCID: PMC7931339
- DOI: 10.1186/s12860-021-00345-x
Fetal sex modulates placental microRNA expression, potential microRNA-mRNA interactions, and levels of amino acid transporter expression and substrates: INFAT study subpopulation analysis of n-3 LCPUFA intervention during pregnancy and associations with offspring body composition
Abstract
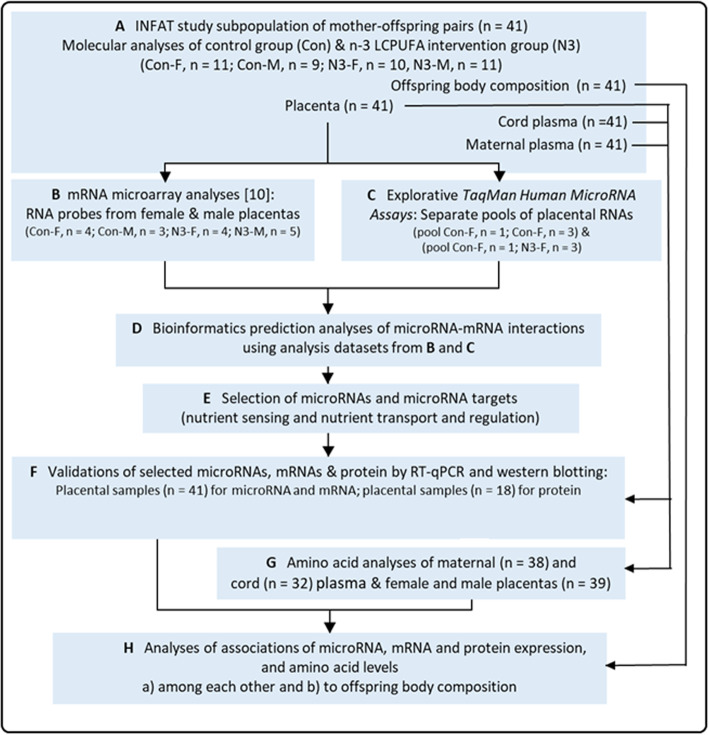
Background: Previously, we revealed sexually dimorphic mRNA expression and responsiveness to maternal dietary supplementation with n-3 long-chain polyunsaturated fatty acids (LCPUFA) in placentas from a defined INFAT study subpopulation. Here, we extended these analyses and explored the respective placental microRNA expression, putative microRNA-mRNA interactions, and downstream target processes as well as their associations with INFAT offspring body composition.
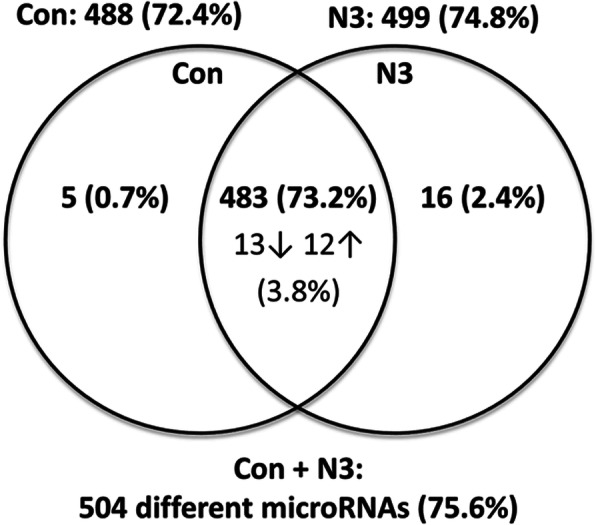
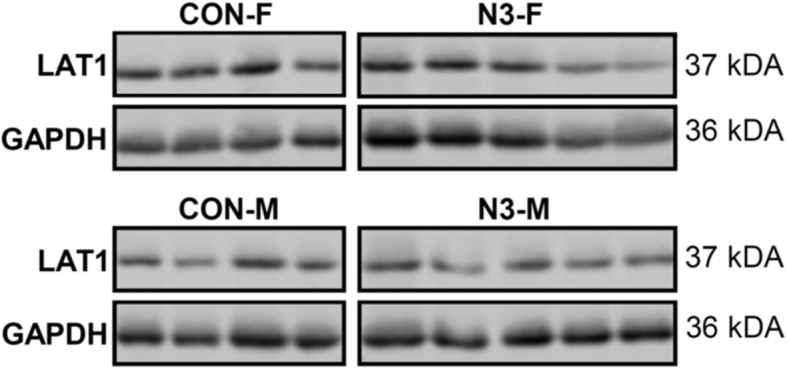
Results: We performed explorative placental microRNA profiling, predicted microRNA-mRNA interactions by bioinformatics, validated placental target microRNAs and their putative targets by RT-qPCR and western blotting, and measured amino acid levels in maternal and offspring cord blood plasma and placenta. microRNA, mRNA, protein, and amino acid levels were associated with each other and with offspring body composition from birth to 5 years of age. Forty-six differentially regulated microRNAs were found. Validations identified differential expression for microRNA-99a (miR-99a) and its predicted target genes mTOR, SLC7A5, encoding L-type amino acid transporter 1 (LAT1), and SLC6A6, encoding taurine transporter (TauT), and their prevailing significant sexually dimorphic regulation. Target mRNA levels were mostly higher in placentas from control male than from female offspring, whereas respective n-3 LCPUFA responsive target upregulation was predominantly found in female placentas, explaining the rather balanced expression levels between the sexes present only in the intervention group. LAT1 and TauT substrates tryptophan and taurine, respectively, were significantly altered in both maternal plasma at 32 weeks' gestation and cord plasma following intervention, but not in the placenta. Several significant associations were observed for miR-99a, mTOR mRNA, SLC7A5 mRNA, and taurine and tryptophan in maternal and cord plasma with offspring body composition at birth, 1 year, 3 and 5 years of age.
Conclusions: Our data suggest that the analyzed targets may be part of a sexually dimorphic molecular regulatory network in the placenta, possibly modulating gene expression per se and/or counteracting n-3 LCPUFA responsive changes, and thereby stabilizing respective placental and fetal amino acid levels. Our data propose placental miR-99, SLC7A5 mRNA, and taurine and tryptophan levels in maternal and fetal plasma as potentially predictive biomarkers for offspring body composition.
Keywords: Adipose tissue; Amino acid transport; Fetal programming; MicroRNA; N-3 long-chain polyunsaturated fatty acids; Placenta; Sexual dimorphism.
Conflict of interest statement
The authors declare that they have no competing interests.
Figures
References
MeSH terms
Substances
Grants and funding
LinkOut - more resources
Full Text Sources
Other Literature Sources
Molecular Biology Databases
Research Materials
Miscellaneous
