. 2021 Mar 4;7(1):6.
doi: 10.1186/s40795-021-00408-4.

The fermented soy beverage Q-CAN® plus induces beneficial changes in the oral and intestinal microbiome

Affiliations

The fermented soy beverage Q-CAN® plus induces beneficial changes in the oral and intestinal microbiome

Evangelos Dioletis et al. BMC Nutr. .

Abstract

Background: Soy products are associated with many beneficial health consequences, but their effects on the human intestinal microbiome are poorly characterized.

Objectives: To identify the changes in the oral and fecal microbiome in lean and obese participants due to consumption of Q-CAN®, and to assess the expected consequences of these changes based on the published literature.

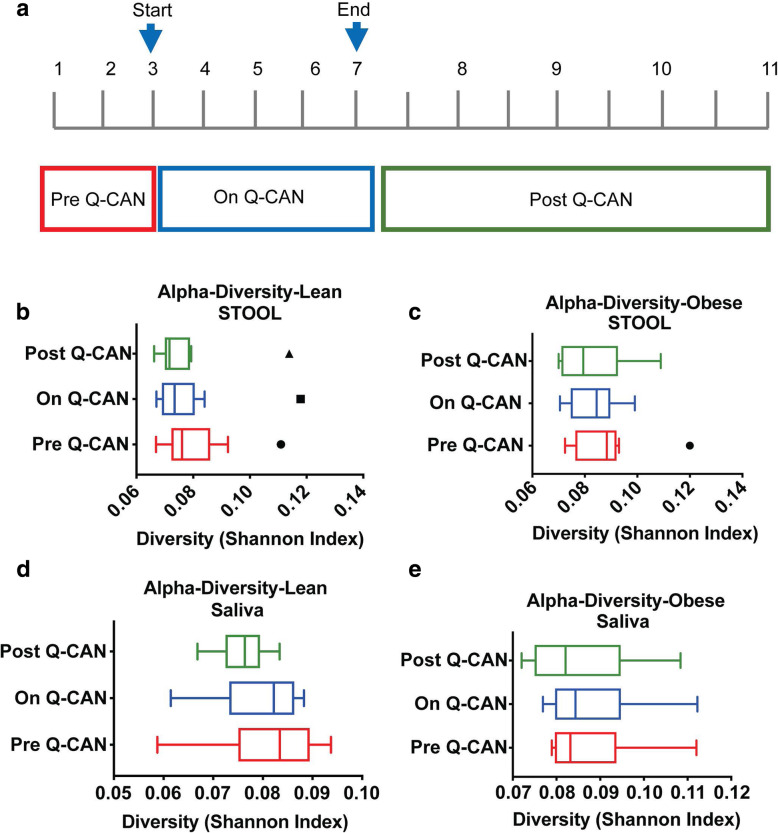
Methods: Prospective study of lean (10) and obese (9) participants consuming Q-CAN® twice daily for 4 weeks with 8 weeks follow-up. Microbial DNA was extracted from saliva and stool samples, amplified against the V4 region of the 16S ribosomal RNA gene and data analyzed using QIIME 1.9.1 bioinformatics. Four hundred forty-four samples were collected in total, 424 of which were productive and yielded good quality data.

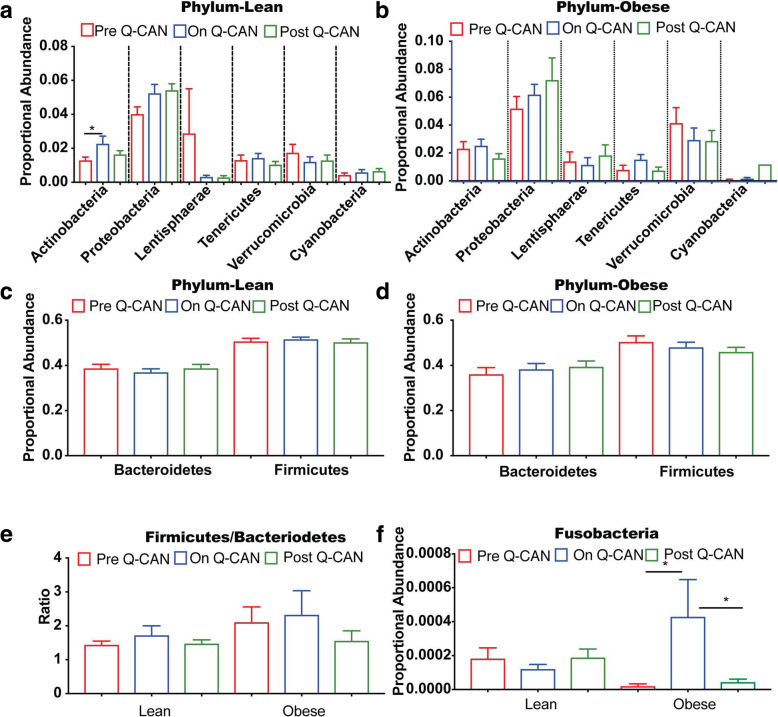
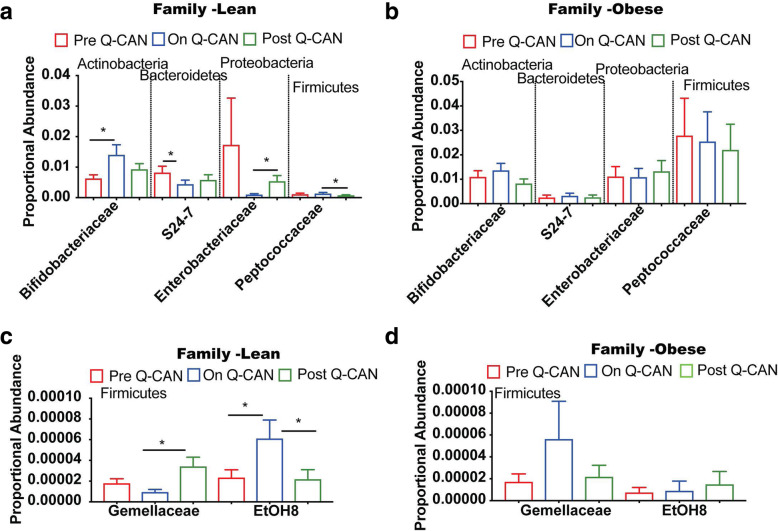
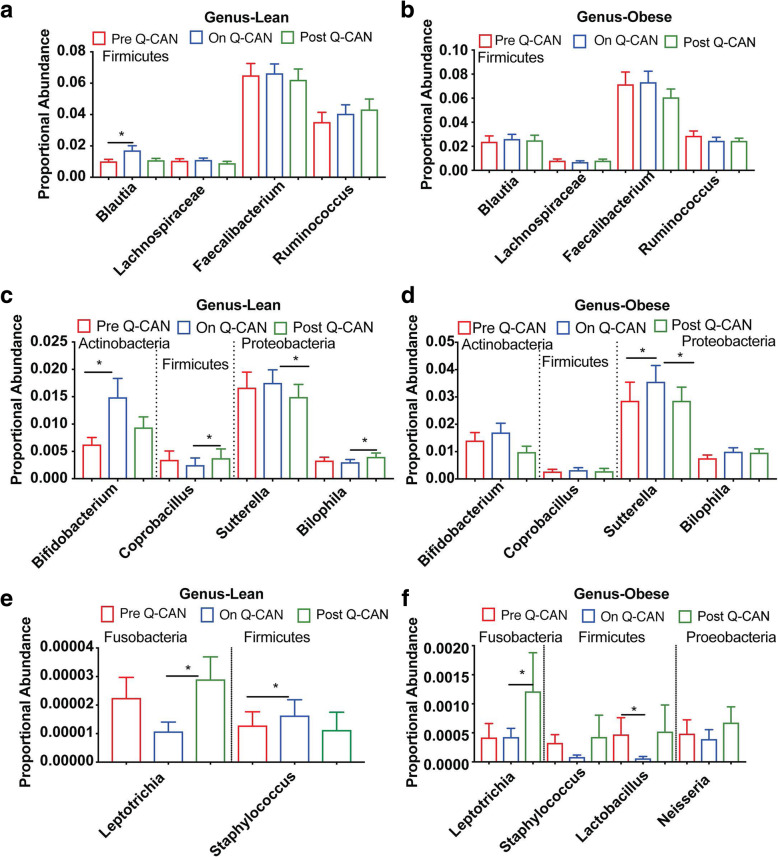
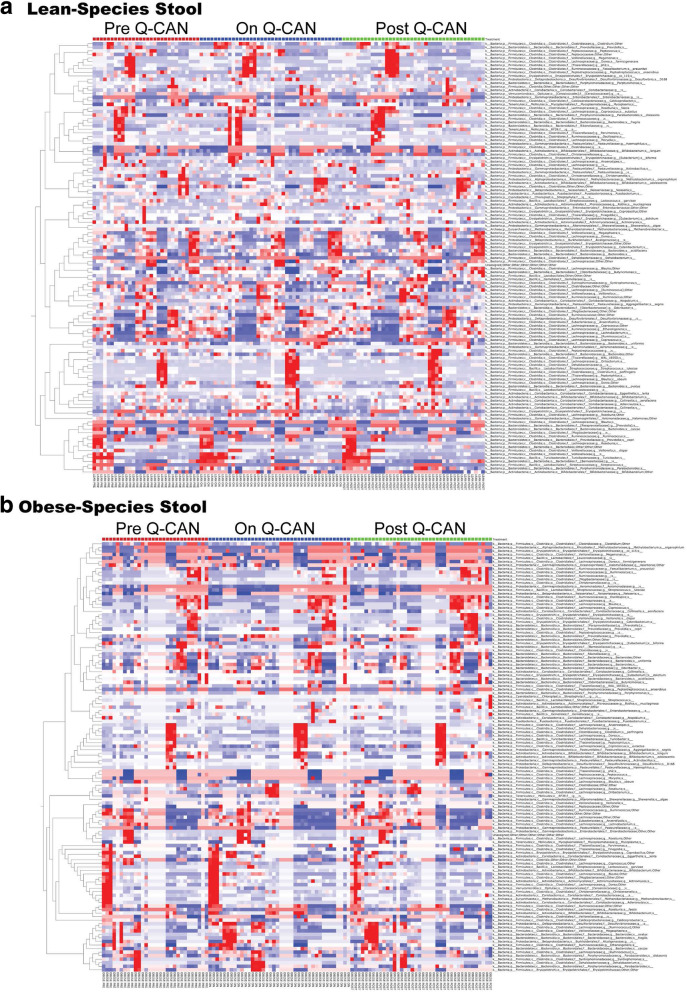
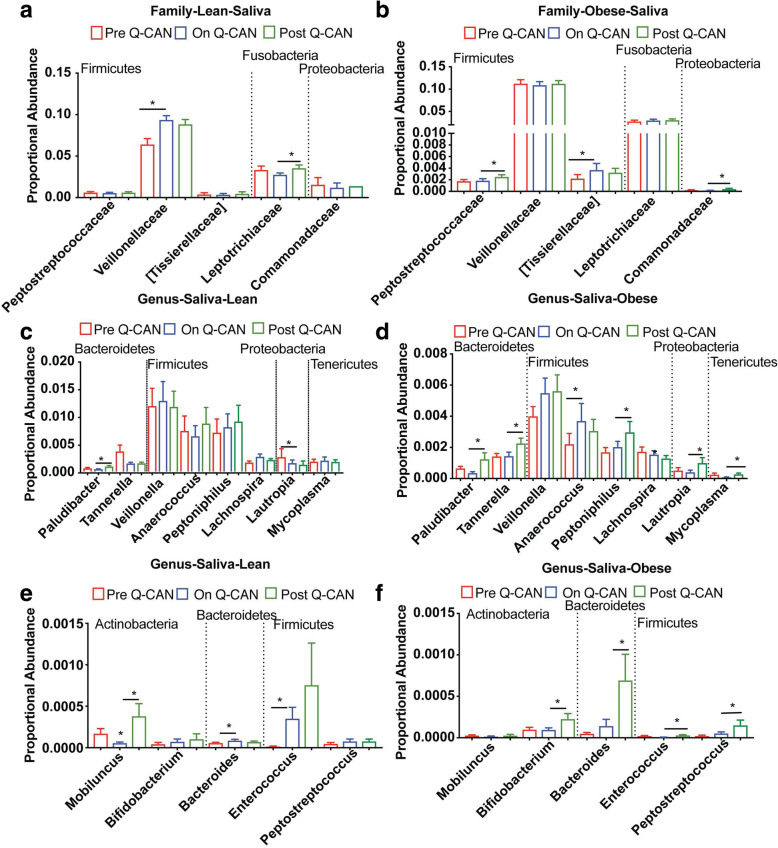
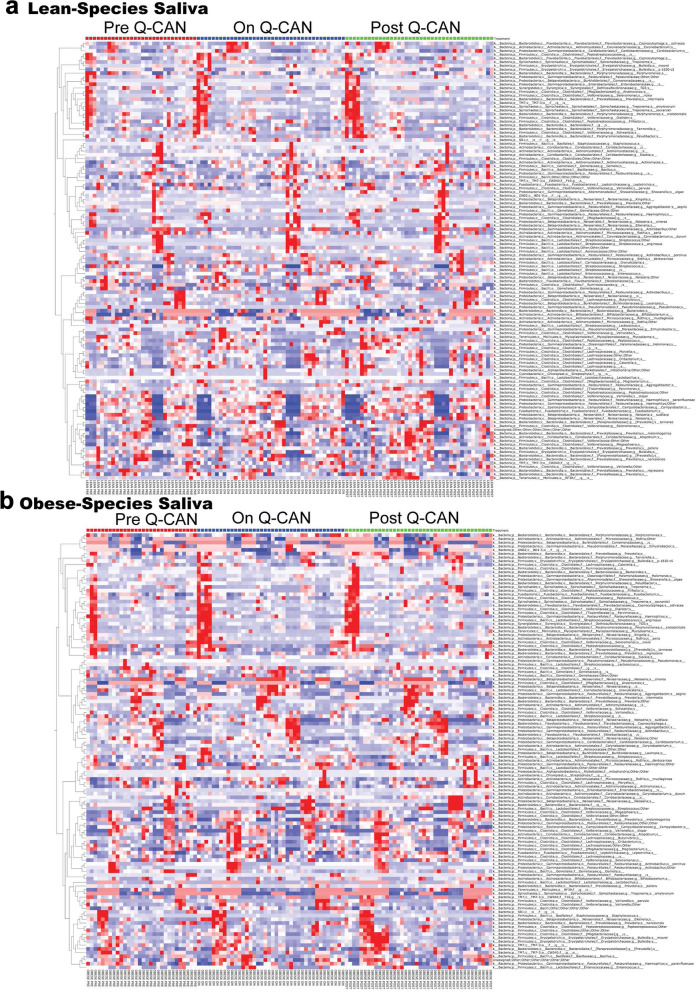
Results: STOOL. In the lean population Bifidobacteria and Blautia show a significant increase while taking Q-CAN®, and there was a trend for this in the obese population. ORAL. There were relatively fewer major changes in the oral microbiome with an increase in the family Veillonellaceae in the lean population while on Q-CAN®.

Conclusion: Q-CAN® consumption induced a number of significant changes in the fecal and oral microbiome. Most notably an increase in the stool microbiome of Bifidobacteria and Blautia, both of which are associated with positive health benefits, and in the saliva an increase in Veillonellaceae.

Trial registration: This trial was registered with Clinicaltrials.gov on January 14th 2016. ClinicalTrials.gov Identifier: NCT02656056.

Keywords: Commensals; Gut microbiome; Obesity; Oral microbiome; Soy.


Conflict of interest statement

There are no competing interests.

Figures

Fig. 1
Fig. 1
a Depiction of the time-frame of Q-CAN® consumption or withdrawal. b-d Shannon Diversity Index of intestinal or oral microbiome is not altered upon Q-CAN® consumption or withdrawal in lean or obese people. The results are the average of 3 visits in pre Q-CAN® group, 4 visits in on Q-CAN® group and 4 visits in post Q-CAN® group for each participant. Obese (n = 9 participants), Lean (n = 10 participants). The data are presented as Tukey box plots showing the median values
Fig. 2
Fig. 2
Intestinal microbiome analysis at the level of Phylum. a-f Bacteria at Phylum level in both lean and obese shows that only Actinobacteria and Fusobacteria are altered upon Q-CAN® consumption. e The ratio of Firmicutes/Bacteroidetes has a trend for increase in obese compared to lean ones. The results are the average of 3 visits in pre Q-CAN® group, 4 visits in on Q-CAN® group and 4 visits in post Q-CAN® group for each participant. Obese (n = 9 participants), Lean (n = 10 participants). The data are presented as median with SEM, *p < 0.05
Fig. 3
Fig. 3
Intestinal microbiome analysis at the level of Family. A-D) Bacteria at Family level in both lean and obese shows that only Bifidobacteriaea, S24–7 and EtOH8 are altered upon Q-CAN® consumption. The results are the average of 3 visits in pre Q-CAN® group, 4 visits in on Q-CAN® group and 4 visits in post Q-CAN® group for each participant. Obese (n = 9 participants), Lean (n = 10 participants). The data are presented as median with SEM, *p < 0.05
Fig. 4
Fig. 4
Intestinal microbiome analysis at the level of genus. a-f Bacteria distribution at genus level in both lean and obese participants. The levels of Blautia, Bifidobacterium and Staphylococcus genera are altered upon Q-CAN® consumption in lean and the levels of Sutterela and Lactobacillus in obese. The results are the average of 3 visits in pre Q-CAN® group, 4 visits in on Q-CAN® group and 4 visits in post Q-CAN® group for each participant. Obese (n = 9 participants), Lean (n = 10 participants). The data are presented as median with SEM, *p < 0.05
Fig. 5
Fig. 5
Intestinal microbiome analysis at the level of species. a-b Relative abundance of bacterial species is visualized by heat map. Each column represents a subject and each colored row a bacterial taxon. The intensity of the red color represents the highest abundance taxa and the intensity of the blue color the lowest abundance taxa in lean and obese people. The results are the average of 3 visits in pre Q-CAN® group, 4 visits in on Q-CAN® group and 4 visits in post Q-CAN® group for each participant. Obese (n = 9 participants), Lean (n = 10 participants)
Fig. 6
Fig. 6
Oral microbiome analysis at the level of Family and Genus. a, b Bacteria at Family level in both lean and obese shows increase of Veillonelleae in lean and Tissierallacea in obese upon Q-CAN® consumption. c-f Bacteria distribution at genus level in both lean and obese participants. The results are the average of 3 visits in pre Q-CAN® group, 4 visits in on Q-CAN® group and 4 visits in post Q-CAN® group for each participant. Obese (n = 10 participants), Lean (n = 10 participants). The data are presented as median with SEM, *p < 0.05
Fig. 7
Fig. 7
Oral microbiome analysis at the level of Species. a-b Relative abundance of bacterial species is visualized by heat map. Each column represents a subject and each colored row a bacterial taxon. The intensity of the red color represents the highest abundance taxa and the intensity of the blue color the lowest abundance taxa in lean and obese people. The results are the average of 3 visits in pre Q-CAN® group, 4 visits in on Q-CAN® group and 4 visits in post Q-CAN® group for each participant. Obese (n = 10 participants), Lean (n = 10 participants)

References

    1. Messina M. Soy and health update: evaluation of the clinical and epidemiologic literature. Nutrients. 2016;8(12):754. doi: 10.3390/nu8120754. - DOI - PMC - PubMed
    1. Kwon DY, et al. Long-term consumption of fermented soybean-derived Chungkookjang attenuates hepatic insulin resistance in 90% pancreatectomized diabetic rats. Horm Metab Res. 2007;39(10):752–757. doi: 10.1055/s-2007-990287. - DOI - PubMed
    1. Kwon DY, et al. Antidiabetic effects of fermented soybean products on type 2 diabetes. Nutr Res. 2010;30(1):1–13. doi: 10.1016/j.nutres.2009.11.004. - DOI - PubMed
    1. Nozue M, et al. Fermented soy product intake is inversely associated with the development of high blood pressure: the Japan public health center-based prospective study. J Nutr. 2017;147(9):1749–1756. - PubMed
    1. Lee Y, et al. PPARgamma2 C1431T polymorphism interacts with the antiobesogenic effects of Kochujang, a Korean fermented, soybean-based red pepper paste, in overweight/obese subjects: a 12-week, double-blind randomized clinical trial. J Med Food. 2017;20(6):610–617. doi: 10.1089/jmf.2016.3911. - DOI - PubMed

Associated data

LinkOut - more resources