. 2021 Mar 3;7(10):eabc7772.
doi: 10.1126/sciadv.abc7772. Print 2021 Mar.

Modulation of intercolumnar synchronization by endogenous electric fields in cerebral cortex

Affiliations

Modulation of intercolumnar synchronization by endogenous electric fields in cerebral cortex

Beatriz Rebollo et al. Sci Adv. .

Abstract

Neurons synaptically interacting in a conductive medium generate extracellular endogenous electric fields (EFs) that reciprocally affect membrane potential. Exogenous EFs modulate neuronal activity, and their clinical applications are being profusely explored. However, whether endogenous EFs contribute to network synchronization remains unclear. We analyzed spontaneously generated slow-wave activity in the cerebral cortex network in vitro, which allowed us to distinguish synaptic from nonsynaptic mechanisms of activity propagation and synchronization. Slow oscillations generated EFs that propagated independently of synaptic transmission. We demonstrate that cortical oscillations modulate spontaneous rhythmic activity of neighboring synaptically disconnected cortical columns if layers are aligned. We provide experimental evidence that these EF-mediated effects are compatible with electric dipoles. With a model of interacting dipoles, we reproduce the experimental measurements and predict that endogenous EF-mediated synchronizing effects should be relevant in the brain. Thus, experiments and models suggest that electric-dipole interactions contribute to synchronization of neighboring cortical columns.


Figures

Fig. 1
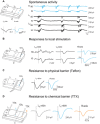
Fig. 1. Endogenous-field propagation of cortical slow waves.
(A) Left: Sectioned cortical slice scheme (top) and Up state (n = 15 waveform average) (bottom). Right: Slow oscillations recorded from supragranular (SG) and infragranular (IG) layers at the six different electrodes indicated on the scheme with dark-color circles. Right side of the slice in blue (R), left side of the slice in black. (B) Left: Sectioned cortical slice scheme. Right: Glutamate-induced responses on R-side (blue) and EF waves at L-side (black) recorded in a particular slice (n = 30 waveform averages). Vertical black lines represent onset time obtained from the response detection (see Materials and Methods). (C) Recordings in the presence of a thin Teflon barrier (scheme) in between the two hemislices, in response to a glutamate-induced responses at R-side (blue) (n = 33 waveform average from one slice). (D) Resistance to application of TTX to both sides (scheme). The response is shown following a puff of glutamate on the left side (n = 20 waveform average from one slice). WM, white matter; Ld, diodes on the left; Lt, triodes on the left; R, right; Glu, glutamate. Recording traces and waveform average were recorded at electrodes represented with dark-color circles on the schemes; light-color circles represent electrodes from which no trace or waveform average is displayed.
Fig. 2
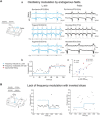
Fig. 2. Frequency modulation between two synaptically disconnected networks.
Oscillatory frequency modulation by EFs originated on the synaptically disconnected column (A) (a) Relative firing rate, LFP recording and Up and Down state detection (gray lines) obtained at both sides of the cut (see Materials and Methods). Spontaneous activity (top) and two “triggered” oscillatory frequencies: 0.66 and 0.33 Hz (middle and bottom, respectively) at Lt-side; the modulated slow oscillations on the R-side changed to 0.77 and 0.23 Hz, respectively. Traces from both sides are aligned on time and plotted in consecutive order (from top to bottom) as they were recorded. SO, slow oscillation; a.u., arbitrary units. (b) Exponential fitting for a particular change in frequency [top of (A)] displaying the glutamate application frequency (blue line); the modulated slow oscillation frequency at R-side (black dots) and its exponential fitting displaying the τ (red cross). (c) Dispersion plot of the NDfreq on both sides of the slice. Increases in frequencies, blue; decreases in frequencies, red (n = 15 variations, 10 slices). (B) From left to right: Schematics of the stimulation with glutamate on the left section of the slide and investigation of the modulation on the right side with an inverted slice. Above, the schematics of stimulation frequency, decreasing (0.5 to 0.25 Hz; middle) or increasing (0.2 to 0.3 Hz; right side). In blue, the stimulation frequency with glutamate application. Notice the absence of modulation on oscillatory frequency in two different slices.
Fig. 3
Fig. 3. Decay of the amplitude of the EF response with distance, compatible with electric dipoles.
Left: Schematics illustrating the gradient in the amplitude of the responses. (A) Log-log representation the EF waves amplitude at the 10 different locations on the Lt-side following glutamate injection at the R-side. The straight line indicates the best linear regression fit in this representation, which corresponds to a power-law decay with distance (1/ra, with a = 2.1) (m.s.e. (mean squared error) = 0.41). (B) Same representation with two Gaussian fits, which correspond to the solution of the diffusion equation. The two fits were calculated according to the linear error (black, m.s.e. = 105.12) or the error calculated in log-log scale (red, m.s.e. = 1.74).
Fig. 4
Fig. 4. Model of the entrainment of slow oscillations from EF interactions between dipoles.
(A) Left: Scheme of two excitatory populations mutually coupled solely through the EF (no synaptic connectivity). Middle: The occurrences of the Up states synchronize weakly because of the EF interaction. Right: Dependence of the PLI on the coupling strength γ (membrane depolarization induced on the “receiving” population per one spike per second of the activity of the “source population”). As a measure of variation, we calculated the SD across 10 repetitions of the simulation for each value of gamma. (B) Left: Scheme of the stimulation protocol simulated by the model. In the model, glutamate injection (Stim) is applied on the R-side (blue) triggering periodic Up states at the R-side and producing EF that affects activity at the L-side. Two middle panels: Sample traces of excitatory population rate at both sides of the slice at three different stimulation frequencies. Right: Frequency of the Up states at both sides of the slice as a function of stimulation frequency. L-side entrains to the R-side by means of the EF (ephaptic) coupling. (C) Same arrangement as (B), but with inverted dipoles, simulating the inverted slice experiments. (D) Left schemes: Topology of the network in one dimension and two dimensions. Color plots: PLI for the different populations. The populations in black received synchronous external stimulation, and the neighboring populations interacted through EF. The PLI is indicated by color in each plot (see scale). 2D, two-dimensional.

References

    1. Steriade M., Contreras D., Curró Dossi R., Nuñez A., Houtkooper R. H., Auwerx J., Franken P., Tafti M., The slow (< 1 Hz) oscillation in reticular thalamic and thalamocortical neurons: Scenario of sleep rhythm generation in interacting thalamic and neocortical networks. J. Neurosci. 13, 3284–3299 (1993). - PMC - PubMed
    1. Sanchez-Vives M. V., Massimini M., Mattia M., Shaping the default activity pattern of the cortical network. Neuron 94, 993–1001 (2017). - PubMed
    1. Frohlich F., McCormick D. A., Endogenous electric fields may guide neocortical network activity. Neuron 67, 129–143 (2010). - PMC - PubMed
    1. Anastassiou C. A., Perin R., Markram H., Koch C., Ephaptic coupling of cortical neurons. Nat. Neurosci. 14, 217–223 (2011). - PubMed
    1. Jefferys J. G. R., Nonsynaptic modulation of neuronal activity in the brain: Electric currents and extracellular ions. Physiol. Rev. 75, 689–723 (1995). - PubMed

Publication types

LinkOut - more resources