. 2021 Mar 3;13(583):eabb4416.
doi: 10.1126/scitranslmed.abb4416.

BMPR1A maintains skeletal stem cell properties in craniofacial development and craniosynostosis

Affiliations

BMPR1A maintains skeletal stem cell properties in craniofacial development and craniosynostosis

Takamitsu Maruyama et al. Sci Transl Med. .

Abstract

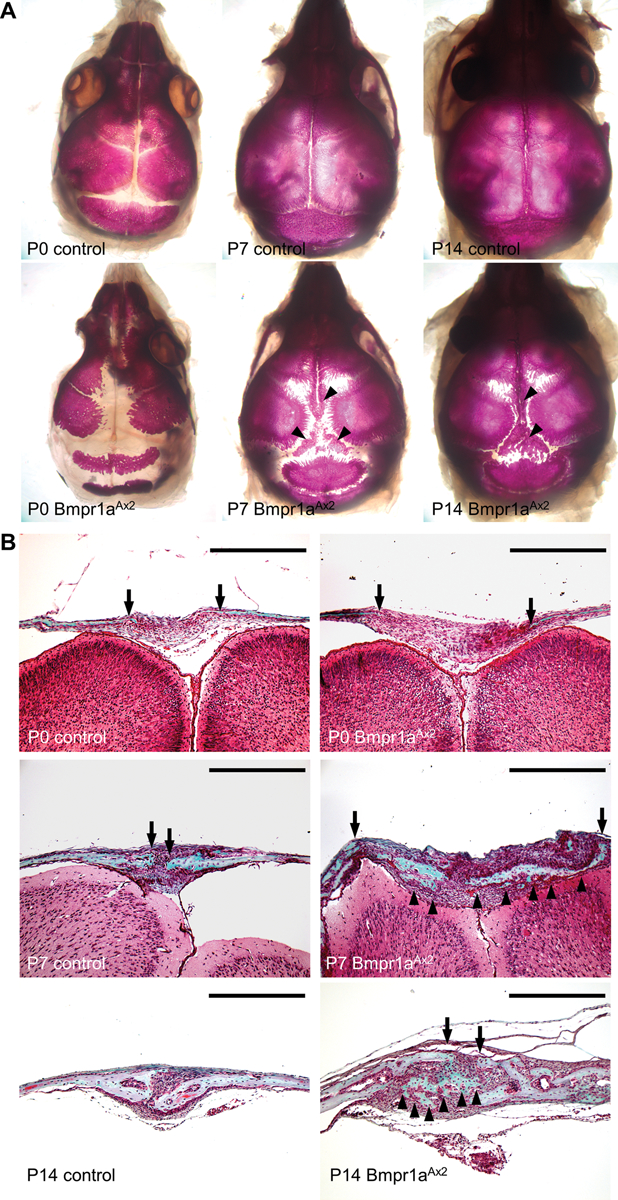
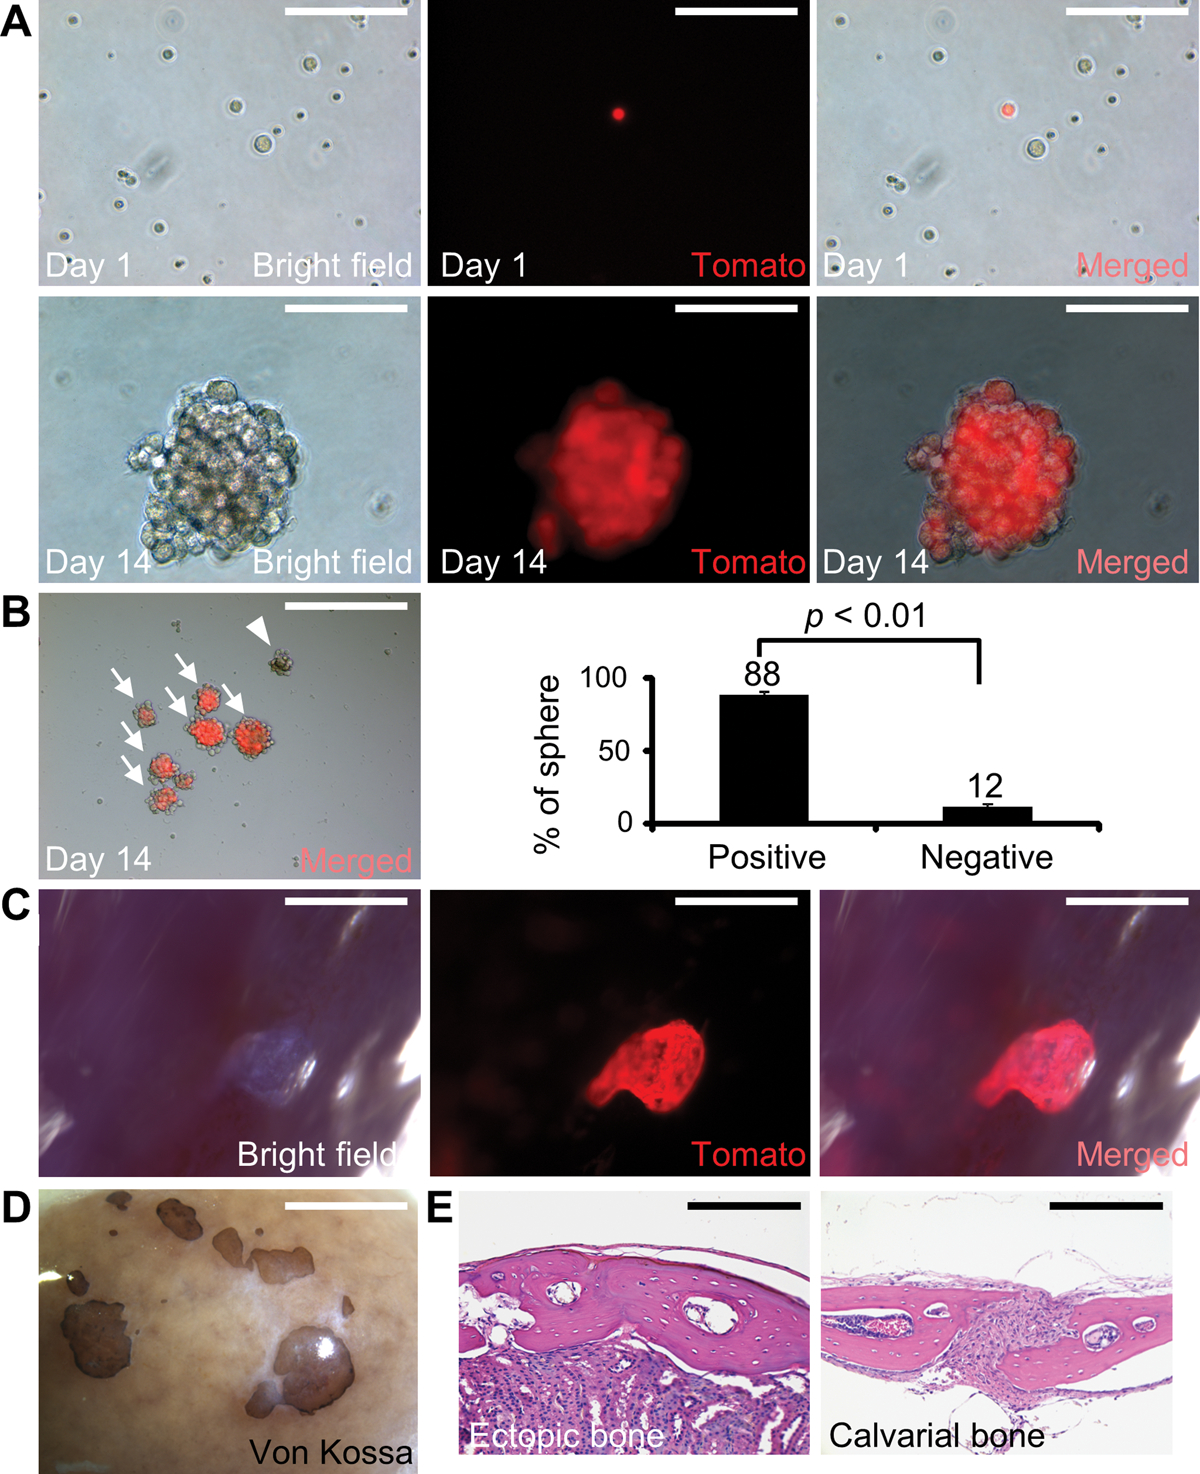
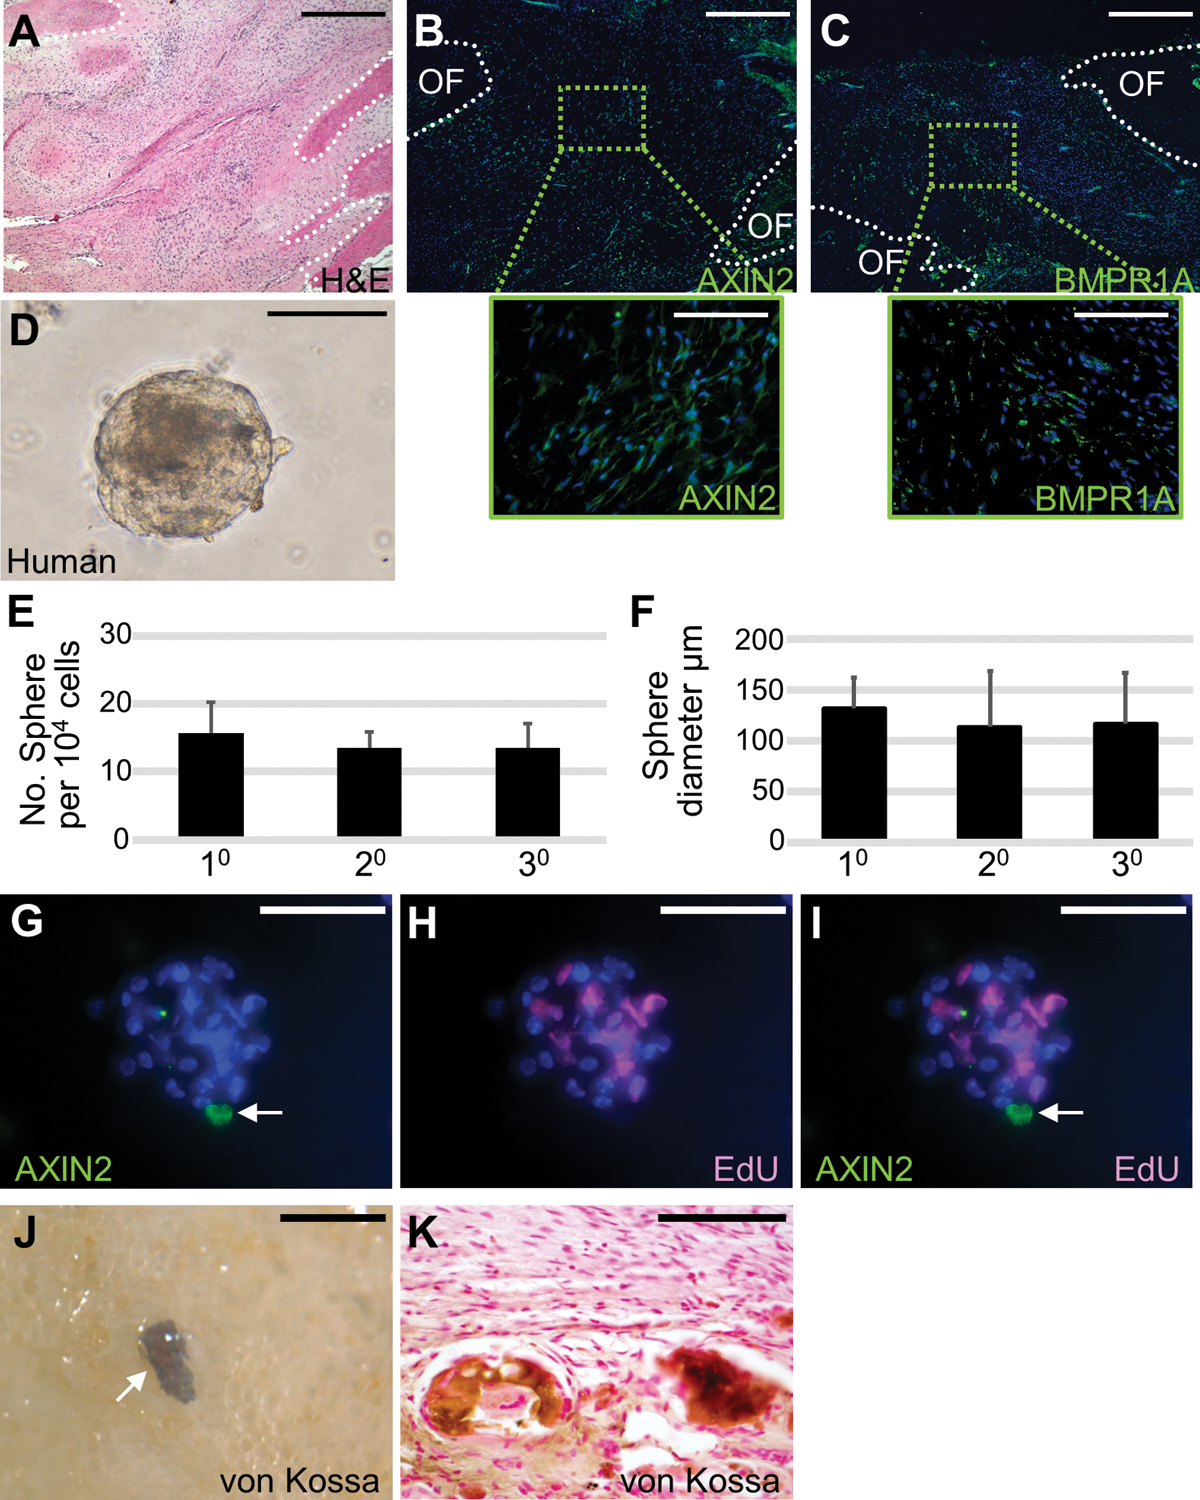
Skeletal stem cells from the suture mesenchyme, which are referred to as suture stem cells (SuSCs), exhibit long-term self-renewal, clonal expansion, and multipotency. These SuSCs reside in the suture midline and serve as the skeletal stem cell population responsible for calvarial development, homeostasis, injury repair, and regeneration. The ability of SuSCs to engraft in injury site to replace the damaged skeleton supports their potential use for stem cell-based therapy. Here, we identified BMPR1A as essential for SuSC self-renewal and SuSC-mediated bone formation. SuSC-specific disruption of Bmpr1a in mice caused precocious differentiation, leading to craniosynostosis initiated at the suture midline, which is the stem cell niche. We found that BMPR1A is a cell surface marker of human SuSCs. Using an ex vivo system, we showed that SuSCs maintained stemness properties for an extended period without losing the osteogenic ability. This study advances our knowledge base of congenital deformity and regenerative medicine mediated by skeletal stem cells.


Figures

Fig. 1.
Fig. 1.
Stem cell-mediated calvarial development and homeostasis require Bmpr1a. Bmpr1aAx2, Bmpr1a−/− and Acvr1Ax2 mouse models examine the BMP type I receptor in calvarial morphogenesis. (A) Diagram illustrates the use of the Axin2Cre-Dox (Axin2-rtTA; TRE-Cre) system to perform spatiotemporal-specific deletion of Bmpr1a or Acvr1 in Axin2+ SuSCs. In Bmpr1aAx2 and Acvr1Ax2 mice, Dox is administrated from E16.5 to P3 for Cre expression. Bmpr1b−/− are homozygous null mice for Bmpr1b. Gross examination (B, E, H), μCT (C-D, F-G, I-J), and hematoxylin and eosin staining (K-N) analyses are then performed at 2 months. Arrowheads indicate Bmpr1aAx2 suture abnormality. Note craniosynostosis is only detected in the Bmpr1a mutants. Images are representatives of three independent experiments. (O) Diagram illustrates the deletion of Bmpr1a in adult SuSCs. Dox is administrated from P28 to P35 for Cre expression. Three months later, μCT analysis (P-Q) and hematoxylin and eosin staining (R-U) examine suture closure defects. COR, coronal suture; LAM, lambdoid suture; SAG, sagittal suture. Arrowheads and asterisks indicate aberrant suture closure. Images are representatives of three independent experiments. Scale bars, 400 μm (K-N); 200 μm (R-U).
Fig. 2.
Fig. 2.
Craniosynostosis caused by SuSC-specific disruption of Bmpr1a involves an unusual suture closure process. The control and Bmpr1aAx2 calvaria are analyzed by alizarin red (A-F) and Goldner’s trichrome (G-L) staining in whole mounts (A-F) and sections (G-L) at P0 (A, D, G-H), P7 (B, E, I-J) and P14 (C, F, K-L). Mineralization arising in the suture midline is evident between calvarial bone plates as indicated by arrowheads. Arrows indicate osteogenic fronts. Images are representatives of three independent experiments. Scale bar, 400 μm (G-L).
Fig. 3.
Fig. 3.
The loss of Bmpr1a in SuSCs leads to aberrant intramembranous ossifications within the suture mesenchyme. (A-D) Immunostaining of Ki67 identifies cells undergoing mitotic division in the osteogenic front (A-B; OF) and suture mesenchyme (C-D) of control and Bmpr1aAx2 sutures at P3. Sections of the P0 and P3 control and Bmpr1aAx2 calvaria are examined by immunostaining of Osterix (Osx; E-J) and in situ hybridization of type1 collagen (Col1; K-L). Arrows indicate osteogenic fronts (OF). Images are representatives of three independent experiments. Scale bars, 60 μm (A-D); 100 μm (I-J); 400 μm (E-H); 200 μm (K-L).
Fig. 4.
Fig. 4.
Bmpr1a regulates SuSCs and stem cell-dependent bone formation. (A-L) Kidney capsule transplantation with limiting dilution analysis of control and Bmpr1aAx2 cells, isolated from the P5 suture mesenchyme with Dox treatment from E16.5 to P3, examines SuSC frequency. Ectopic bone formation is assessed by von Kossa staining in whole mounts (A-H) and histology in sections (I-L). (M) Limiting dilution analysis shows the success of bone formation with transplantation of 105, 104, 103, and 102 cells, providing a quantitative estimation for stem cell frequency using ELDA software. (N-O) Sections of the P7 sagittal suture are examined by immunostaining of Axin2 and counterstaining with DAPI. Broken lines define the calvarial bones. (P) The graph shows the average percentage of Axin2-expressing cells in control and mutant sutures (asterisk, p < 0.01, n=3, mean ± SEM, student t-test). Note Axin2+ SuSCs is reduced by Bmpr1a deficiency. Images are representatives of three independent experiments. Scale bars, 4mm (A-J); 200 μm (I-L); 100 μm (N-O).
Fig. 5.
Fig. 5.
SuSC stemness is preserved in sphere culture. (A-G) Genetic cell-labeling traces the fate of Axin2+ SuSCs using the Axin2Cre-Dox; R26RTomato model. Fluorescent imaging identifies Axin2+ SuSCs before tracing (A-C) and Axin2+ SuSCs and their derivatives after tracing for 14 days in culture (D-G). Arrows and arrowheads indicate the formation of spheres from Axin2+ and Axin2– cells, respectively. (H) Graphs show the average percentage of spheres derived from Axin2 positive and negative cells (p < 0.01, n=3, mean ± SEM, student t-test). (I-K) Whole-mount imaging reveals successful colonization and growth of SuSC spheres 4 weeks after transplantation into the kidney capsule. (L) Whole-mount von Kossa staining identifies ectopic bones generated by SuSC spheres 8 weeks after transplantation. Hematoxylin and eosin staining show the generation of ectopic bone (M) resembling calvarial bone plate (N). Images are representatives of three independent experiments. Scale bars, 100 μm (A-F); 400 μm (G); 1 mm (I-K); 2 mm (L); 200 μm (M-N).
Fig. 6.
Fig. 6.
Bmpr1a is essential for SuSC self-renewal. (A-C) Ex vivo pulse-chase labeling analysis of cells isolated from Axin2GFP mouse sutures examines quiescence of SuSCs in 10, 20, and 30 cultures. Whole-mount imaging reveals a single label-retaining cell with strong GFP intensity in the cultured spheres (arrows). (D) Diagrams show the percent of spheres with (Axin2+) or without (Axin2–) the label-retaining cell and derivatives of Axin2-expressing cells in different passages. (E) Schemes illustrate GFP+ label-retaining cells in the sphere under the asymmetric but not symmetric division of SuSCs. (F-G) Ex vivo pulse-chase labeling followed by whole-mount immunostaining examines label-retaining and Axin2-expressing cells (F), or cells undergoing mitotic division (G), in the suture spheres, respectively. Arrows indicate a single label-retaining cell stained positive for Axin2 (F) but negative for EdU (G). (H) Ex vivo pulse-chase labeling followed by whole-mount immunostaining of Bmpr1a in the suture spheres. Arrows indicate a single label-retaining cell stained positive for Axin2 and Bmpr1a. In vitro self-renewal is examined by serial culturing of spheres. Diagrams illustrate the sphere number (I) and size (J) affected by the loss of Bmpr1a. The suture sphere number is significantly reduced in the 20 and 30 cultures of Bmpr1aAx2 compared to the control (asterisks, p < 0.05, n=3, mean ± SEM, student t-test). The average sphere size is also reduced in the mutant cultures (p-value determined by the two-sided student t-test, 10 control: 236 spheres, and Bmpr1aAx2: 188 spheres; 20 control: 124 spheres, and Bmpr1aAx2: 66 spheres, n=3). Whole-mount von Kossa staining (K-L) and histological (M-N) analyses of the kidney capsules transplanted with the 10 spheres show that the osteogenic ability is maintained in control but impaired in Bmpr1aAx2 spheres. Images are representatives of three independent experiments. Scale bars, 100 μm (A-C, F); 50 μm (G-H); 2 mm (K-L); 800 μm (M-N).
Fig. 7.
Fig. 7.
Self-renewal and osteogenic ability of human SuSCs. Sections of the 14-month-old human coronal suture were examined by hematoxylin and eosin staining (A), immunostaining of AXIN2 (B), and BMPR1A (C). Broken lines define the calvarial bones at the osteogenic front (OF). (D) Cells isolated from human suture form spheres in ex vivo culture. Diagrams illustrate the average number (E, n=5, mean ± SD) and size (F, n=5, >15 spheres in each passage, mean ± SD) of spheres formed by the 10, 20, and 30 culture of human suture cells starting with 104 cells for each passage. (G-I) Co-immunostaining of the human sphere after pulse-chase labeling identifies a single AXIN2-expressing cell (arrow) and EdU positive cells undergoing mitotic division. The von Kossa staining in whole-mounts (J) and sections (K) shows ectopic bone formation in the kidney capsule with implantation of human suture cells. Images are the representatives of at least five independent experiments. Scale bars, 500 μm (A-C); 100 μm (B-C insets, D, G-I, K); 300 μm (J).
Fig. 8.
Fig. 8.
The osteogenic ability of mouse and human Bmpr1a-expressing suture cells. Cell sorter purifies Bmpr1aHigh and Bmpr1aLow cell populations from mouse (A) and human (G) suture mesenchymes, followed by bone formation study in the kidney capsule (B-F, H-M). von Kossa staining of the transplanted kidneys shows bone formation from 5 × 10³ Bmpr1a/BMPR1AHigh (C-F, I-M) but not Bmpr1a/BMPR1ALow (B, H) cells isolated from mouse (B-F) and human (H-M) skulls. Immunostaining of Osx identifies osteoprogenitor cells surrounding the von Kossa stained bone (D-F, J-M). Images are the representatives of at least five independent experiments. Scale bars, 50 μm (B-C, H-M), 100 μm (D-F).

References

    1. Mauffrey C, Barlow BT, Smith W, Management of segmental bone defects. J Am Acad Orthop Surg 23, 143–153 (2015). - PubMed
    1. Hernigou P, Poignard A, Beaujean F, Rouard H, Percutaneous autologous bone-marrow grafting for nonunions. Influence of the number and concentration of progenitor cells. J Bone Joint Surg Am 87, 1430–1437 (2005). - PubMed
    1. Lo DD, Montoro DT, Grova M, Hyun JS, Chung MT, Wan DC, Longaker MT, Stem Cell-Based Bioengineering of Craniofacial Bone. 379–394 (2013).
    1. Panetta NJ, Gupta DM, Longaker MT, Bone regeneration and repair. Curr Stem Cell Res Ther 5, 122–128 (2010). - PubMed
    1. Maruyama T, Jeong J, Sheu TJ, Hsu W, Stem cells of the suture mesenchyme in craniofacial bone development, repair and regeneration. Nature communications 7, 10526 (2016). - PMC - PubMed

Publication types

Substances