

Teplizumab improves and stabilizes beta cell function in antibody-positive high-risk individuals
- PMID: 33658358
- PMCID: PMC8610022
- DOI: 10.1126/scitranslmed.abc8980
Teplizumab improves and stabilizes beta cell function in antibody-positive high-risk individuals
Abstract
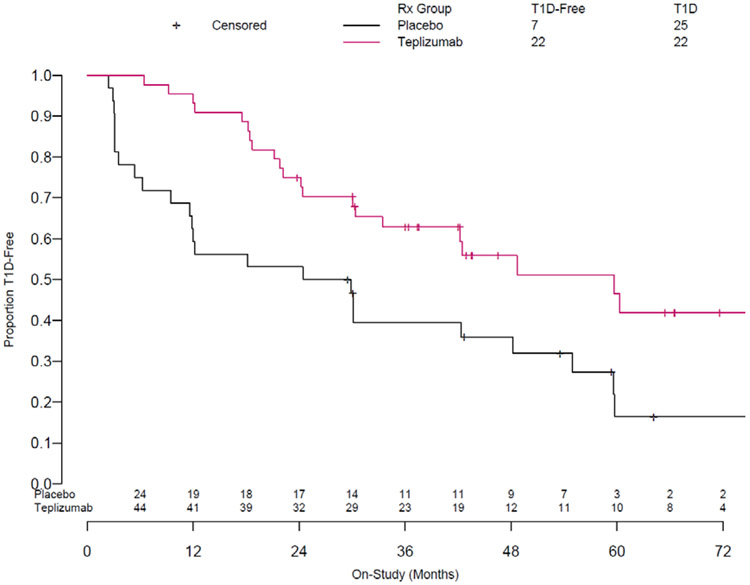
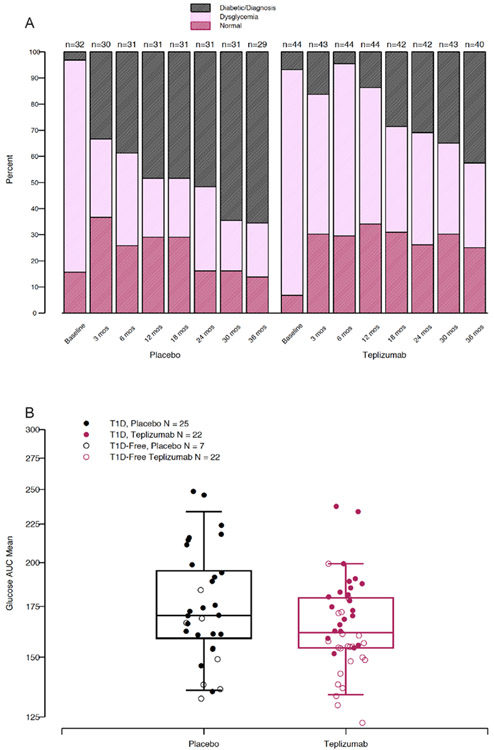
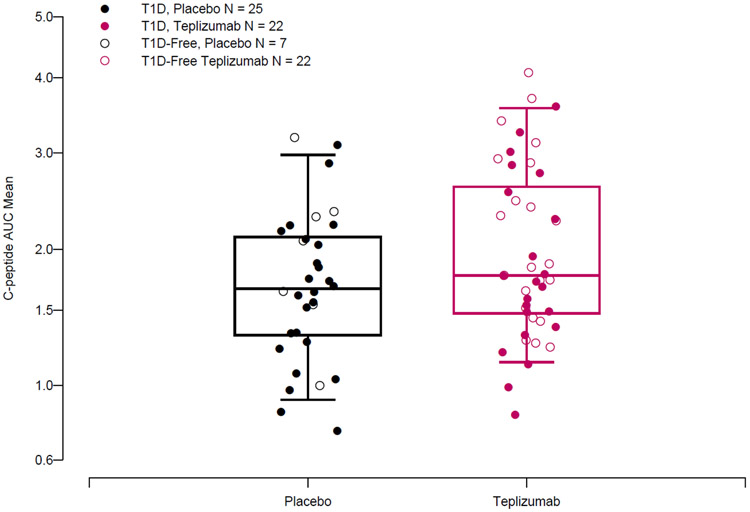
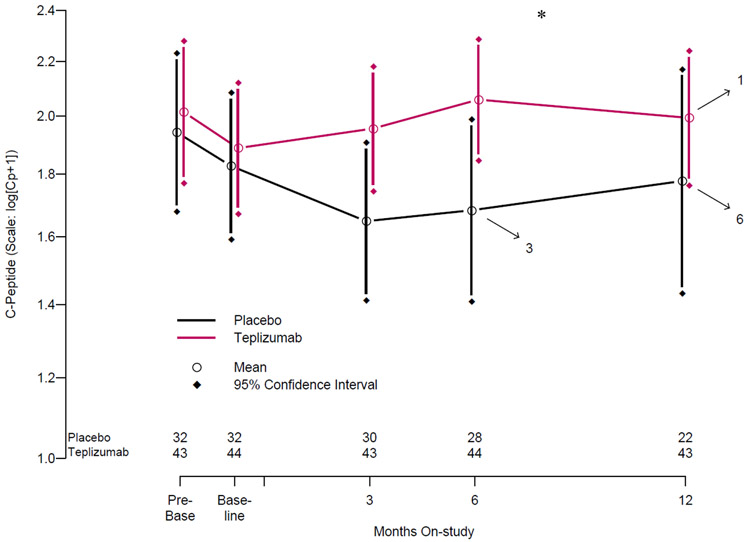
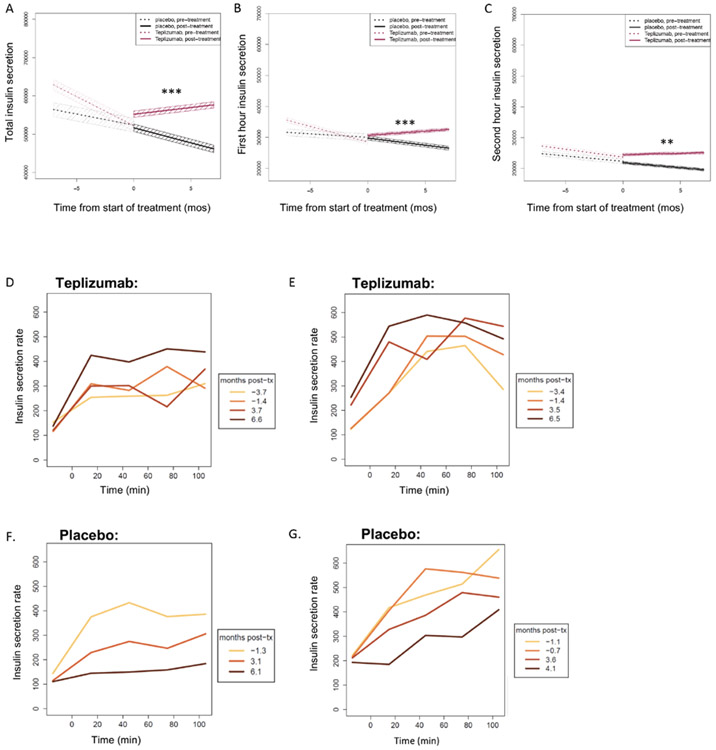
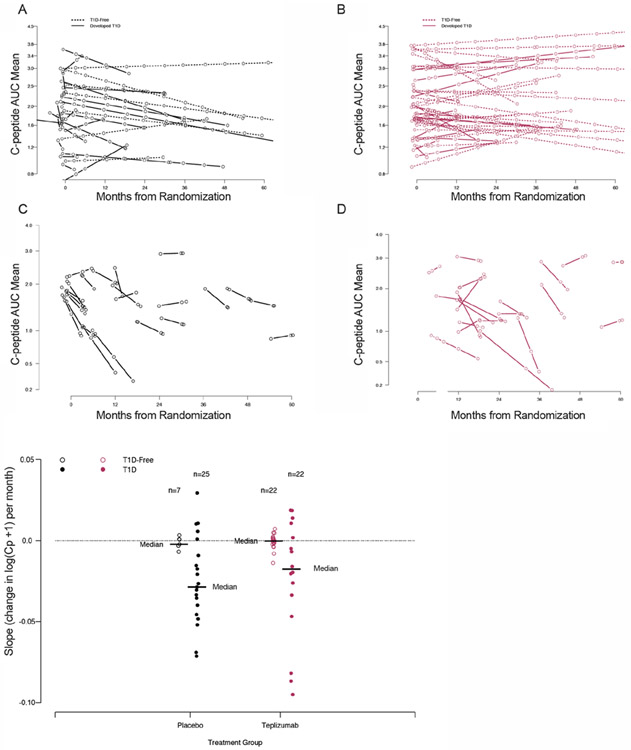
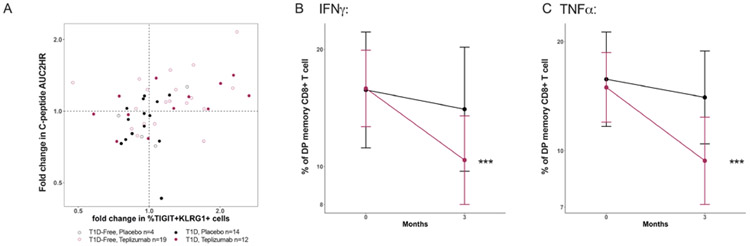
We analyzed the effects of a single 14-day course of teplizumab treatment on metabolic function and immune cells among participants in a previously reported randomized controlled trial of nondiabetic relatives at high risk for type 1 diabetes (T1D). In an extended follow-up (923-day median) of a previous report of teplizumab treatment, we found that the median times to diagnosis were 59.6 and 27.1 months for teplizumab- and placebo-treated participants, respectively (HR = 0.457, P = 0.01). Fifty percent of teplizumab-treated but only 22% of the placebo-treated remained diabetes-free. Glucose tolerance, C-peptide area under the curve (AUC), and insulin secretory rates were calculated, and relationships to T cell subsets and function were analyzed. Teplizumab treatment improved beta cell function, reflected by average on-study C-peptide AUC (1.94 versus 1.72 pmol/ml; P = 0.006). Drug treatment reversed a decline in insulin secretion before enrollment, followed by stabilization of the declining C-peptide AUC seen with placebo treatment. Proinsulin:C-peptide ratios after drug treatment were similar between the treatment groups. The changes in C-peptide with teplizumab treatment were associated with increases in partially exhausted memory KLRG1+TIGIT+CD8+ T cells (r = 0.44, P = 0.014) that showed reduced secretion of IFNγ and TNFα. A single course of teplizumab had lasting effects on delay of T1D diagnosis and improved beta cell function in high-risk individuals. Changes in CD8+ T cell subsets indicated that partially exhausted effector cells were associated with clinical response. Thus, this trial showed improvement in metabolic responses and delay of diabetes with immune therapy.
Copyright © 2021 The Authors, some rights reserved; exclusive licensee American Association for the Advancement of Science. No claim to original U.S. Government Works.
Figures
References
-
- Insel RA, Dunne JL, Atkinson MA, Chiang JL, Dabelea D, Gottlieb PA, Greenbaum CJ, Herold KC, Krischer JP, Lernmark A, Ratner RE, Rewers MJ, Schatz DA, Skyler JS, Sosenko JM, Ziegler AG, Staging presymptomatic type 1 diabetes: a scientific statement of JDRF, the Endocrine Society, and the American Diabetes Association. Diabetes care 38, 1964–1974 (2015). - PMC - PubMed
-
- Mahon JL, Sosenko JM, Rafkin-Mervis L, Krause-Steinrauf H, Lachin JM, Thompson C, Bingley PJ, Bonifacio E, Palmer JP, Eisenbarth GS, Wolfsdorf J, Skyler JS, C. TrialNet Natural History, G. Type 1 Diabetes TrialNet Study, The TrialNet Natural History Study of the Development of Type 1 Diabetes: objectives, design, and initial results. Pediatric diabetes 10, 97–104 (2009). - PubMed
-
- Siljander HT, Hermann R, Hekkala A, Lahde J, Tanner L, Keskinen P, Ilonen J, Simell O, Veijola R, Knip M, Insulin secretion and sensitivity in the prediction of type 1 diabetes in children with advanced beta-cell autoimmunity. Eur J Endocrinol 169, 479–485 (2013). - PubMed
Publication types
MeSH terms
Substances
Grants and funding
- U01 DK085476/DK/NIDDK NIH HHS/United States
- R01 DK127308/DK/NIDDK NIH HHS/United States
- U01 DK061010/DK/NIDDK NIH HHS/United States
- UM1 AI109565/AI/NIAID NIH HHS/United States
- U01 DK085453/DK/NIDDK NIH HHS/United States
- R01 AI141952/AI/NIAID NIH HHS/United States
- U01 DK106993/DK/NIDDK NIH HHS/United States
- P30 DK097512/DK/NIDDK NIH HHS/United States
- U01 DK103282/DK/NIDDK NIH HHS/United States
- U01 DK085509/DK/NIDDK NIH HHS/United States
- UC4 DK117009/DK/NIDDK NIH HHS/United States
- R01 DK093954/DK/NIDDK NIH HHS/United States
- U01 DK127786/DK/NIDDK NIH HHS/United States
- U01 DK085466/DK/NIDDK NIH HHS/United States
- U01 DK103153/DK/NIDDK NIH HHS/United States
- U01 DK061058/DK/NIDDK NIH HHS/United States
- U01 DK106984/DK/NIDDK NIH HHS/United States
- U01 DK085499/DK/NIDDK NIH HHS/United States
- U01 DK107013/DK/NIDDK NIH HHS/United States
- U01 DK103266/DK/NIDDK NIH HHS/United States
- UC4 DK106993/DK/NIDDK NIH HHS/United States
- P30 DK045735/DK/NIDDK NIH HHS/United States
- U01 DK107014/DK/NIDDK NIH HHS/United States
- U01 DK106994/DK/NIDDK NIH HHS/United States
- R01 DK138335/DK/NIDDK NIH HHS/United States
- U01 DK061042/DK/NIDDK NIH HHS/United States
- U01 DK061034/DK/NIDDK NIH HHS/United States
- U01 DK085461/DK/NIDDK NIH HHS/United States
- U01 DK103180/DK/NIDDK NIH HHS/United States
- U01 DK085465/DK/NIDDK NIH HHS/United States
- U01 DK085504/DK/NIDDK NIH HHS/United States
LinkOut - more resources
Full Text Sources
Other Literature Sources
Medical
Research Materials
