. 2021 Mar 3;12(1):1419.
doi: 10.1038/s41467-021-21707-1.

Integrative pan cancer analysis reveals epigenomic variation in cancer type and cell specific chromatin domains

Affiliations

Integrative pan cancer analysis reveals epigenomic variation in cancer type and cell specific chromatin domains

Lijin K Gopi et al. Nat Commun. .

Abstract

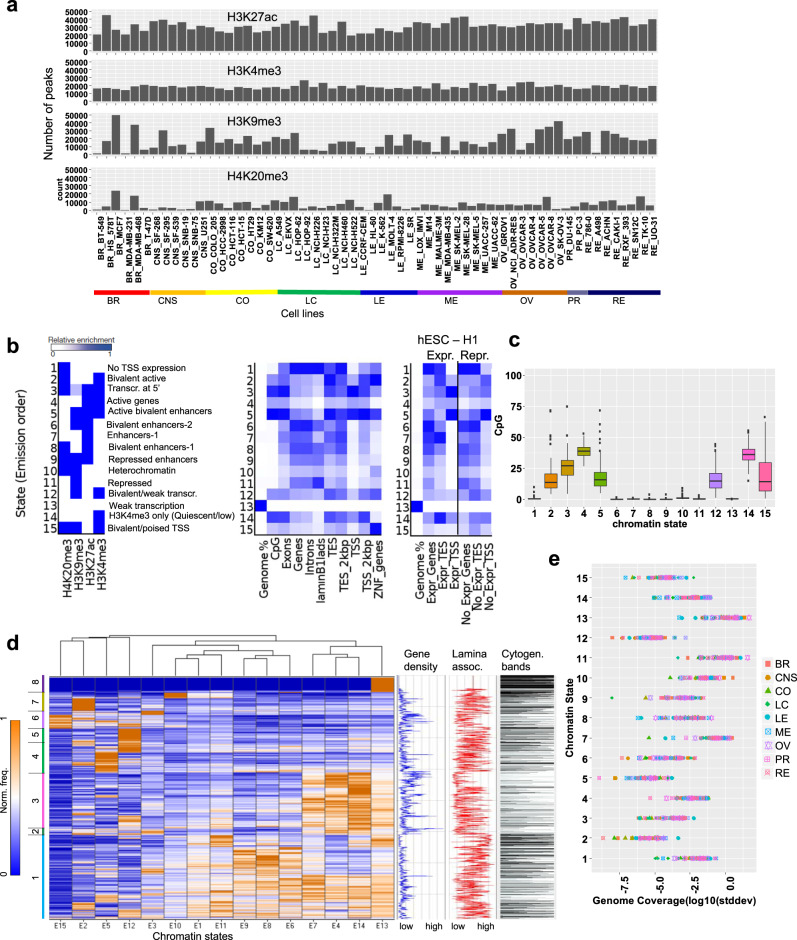
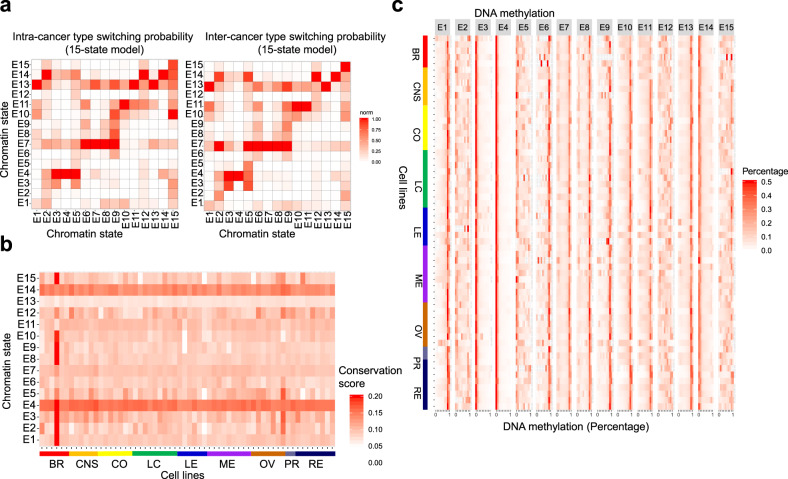
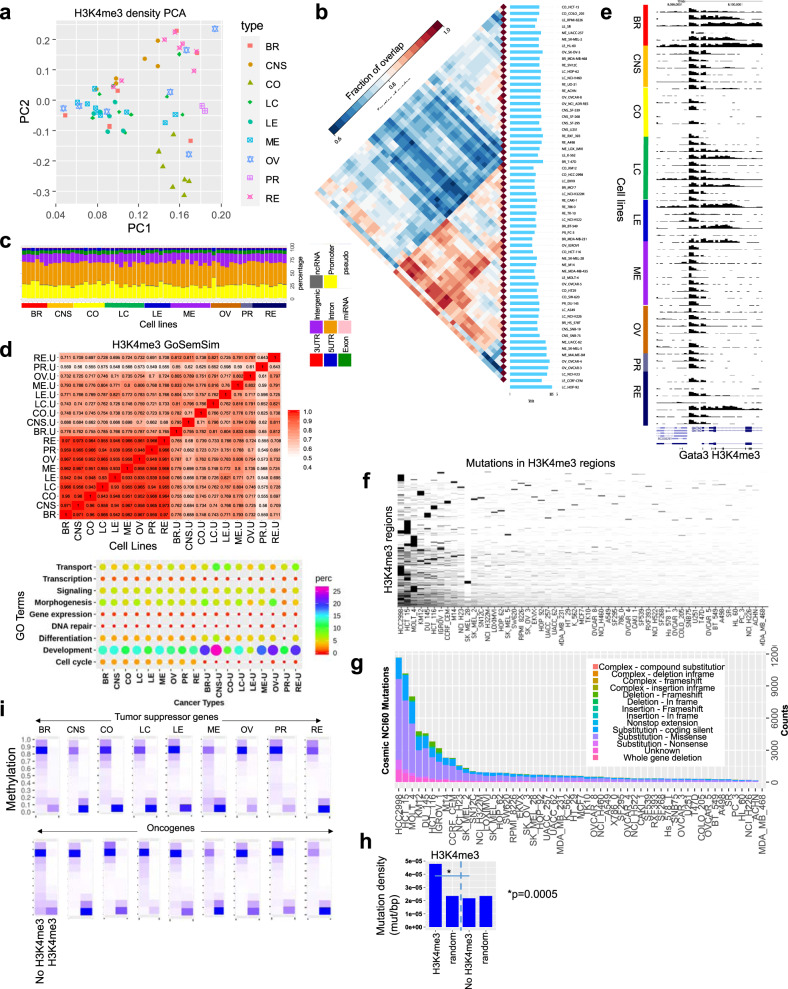
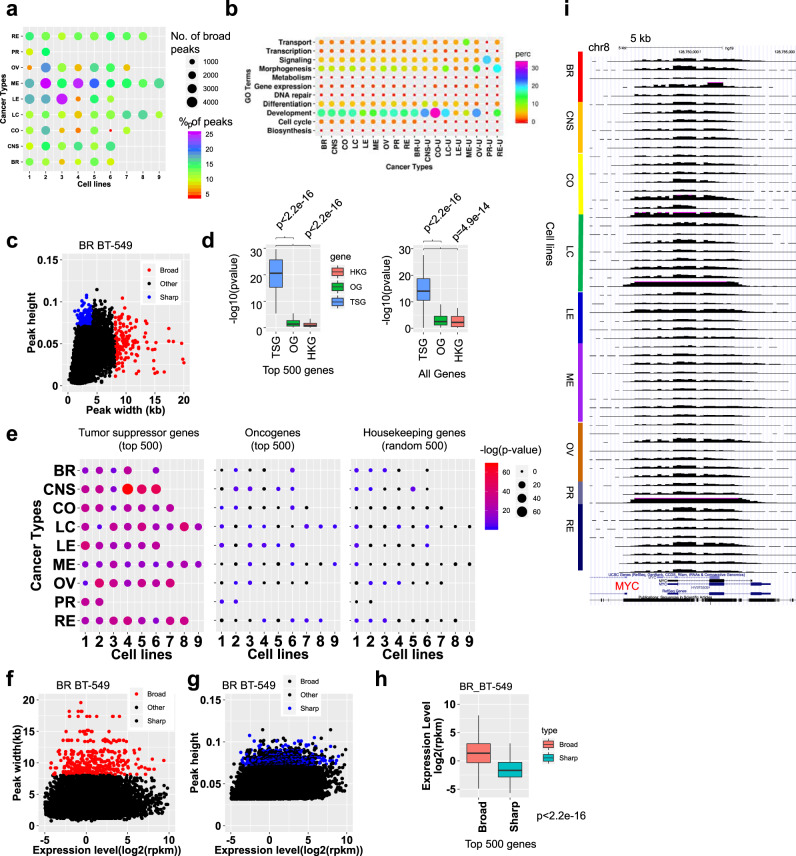
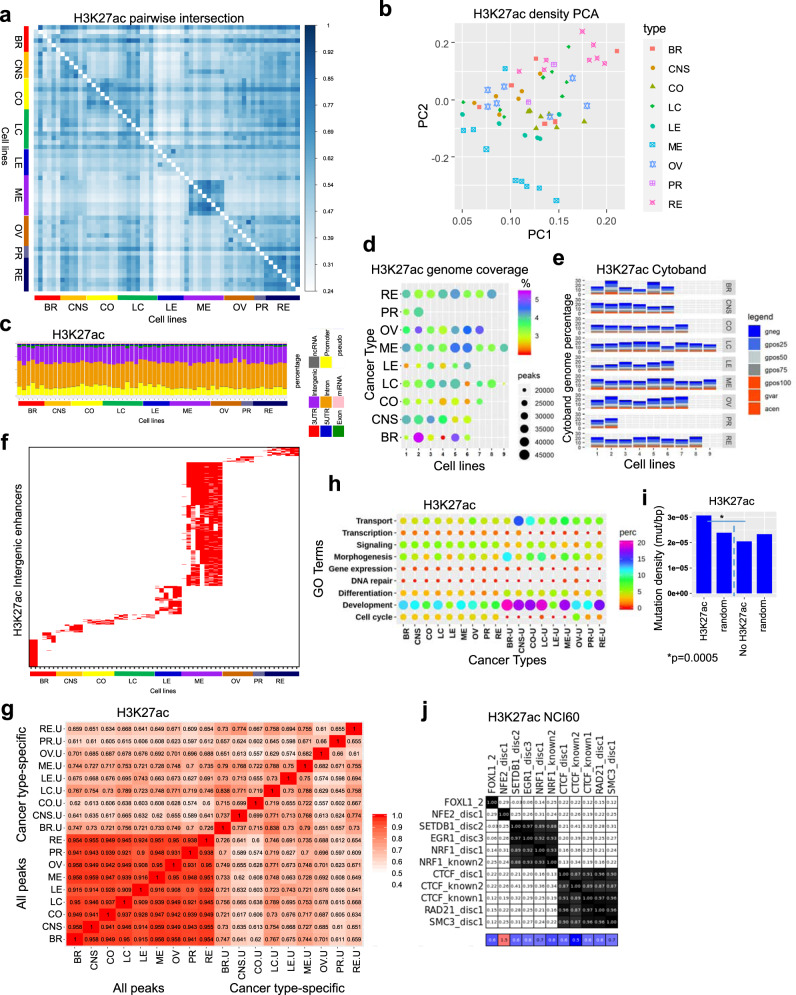
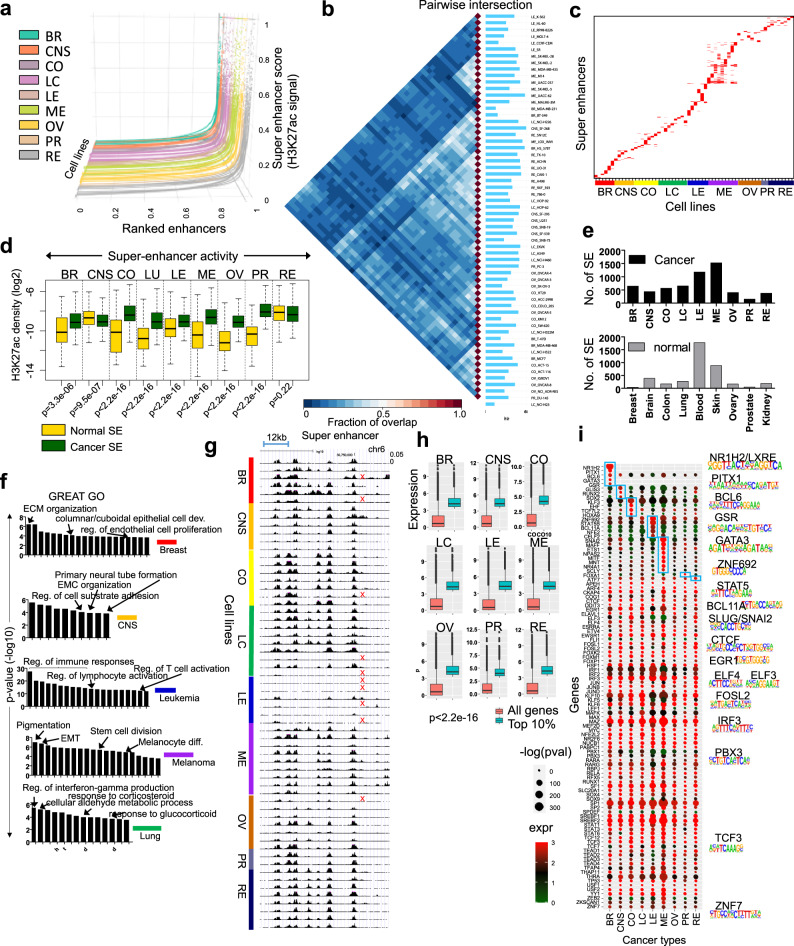
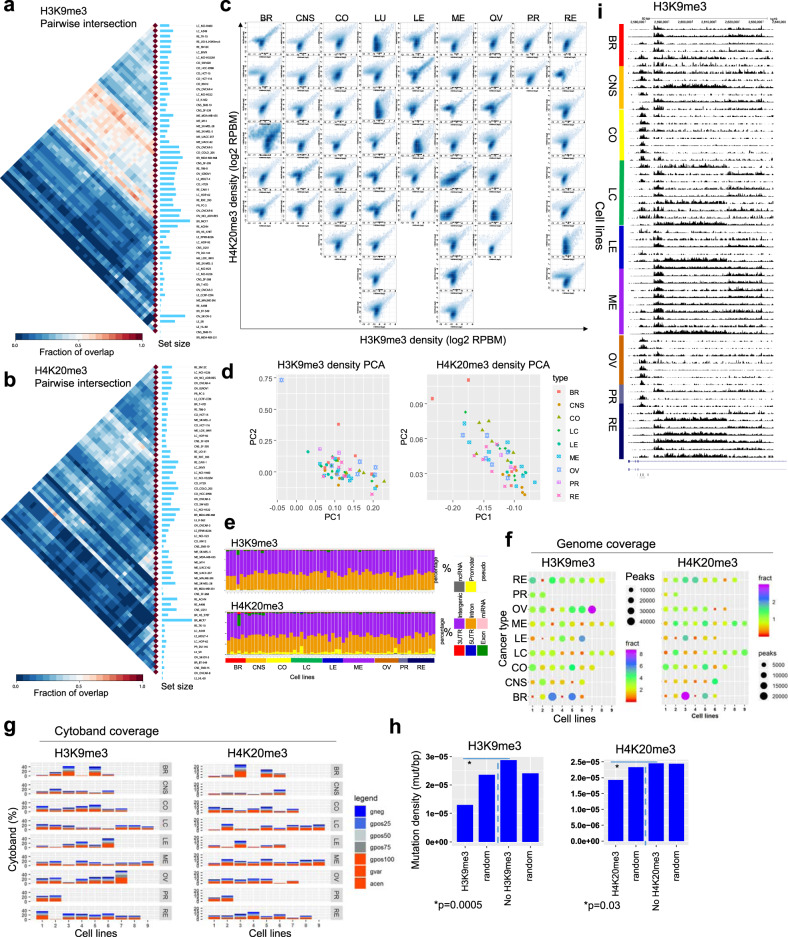
Epigenetic mechanisms contribute to the initiation and development of cancer, and epigenetic variation promotes dynamic gene expression patterns that facilitate tumor evolution and adaptation. While the NCI-60 panel represents a diverse set of human cancer cell lines that has been used to screen chemical compounds, a comprehensive epigenomic atlas of these cells has been lacking. Here, we report an integrative analysis of 60 human cancer epigenomes, representing a catalog of activating and repressive histone modifications. We identify genome-wide maps of canonical sharp and broad H3K4me3 domains at promoter regions of tumor suppressors, H3K27ac-marked conventional enhancers and super enhancers, and widespread inter-cancer and intra-cancer specific variability in H3K9me3 and H4K20me3-marked heterochromatin domains. Furthermore, we identify features of chromatin states, including chromatin state switching along chromosomes, correlation of histone modification density with genetic mutations, DNA methylation, enrichment of DNA binding motifs in regulatory regions, and gene activity and inactivity. These findings underscore the importance of integrating epigenomic maps with gene expression and genetic variation data to understand the molecular basis of human cancer. Our findings provide a resource for mining epigenomic maps of human cancer cells and for identifying epigenetic therapeutic targets.


Conflict of interest statement

The authors declare no competing interests.

Figures

Fig. 1
Fig. 1. Cancer type-specific chromatin state dynamics.
a Bar plot representation of the number of regions enriched with histone modifications (H3K4me3, H3K27ac, H3K9me3, H4K20me3) in the NCI-60 panel of human cancer cell lines. b Chromatin states defined by enrichment of histone modifications using ChromHMM. Probabilities of histone modifications in chromatin states is depicted as a heatmap (left). Average genome coverage and annotation of genic and non-genic elements (middle). Annotation of positional expression of active and inactive genic regions in H1 ES cells (right) (TSS transcription start site, TES transcription end site). c Enrichment of CpG islands across n = 60 cancer cell lines for 15 chromatin states shows active clusters 2–5, 12, and 14, 15 relative to passive or inactive clusters 1, 6–11, and 13. Each boxplot shows CpG occupancy. Boxplots indicate the 1st and 3rd quartiles (25th and 75th percentile, upper and lower bounds), 2nd quartile (center), and minima−maxima (1.5*interquartile range, whiskers). d Hierarchical clustering of 2 Mb genome intervals (rows) for normalized observed vs. random relative chromatin state frequency, which was averaged across all cancer epigenomes. The gene density, cytogenic bands, and H1 ES cell LaminB1 enrichment for ES cells are depicted on the right. Hierarchical clustering heatmap: the x-axis shows the 15 chromatin states (E1–E15) and the y-axis shows the chromatin state frequency (0–1). e Relative chromatin state frequency for each human cancer cell epigenome. Source data are provided as a Source Data file.
Fig. 2
Fig. 2. Chromatin state switching and DNA methylation in human cancer cells.
a Intra-cancer type switching probabilities for 15 chromatin states across 60 human cancer epigenomes (left) relative to inter-cancer type switching (right). State transition (x-axis to y-axis). b Conservation scores for 60 epigenomes in the 15 chromatin states. c DNA methylation levels obtained from whole-genome bisulfite sequencing (WGBS). The percentage of methylated CpG dinucleotides is shown for the 15-state model (red, high CpG methylation). Cells from 9 types of cancer (60 cell lines) are shown on the y-axis and the 15 chromatin states are shown on the x-axis. Source data are provided as a Source Data file.
Fig. 3
Fig. 3. H3K4me3 dynamics and mutation analysis across 60 human cancer cell lines.
a Principal component analysis (PCA) of H3K4me3 density levels (norm. tag density) in 60 cell lines. Nine cancer types are color coded (BR breast, CNS central nervous system, CO colon, LC lung cancer, LE leukemia, ME melanoma, OV ovary, PR prostate, RE renal). b Pairwise intersection of SICER-defined (FDR < 0.0001) H3K4me3-enriched regions. Heat map of pairwise intersection of H3K4me3 regions was generated using Intervene. c Genomic annotation of H3K4me3 regions in 60 cancer cell lines using HOMER. d H3K4me3 peaks nearby TSS of genes were annotated using gene ontology (GO) functional annotation terms enriched by DAVID analysis and clustered using GoSemSim semantic similarity analysis. NCBI DAVID was used to calculate p-values. Heatmap of semantic similarity matrix (top) and bubble plot showing enrichment of top biological process GO terms in 9 cancer types, and specific to each cancer type (u unique, bottom). e UCSC browser view of H3K4me3 distributions at a representative gene across 60 cancer cells. f Cosmic mutation analysis of H3K4me3 regions across 60 cancer cell lines. Hierarchical clustering heat map density of cosmic mutations in H3K4me3 regions. g Stacked bar plot showing number and type of mutation in 60 cell lines. h Mutation density (mutation/bp) in H3K4me3-marked regions relative to random regions of similar size and frequency, and regions without H3K4me3. p-value was determined using a two-sided Fisher’s exact test. i DNA methylation level at regions with or without H3K4me3 at tumor suppressors (top) and oncogenes (bottom). Source data are provided as a Source Data file.
Fig. 4
Fig. 4. Promoter-associated broad H3K4me3 domains are associated with tumor suppressor genes.
a Number of broad (>4 kb) H3K4me3 peaks across 60 cancer cells representing 9 types of cancer. Size of circle indicates the number of broad H3K4me3 peaks while the color indicates the percentage of total H3K4me3 peaks. b DAVID GO functional annotation analysis of genes associated with promoter H3K4me3 peaks. Bubble plot showing enrichment of top biological process GO terms in 9 cancer types, and specific to each cancer type (u: unique, bottom). NCBI DAVID was used to calculate p-values. c Scatter plot of H3K4me3 height (y-axis) and width (x-axis). Blue and red points represent sharp and broad peaks, respectively. d Boxplot of enrichment p-values (y-axis) of tumor suppressors (TSG), oncogenes (OG), and housekeeping genes for genes associated with promoter broad H3K4me3 peaks for each cancer cell line. Left: the top n = 500 tumor suppressors, oncogenes, and 500 random housekeeping genes were used for this analysis. Right: all (n = 1000) TSG, OG, and housekeeping genes were used. p-values (y-axis) were determined using two-sided Fisher’s exact tests. Boxplots indicate the 1st and 3rd quartiles (25th and 75th percentile, upper and lower bounds), 2nd quartile (center), and minima−maxima (1.5*interquartile range, whiskers). p-value (x-axis) were determined using two-sided Kolmogorov–Smirnov tests. e Bubble plots indicating enrichment p-values of TSG, OG, and housekeeping genes for genes associated with broad H3K4me3 for 60 cancer cell lines. p-value (−log10) represented by bubble size and color. p-values were determined using two-sided Fisher’s exact tests. Scatter plots of H3K4me3 (f) widths (y-axis) or (g) heights (x-axis) and gene expression (x-axis) for a representative cancer cell line. Red and blue points indicate broad and sharp peaks, respectively. h Boxplot showing expression level of genes associated with top n = 500 broad or sharp H3K4me3 peaks in a representative cancer cell line. P < 1 × 10−20 (ks-test). Boxplots indicate the 1st and 3rd quartiles (25th and 75th percentile, upper and lower bounds), 2nd quartile (center), and minima−maxima (1.5*interquartile range, whiskers). p-value was determined using a two-sided Kolmogorov–Smirnov test. i UCSC browser view of broad H3K4me3 distributions at a representative locus in 60 cancer cells (scale: 0–0.15 norm. tag density). Source data are provided as a Source Data file.
Fig. 5
Fig. 5. Typical H3K27ac enhancer profiling across multiple types of cancer.
a Pairwise intersection of SICER-defined H3K27ac peaks (FDR < 0.0001) in 60 cancer cell lines. Heat map of pairwise intersection of H3K27ac regions was generated using Intervene. b PCA showing H3K27ac density (norm. tag density) across 60 cancer cell lines. c Annotation of genomic regions enriched with H3K27ac peaks in 60 cancer cell lines using HOMER. d Bubble plots showing H3K27ac genomic coverage for 60 cancer cells representing 9 types of cancers. Each row represents a cancer type. The size of the circle indicates the number of H3K27ac peaks and the color indicates the percentage of genome coverage. e Stacked barplot showing cytogenetic banding pattern of H3K27ac peaks. Cytobands were obtained from the UCSC genome browser. f Cancer type-specific H3K27ac-marked enhancer modules across 60 cell lines. H3K27ac-marked intergenic enhancers were diagonally sorted. g H3K27ac peaks nearby TSS of genes were functionally annotated using DAVID, and clustered using GoSemSim semantic similarity analysis. Biological process GO terms identified using DAVID. All H3K27ac peaks for 60 cell lines and cancer type-specific peaks were annotated. h Bubble plot showing enrichment of top biological process GO terms identified from all peaks and cancer type-specific peaks from 9 cancer types comprising 60 cell lines (u unique). i Mutation density (mutation/bp) in H3K27ac relative to random regions of similar size and frequency, and regions without H3K27ac. p-value was determined using a two-sided Fisher’s exact test. j Evaluation of enhancer regulatory motifs enriched in intergenic regions across 60 cancer cells. Encode motifs was used to perform motif analysis for intergenic H3K27ac ChIP-Seq datasets for 60 cells.
Fig. 6
Fig. 6. Identification of super enhancers (SE) in cancer epigenomes.
a Super slope saturation curves of H3K27ac densities across 60 human cancer cell line datasets. The number of ranked typical and super enhancers (SE) marked by H3K27ac are plotted. H3K27ac normalized ChIP-Seq signal across a subset of all H3K27ac marked enhancers. SE were identified using HOMER (see the “Methods” section). SE are identified as regions that are located beyond where the slope is 1. b Intervene pairwise intersection of H3K27ac-defined SE. c Heat map showing diagonally sorted SE identified in 60 cancer cells. d Boxplot depicting SE activity at typical or normal enhancers (yellow) and SE (green) in cancer. H3K27ac densities (log2 norm. tag density) are shown. Boxplots indicate the 1st and 3rd quartiles (25th and 75th percentile, upper and lower bounds), 2nd quartile (center), and minima−maxima (1.5*interquartile range, whiskers). p-values were calculated using two-sided K–S tests. e Number of SE in cancer (black) and normal cells (gray). f p-values were calculated using GREAT GO functional annotation of cancer type-specific SE regions (−log10 p-value). g UCSC browser view of a SE cluster. Red ‘x’ indicates absence of a super enhancer. h Boxplot of RNA-Seq expression (log2 RPKM) of the top 10% expressed transcript encoding and all transcripts across 9 types of cancer in 60 cells. p-value for all <2.2e−16 (K–S test). Boxplots indicate the 1st and 3rd quartiles (25th and 75th percentile, upper and lower bounds), 2nd quartile (center), and minima−maxima (1.5*interquartile range, whiskers). i Heat map showing enrichment of transcription factor-binding sites (TFBS) in H3K27ac-defined SE regions across 9 cancer types. TFs expressed in the top 10% of all transcripts in at least one cancer type, and whose recognition motif was significantly enriched in SE regions (p < 0.05). The size of the circle is proportional to the p-value of the motif enrichment (−log10 (p-value), and the color of the circle is representative of the expression level of the TF in a given cancer type (red, high expression; green, low expression). Representative sequence logos of enriched motifs are shown. HOMER motif analysis was used to calculate p-values. Blue boxes show cancer-specific enrichment of TF-binding sites. Source data are provided as a Source Data file.
Fig. 7
Fig. 7. Heterochromatin dynamics in cancer epigenomes.
a and b Pairwise intersection of SICER-defined (FDR < 0.0001) a H3K9me3 and b H4K20me3 enriched regions in 60 cancer cells. Heat map of pairwise intersection was generated using Intervene. c Scatter plots of H3K9me3 and H4K20me3 densities (log2 norm. tag density) across 60 cancer cell lines representing 9 cancer subtypes. d PCA analysis of H3K4me9 (left) and H4K20me3 (right) densities (norm. tag density) in 60 cell lines. Cancer types are color coded. e Genomic positional annotation of regions enriched with H3K9me3 (top) and H4K20me3 (bottom) in 60 cancer cell lines using HOMER. f Bubble plots showing H3K9me3 (left) and H4K20me3 (right) genomic coverage for 60 cancer cells representing 9 types of cancers. Each row represents a cancer type. The size of the circle indicates the number of H3K9me3 or H4K20me3 peaks and the color indicates the percentage of genome coverage. g Stacked barplot showing cytogenetic banding pattern of H3K9me3 (left) and H4K20me3 (right) peaks. h Mutation density (mutation/bp) in H3K9me3 (left) and H4K20me3 (right) regions relative to random regions of similar size and frequency, and regions without H3K9me3 or H4K20me3. p-value was determined using a two-sided Fisher’s exact test. i UCSC browser view of H3K9me3-marked domains in 60 cells. Source data are provided as a Source Data file.

References

    1. Hansen KD, et al. Increased methylation variation in epigenetic domains across cancer types. Nat. Genet. 2011;43:768–775. doi: 10.1038/ng.865. - DOI - PMC - PubMed
    1. Jones PA, Baylin SB. The fundamental role of epigenetic events in cancer. Nat. Rev. Genet. 2002;3:415–428. doi: 10.1038/nrg816. - DOI - PubMed
    1. Muntean AG, Hess JL. Epigenetic dysregulation in cancer. Am. J. Pathol. 2009;175:1353–1361. doi: 10.2353/ajpath.2009.081142. - DOI - PMC - PubMed
    1. Timp W, Feinberg AP. Cancer as a dysregulated epigenome allowing cellular growth advantage at the expense of the host. Nat. Rev. Cancer. 2013;13:497–510. doi: 10.1038/nrc3486. - DOI - PMC - PubMed
    1. Shoemaker RH. The NCI60 human tumour cell line anticancer drug screen. Nat. Rev. Cancer. 2006;6:813–823. doi: 10.1038/nrc1951. - DOI - PubMed

Publication types