. 2021 Mar 3;12(1):1401.
doi: 10.1038/s41467-021-21731-1.

ATF4 selectively regulates heat nociception and contributes to kinesin-mediated TRPM3 trafficking

Affiliations

ATF4 selectively regulates heat nociception and contributes to kinesin-mediated TRPM3 trafficking

Man-Xiu Xie et al. Nat Commun. .

Abstract

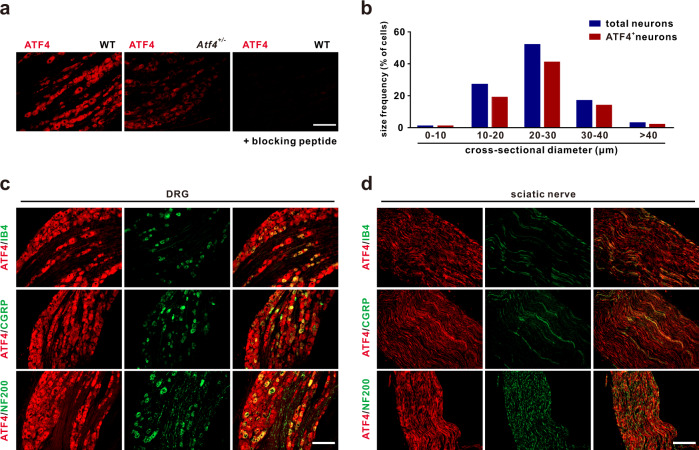
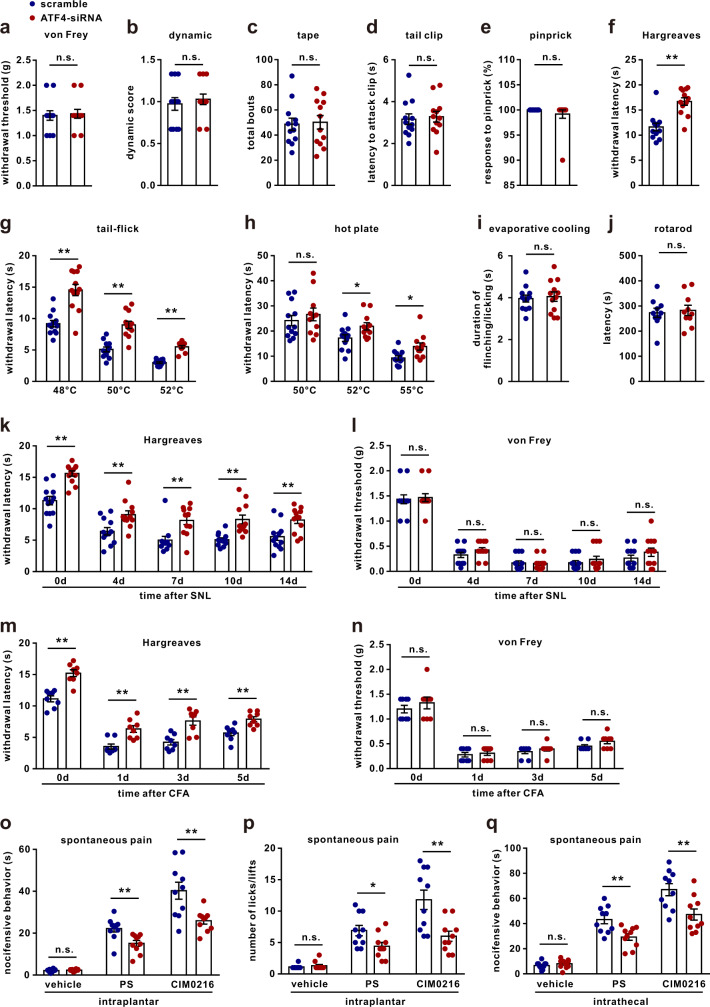
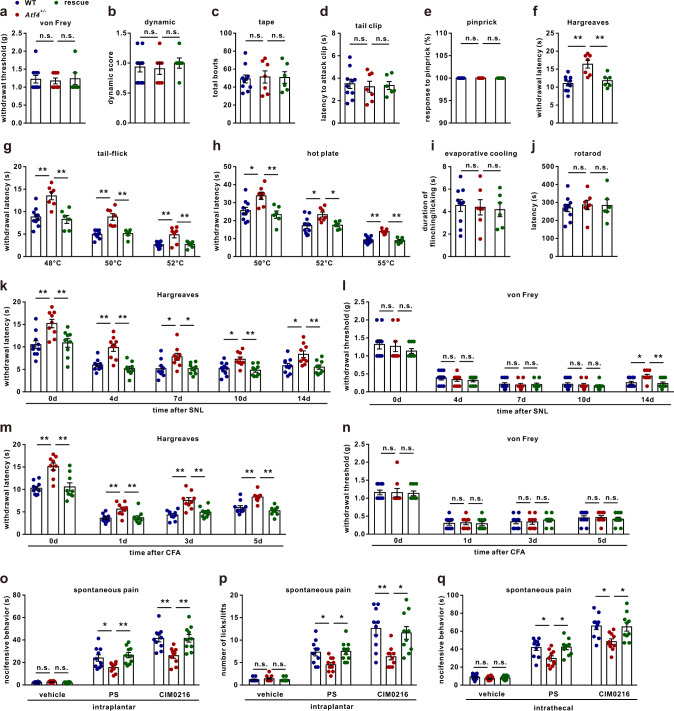
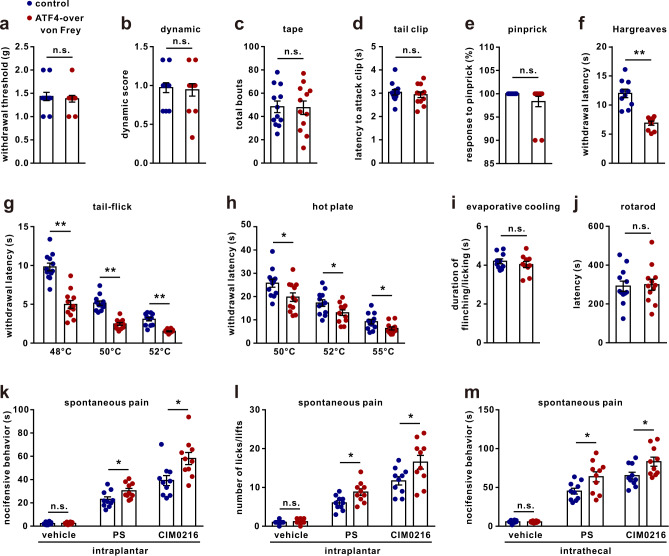
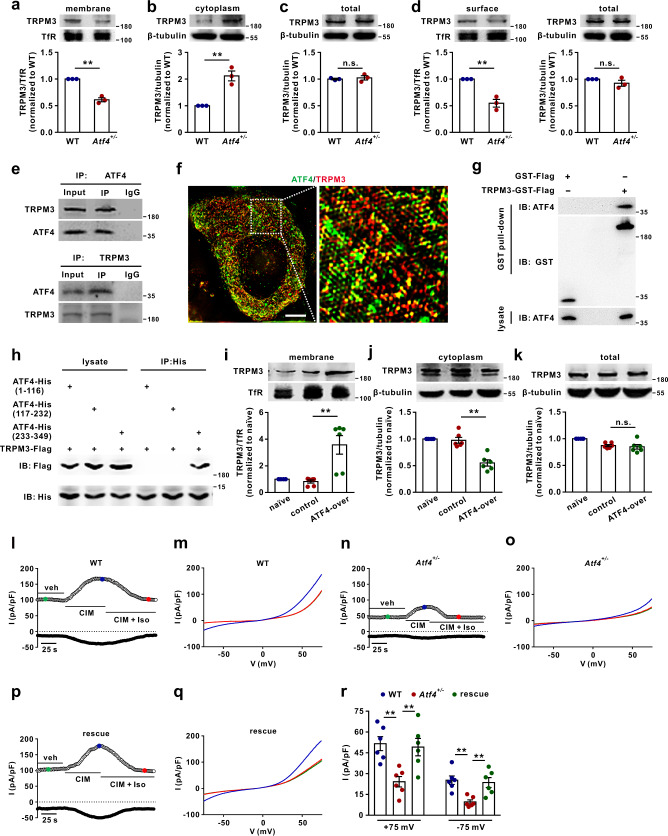
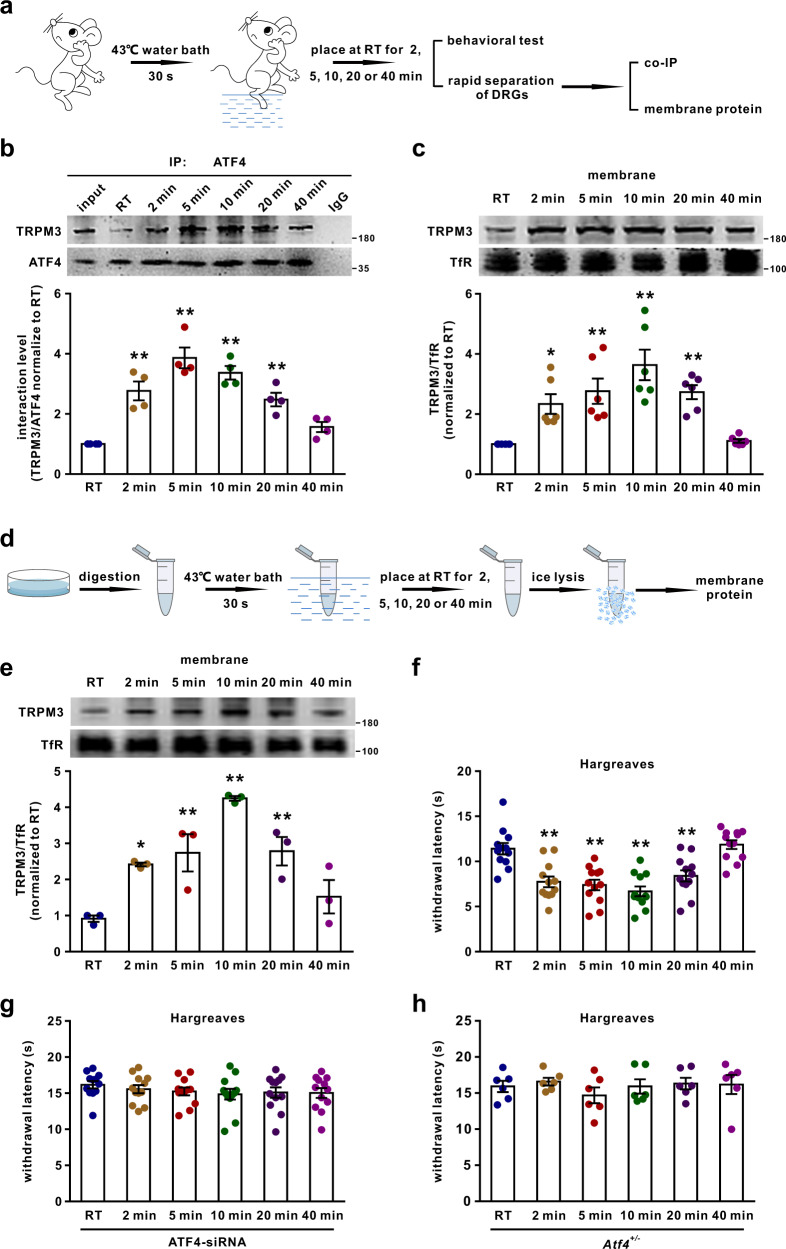
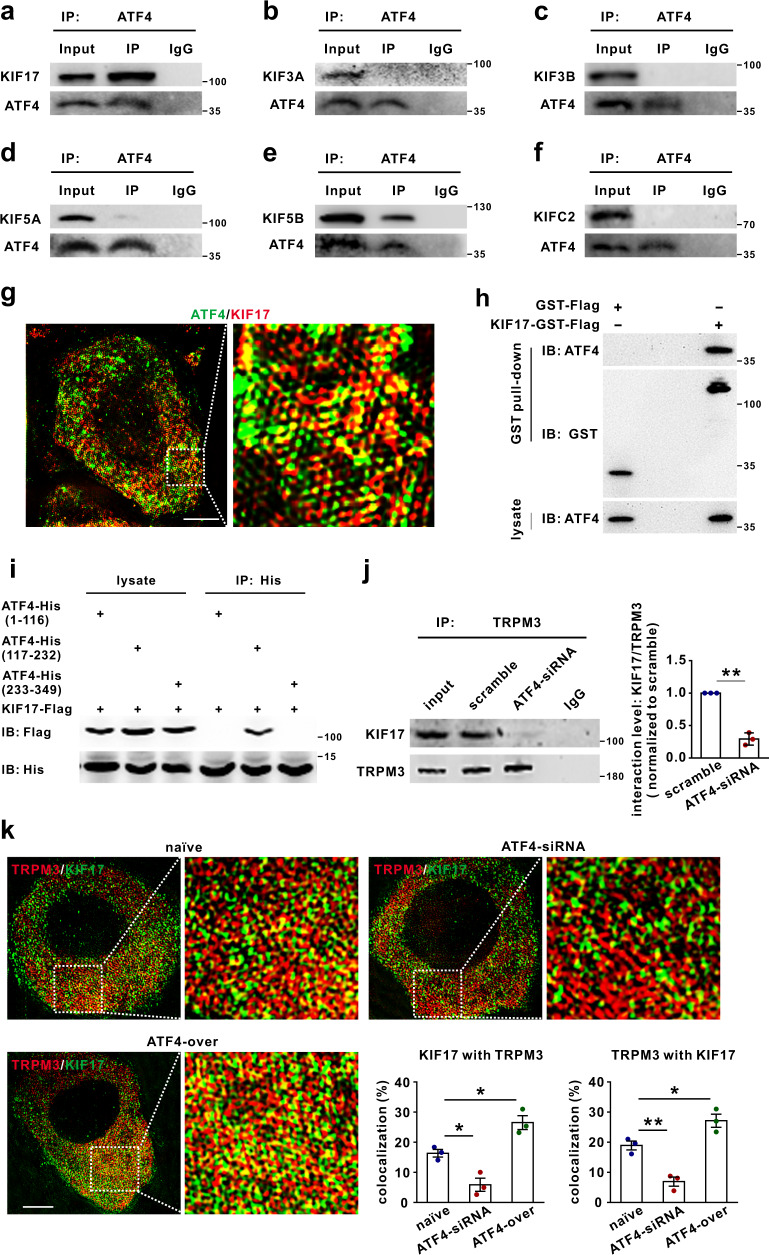
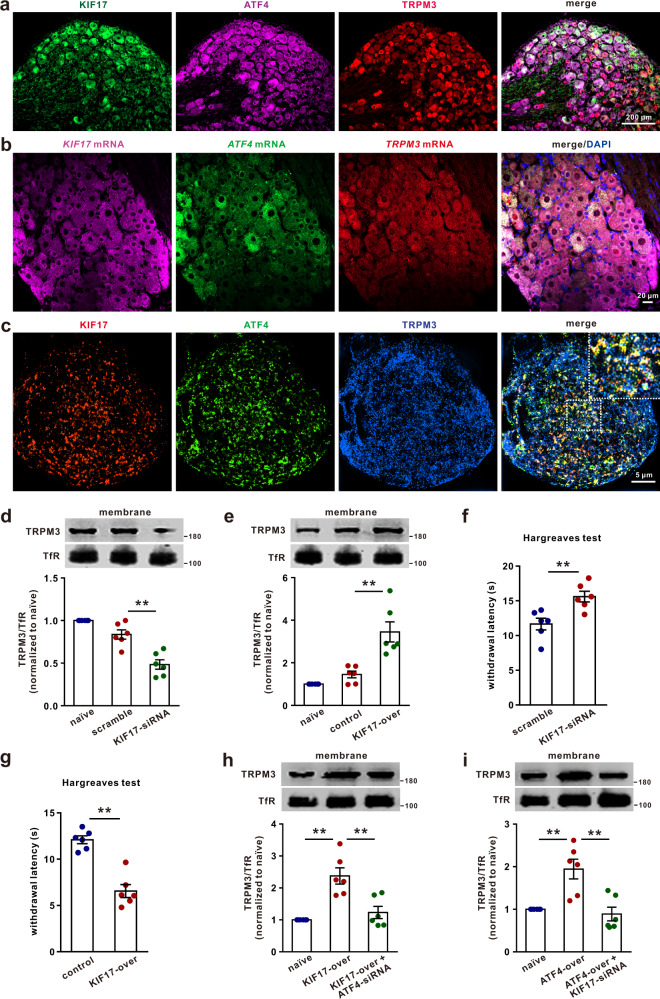
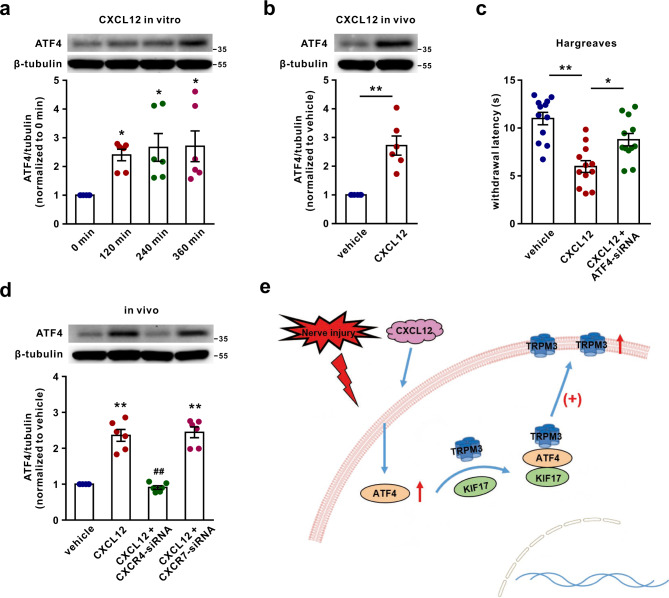
Effective treatments for patients suffering from heat hypersensitivity are lacking, mostly due to our limited understanding of the pathogenic mechanisms underlying this disorder. In the nervous system, activating transcription factor 4 (ATF4) is involved in the regulation of synaptic plasticity and memory formation. Here, we show that ATF4 plays an important role in heat nociception. Indeed, loss of ATF4 in mouse dorsal root ganglion (DRG) neurons selectively impairs heat sensitivity. Mechanistically, we show that ATF4 interacts with transient receptor potential cation channel subfamily M member-3 (TRPM3) and mediates the membrane trafficking of TRPM3 in DRG neurons in response to heat. Loss of ATF4 also significantly decreases the current and KIF17-mediated trafficking of TRPM3, suggesting that the KIF17/ATF4/TRPM3 complex is required for the neuronal response to heat stimuli. Our findings unveil the non-transcriptional role of ATF4 in the response to heat stimuli in DRG neurons.


Conflict of interest statement

All other authors declare no competing interests.

Figures

Fig. 1
Fig. 1. Distribution of ATF4 in primary sensory neurons.
a Left, image of immunostaining showing broad ATF4 expression in mouse DRG neurons. Middle, ATF4 expression was decreased in Atf4+/− mice. Right, absence of ATF4 immunostaining upon treatment with a blocking peptide. Scale bar, 200 μm. b Size frequency distribution of ATF4-positive and total neurons in the mouse DRG. A total of 1489 neurons from n = 4 mice were analysed. c, d Colocalization of ATF4 and cell markers (IB4, CGRP and NF200) in the DRG (c) and sciatic nerve (d). Scale bar, 200 μm.
Fig. 2
Fig. 2. Knockdown of ATF4 decreases thermal sensitivity.
aj The behaviours of ATF4 siRNA- and scrambled siRNA-injected mice were evaluated by the von Frey (a), dynamic (b), tape (c), tail clip (d), pinprick (e), Hargreaves (f), tail-flick (g), hot plate (h), evaporative cooling (i) and rotarod (j) tests. n = 12 mice per group in ag, i. n = 12 mice in scrambled and n = 11 mice in ATF4 siRNA group in h. n = 10 mice per group in j. t22 = 4.783, P < 0.0001 in f. t22 = 5.163, P < 0.0001 in 48 °C; t22 = 5.661, P < 0.0001 in 50 °C; t22 = 10.30, P < 0.0001 in 52 °C in g. t21 = 2.357, P = 0.0282 in 52 °C; t21 = 2.804, P = 0.0106 in 55 °C in h. k, l ATF4 siRNA abated SNL-induced thermal hyperalgesia (k) but not mechanical allodynia (l). n = 12 mice per group. F(1,22) = 56.9, P < 0.0001 in day 0, P = 0.0095 in day 4, P = 0.0013 in day 7, P = 0.0009 in day 10, P = 0.0089 in day 14 in k. m, n ATF4 siRNA abated CFA-induced heat hyperalgesia (m) but not mechanical allodynia (n). n = 8 mice per group. F(1,14) = 121.6, P < 0.0001 in day 0, P = 0.0007 in day 1, P < 0.0001 in day 3, P = 0.0098 in day 5 in m. o, p Spontaneous pain: total duration (o) or number (p) of nocifensive behaviour (paw licking or flinching within 2 min) in response to intraplantar injection of vehicle, PS (2.5 nmol/paw) or CIM0216 (2.5 nmol/paw) into ATF4 siRNA and scrambled mice. n = 10 mice per group. t18 = 3.231, P = 0.0046 in PS, t18 = 3.286, P = 0.0041 in CIM0216 in o. t18 = 2.429, P = 0.0258 in PS, t18 = 3.327, P = 0.0038 in CIM0216 in p. q Spontaneous pain: total duration of nocifensive behaviour (within 5 min) in response to intrathecal injection of vehicle, PS (1.25 nmol/paw) or CIM0216 (1.25 nmol/paw) into ATF4 siRNA and scrambled mice. n = 10 mice per group. t18 = 3.281, P = 0.0042 in PS, t18 = 3.024, P = 0.0073 in CIM0216. aj, oq Two-tailed Independent Student’s t test; kn Two-way ANOVA followed by Bonferroni’s multiple comparisons test. *P < 0.05, **P < 0.01, n.s. means not significant. The error bars indicate the SEMs.
Fig. 3
Fig. 3. Loss of ATF4 impaired heat nociception, and re-expression of ATF4 rescued heat nociception.
aj The behaviours of WT, Atf4+/− and rescued mice were evaluated by the von Frey (a), dynamic (b), tape (c), tail clip (d), pinprick (e), Hargreaves (f), tail-flick (g), hot plate (h), evaporative cooling (i) and rotarod (j) tests. n = 10 mice in WT, n = 7 mice in Atf4+/− and n = 6 mice in rescue group. F(2,20) = 12.11, P = 0.0004 in WT vs. Atf4+/−, P = 0.0050 in Atf4+/− vs. rescue in f. F(2,20) = 12.59, P = 0.0008 in WT vs. Atf4+/−, P = 0.0009 in Atf4+/− vs. rescue in 48 °C; F(2,20) = 20.67, P < 0.0001 in WT vs. Atf4+/−, P = 0.0002 in Atf4+/− vs. rescue in 50 °C; F(2,20) = 8.924, P = 0.0024 in WT vs. Atf4+/−, P = 0.0076 in Atf4+/− vs. rescue in 52 °C in g. F(2,20) = 7.097, P = 0.0159 in WT vs. Atf4+/−, P = 0.0066 in Atf4+/− vs. rescue in 50 °C; F(2,20) = 5.678, P = 0.0135 in WT vs. Atf4+/−, P = 0.0375 in Atf4+/− vs. rescue in 52 °C; F(2,20) = 21.31, P < 0.0001 in WT vs. Atf4+/−, P < 0.0001 in Atf4+/− vs. rescue in 55 °C in h. k, l Knockout and rescue of ATF4 impaired and rescued SNL-induced heat hyperalgesia (k) but not mechanical allodynia (l), respectively. n = 10 mice in WT, n = 9 mice in Atf4+/− and n = 9 mice in rescue group. F(2,25) = 36; P = 0.0038 in WT vs. Atf4+/−, P = 0.0098 in Atf4+/− vs. rescue in day 0; P = 0.0002 in WT vs. Atf4+/−, P < 0.0001 in Atf4+/− vs. rescue in day 4; P = 0.0145 in WT vs. Atf4+/−, P = 0.0170 in Atf4+/− vs. rescue in day 7; P = 0.0105 in WT vs. Atf4+/−, P = 0.0034 in Atf4+/− vs. rescue in day 10; P = 0.0174 in WT vs. Atf4+/−, P = 0.0087 in Atf4+/− vs. rescue in day 14 in k. F(2,25) = 1.112; P = 0.0171 in WT vs. Atf4+/−, P = 0.0074 in Atf4+/− vs. rescue in day 14 in l. m, n Knockout and rescue of ATF4 impaired and rescued CFA-induced heat hyperalgesia (m) but not mechanical allodynia (n), respectively. n = 10 mice in WT, n = 9 mice in Atf4+/− and n = 9 mice in rescue group. F(2,25) = 108.5; P = 0.0002 in WT vs. Atf4+/−, P = 0.0005 in Atf4+/− vs. rescue in day 0; P = 0.0045 in WT vs. Atf4+/−, P = 0.0086 in Atf4+/− vs. rescue in day 1; P = 0.0001 in WT vs. Atf4+/−, P = 0.0017 in Atf4+/− vs. rescue in day 3; P = 0.0006 in WT vs. Atf4+/−, P < 0.0001 in Atf4+/− vs. rescue in day 5. o, p Spontaneous pain: total duration (o) or number (p) of nocifensive behaviour (paw licking or flinching within 2 min) in response to intraplantar injection of vehicle, PS (2.5 nmol/paw) or CIM0216 (2.5 nmol/paw) into WT, Atf4+/− and rescued mice. n = 10 mice per group. F(2,27) = 6.375, P = 0.0368 in WT vs. Atf4+/−, P = 0.0056 in Atf4+/− vs. rescue in PS; F(2,27) = 9.174, P = 0.0027 in WT vs. Atf4+/−, P = 0.0026 in Atf4+/− vs. rescue in CIM0216 in o. F(2,27) = 5.976, P = 0.0201 in WT vs. Atf4+/−, P = 0.0123 in Atf4+/− vs. rescue in PS; F(2,27) = 7.569, P = 0.0033 in WT vs. Atf4+/−, P = 0.0138 in Atf4+/− vs. rescue in CIM0216 in p. q Spontaneous pain: total duration of nocifensive behaviour (in 5 min) in response to intrathecal injection of vehicle, PS (1.25 nmol/paw) or CIM0216 (1.25 nmol/paw) into WT, Atf4+/− and rescued mice. n = 10 mice per group. F(2,27) = 5.849, P = 0.0194 in WT vs. Atf4+/−, P = 0.0146 in Atf4+/− vs. rescue in PS; F(2,27) = 5.986, P = 0.0127 in WT vs. Atf4+/−, P = 0.0192 in Atf4+/− vs. rescue in CIM0216. aj, oq, One-way ANOVA followed by Tukey’s multiple comparisons test. kn Two-way ANOVA followed by Bonferroni’s multiple comparisons test. *P < 0.05, **P < 0.01, n.s. means not significant. The errors bars indicate the SEMs.
Fig. 4
Fig. 4. Overexpression of ATF4 increases heat sensitivity.
aj The behaviours of ATF4-overexpressing and control mice were evaluated by the von Frey (a), dynamic (b), tape (c), tail clip (d), pinprick (e), Hargreaves (f), tail-flick (g), hot plate (h), evaporative cooling (i) and rotarod (j) tests. n = 12 mice per group in ae, g, h, j. n = 10 mice per group in f, i. t18 = 6.308, P < 0.0001 in f. t22 = 6.893, P < 0.0001 in 48 °C; t22 = 8.009, P < 0.0001 in 50 °C; t22 = 6.831, P < 0.0001 in 52 °C in g. t22 = 2.373, P = 0.0268 in 50 °C; t22 = 2.245, P = 0.0352 in 52 °C; t22 = 2.396, P = 0.0255 in 55 °C in h. k, l Spontaneous pain: total duration (k) or number (l) of nocifensive behaviour (paw licking or flinching within 2 min) in response to intraplantar injection of vehicle, PS (2.5 nmol/paw) or CIM0216 (2.5 nmol/paw) into control and ATF4-overexpressing mice. n = 10 mice per group. t18 = 2.411, P = 0.0268 in PS; t18 = 2.795, P = 0.0120 in CIM0216 in k. t18 = 2.775, P = 0.0125 in PS; t18 = 2.334, P = 0.0314 in CIM0216 in l. m Spontaneous pain: total duration of nocifensive behaviour (in 5 min) in response to intrathecal injection of vehicle, PS (1.25 nmol/paw) or CIM0216 (1.25 nmol/paw) into control and ATF4-overexpressing mice. n = 10 mice per group. t18 = 2.506, P = 0.0220 in PS; t18 = 2.46, P = 0.0242 in CIM0216. am, Two-tailed Independent Student’s t test, *P < 0.05, **P < 0.01, n.s. means not significant. The error bars indicate the SEMs.
Fig. 5
Fig. 5. ATF4 mediates TRPM3 trafficking in DRG neurons.
ac TRPM3 expression in the DRG membrane fraction (a), cytoplasmic fraction (b) and total lysate (c) from WT and Atf4+/− mice. n = 3 mice per group. t4 = 10.3, P = 0.0005 in a. t4 = 6.043, P = 0.0038 in b. d TRPM3 surface levels were measured in cultured DRG neurons prepared from WT and Atf4+/− mice using a surface biotinylation assay. n = 3 cultures per group. t4 = 6.28, P = 0.0033. e Co-IP showing the ATF4/TRPM3 interaction in DRGs. DRG lysates were immunoprecipitated with an ATF4 (top) or TRPM3 (bottom) antibody and immunoblotted with a TRPM3 or ATF4 antibody as indicated. This experiment was repeated three times. f The SIM images show that the colocalization between ATF4 and TRPM3 in DRG neurons. Scale bar, 5 μm. g The GST pull-down assay with two purified proteins, TRPM3-GST-Flag and ATF4, showed a direct interaction between ATF4 and TRPM3. This experiment was repeated three times. h Interaction between TRPM3 and ATF4 mutants. The ATF4 mutants was transiently co-expressed with TRPM3, and the cell lysates were immunoprecipitated with a His antibody and then immunoblotted with a His or Flag antibody as indicated. This experiment was repeated three times. ik TRPM3 expression in the DRG membrane fraction (i), cytoplasmic fraction (j) and total lysate (k) after ATF4 overexpression. n = 6 mice per group. F(2,15) = 14.31, P = 0.0007 in i. F(2,15) = 30.15, P < 0.0001 in j. l, n, p Time course of a whole-cell patch-clamp recording showing the effect of CIM0216 (3 μM) and isosakuranetin (Iso; 10 μM) on the TRPM3 current in DRG neurons from WT (l), Atf4+/− (n) and rescued (p) mice. The open circle indicates the outward current recorded at + 75 mV, and the closed circle indicates the inward current recorded at −75 mV. m, o, q I–V relationship of the TRPM3 current at the time points indicated in I, n and p. r Histogram of the TRPM3 current density (outward and inward, current before CIM0216 was subtracted) of DRG neurons from WT, Atf4+/− and ATF4 rescued mice after CIM0216 treatment. n = 6 neurons per group. F(2,15) = 8.735, P = 0.0049 in WT vs. Atf4+/−, P = 0.0097 in Atf4+/− vs. rescue in +75 mV; F(2,15) = 9.158, P = 0.0038 in WT vs. Atf4+/−, P = 0.0089 in Atf4+/− vs. rescue in −75 mV. ad Two-tailed Independent Student’s t test. i, j, k, r, One-way ANOVA followed by Tukey’s multiple comparisons test, *P < 0.05, **P < 0.01, n.s. means not significant. The error bars indicate the SEMs.
Fig. 6
Fig. 6. Heat stimulation stabilises TRPM3 in the DRG membrane.
a The diagram shows the experimental procedure. The hindpaws of mice were soaked in a 43 °C water bath for 30 s, and the mice were placed at RT for 2, 5, 10, 20 or 40 min. Then, behavioural, co-IP and membrane protein immunoblotting experiments were performed. b, c ATF4/TRPM3 interactions (b) and TRPM3 membrane expression (c) in mice were evaluated at different time points after heat stimulation. The experiment was repeated four times in b. n = 6 mice per group in c. F(5,18) = 20.17, P = 0.0007 in 2 min, P < 0.0001 in 5 min, P < 0.0001 in 10 min, P = 0.0044 in 20 min in b. F(5,30) = 10.59, P = 0.0277 in 2 min, P = 0.0022 in 5 min, P < 0.0001 in 10 min, P = 0.0027 in 20 min in c. *P < 0.05, **P < 0.01 versus the RT group. d The diagram shows the experimental procedure. Isolated DRG neurons were placed in a 43 °C water bath for 30 s and placed at RT for 2, 5, 10, 20 or 40 min. The neurons were then lysed to detect the membrane abundance of TRPM3. e TRPM3 membrane expression in isolated DRG neurons was evaluated at different time points after direct heat stimulation. n = 3. F(5,12) = 12.3, P = 0.0358 in 2 min, P = 0.0100 in 5 min, P < 0.0001 in 10 min, P = 0.0085 in 20 min. *P < 0.05, **P < 0.01 versus the RT group. fh Naïve (f), ATF4 siRNA-injected (g) and Atf4+/− (h) mice were subjected to the Hargreaves test at different time points after heat stimulation. n = 12 mice per group in f, g. n = 6 mice per group in h. F(5,66) = 14.36, P = 0.0004 in 2 min, P < 0.0001 in 5 min, P < 0.0001 in 10 min, P = 0.0057 in 20 min. **P < 0.01 versus RT group. One-way ANOVA followed by Tukey’s multiple comparisons test. The error bars indicate the SEMs.
Fig. 7
Fig. 7. ATF4 interacted with KIF17 in the DRG tissues of mice.
af Co-IP showing the ATF4/KIF interaction in the DRG. DRG lysates were immunoprecipitated with an ATF4 antibody and immunoblotted with a KIF17, KIF3A, KIF3B, KIF5A, KIF5B, KIFC2 or ATF4 antibody as indicated. This experiment was repeated three times. g SIM images show that the colocalization between ATF4 and KIF17 in DRG neurons. Scale bar, 5 μm. h The GST pull-down assay with two purified proteins, KIF17-GST-Flag and ATF4, showed a direct interaction between ATF4 and KIF17. This experiment was repeated three times. i Interaction between KIF17 and ATF4 mutants. The ATF4 mutants were transiently co-expressed with KIF17, and the cell lysates were immunoprecipitated with a His antibody and then immunoblotted with a His or Flag antibody as indicated. This experiment was repeated three times. j The interaction level between TRPM3 and KIF17 was examined by co-IP in scrambled and ATF4 siRNA-treated mice DRG lysates. DRG lysates were immunoprecipitated with a TRPM3 antibody and immunoblotted with a KIF17 or TRPM3 antibody as indicated. This experiment was repeated three times. t4 = 12.88, P = 0.0002. k SIM images showed the colocalization between TRPM3 and KIF17 in DRG neurons from naïve, ATF4 siRNA and ATF4-overexpresing mice. Quantification data showed the colocalization rates of KIF17 with TRPM3 (colocalized yellow spots/total KIF17 positive spots) and those of TRPM3 with KIF17 (colocalized yellow spots/total TRPM3 positive spots) in DRG neurons. n = 3 mice per group. F(2,6) = 27.17, P = 0.0224 in naïve vs. ATF4-siRNA, P = 0.0255 in naïve vs. ATF4-over in KIF17 with TRPM3. F(2,6) = 33.5, P = 0.0069 in naïve vs. ATF4-siRNA, P = 0.0375 in naïve vs. ATF4-over in TRPM3 with KIF17. Scale bar, 10 μm. j Two-tailed Independent Student’s t test. k One-way ANOVA followed by Tukey’s multiple comparisons test, *P < 0.05, **P < 0.01. The error bars indicate the SEMs.
Fig. 8
Fig. 8. KIF17 is involved in ATF4-dependent TRPM3 membrane trafficking.
a Colocalization of the KIF17, ATF4 and TRPM3 proteins in mouse DRG sections. Scale bar, 200 μm. b Colocalization of KIF17 mRNA, ATF4 mRNA and TRPM3 mRNA in mouse DRG sections. Scale bar, 20 μm. c Colocalization of the KIF17, ATF4 and TRPM3 proteins in DRG neurons was detected by SIM. Scale bar, 5 μm. d, e Changes in the membrane expression of TRPM3 in the DRG after KIF17 knockdown (d) or KIF17 overexpression (e). n = 6 mice per group. F(2,15) = 34.36, P = 0.0002 in d. F(2,15) = 20.48, P = 0.0005 in e. f The behaviours of KIF17 siRNA- and scrambled siRNA-injected mice were evaluated by the Hargreaves test. n = 6 mice per group. t10 = 3.485, P = 0.0059. g The behaviours of KIF17-overexpressing and control mice were evaluated by the Hargreaves test. n = 6 mice per group. t10 = 6.776, P < 0.0001. h ATF4 knockdown suppressed the increased expression of TRPM3 in the membrane induced by KIF17 overexpression. n = 6 mice per group. F(2,15) = 16.19, P = 0.0002 in naïve vs. KIF17-over, P = 0.0014 in KIF17-over vs. KIF17-over + ATF4-siRNA. i KIF17 knockdown inhibited the increase in TRPM3 expression on the cell surface induced by ATF4 overexpression. n = 6 mice per group. F(2,15) = 12.76, P = 0.0025 in naïve vs. ATF4-over, P = 0.0010 in ATF4-over vs. ATF4-over + KIF17-siRNA. **P < 0.01. d, e, h, i One-way ANOVA followed by Tukey’s multiple comparisons test. f, g Two-tailed Independent Student’s t test. The error bars indicate the SEMs.
Fig. 9
Fig. 9. CXCL12 mediates ATF4 upregulation via CXCR4.
a Cultured DRG neurons were treated with CXCL12 (1 μg/mL) for 120, 240 or 360 min, and then ATF4 expression was measured. n = 6. F(3,20) = 4.642, P = 0.0462 in 120 min, P = 0.0154 in 240 min, P = 0.0128 in 360 min. *P < 0.05 versus 0 min. b CXCL12 (1 μg in 10 μL PBS + 0.5% BSA) was intrathecally injected three times every 3 h, and ATF4 expression was measured in the DRG 2 h after the last injection. n = 6 mice per group. t10 = 5.151, P = 0.0004. **P < 0.01. c ATF4 siRNA significantly relieved CXCL12-induced thermal hyperalgesia. n = 12 mice per group. F(2,33) = 15.68, P < 0.0001 in vehicle vs. CXCL12, P = 0.0101 in CXCL12 vs. CXCL12 + ATF4-siRNA. *P < 0.05, **P < 0.01. d CXCR4 siRNA but not CXCR7 siRNA abolished the increase in ATF4 expression in the DRG induced by CXCL12 in vivo. n = 6 mice per group. F(3,20) = 54.47, P < 0.0001 in CXCL12, CXCL12 + CXCR4-siRNA and CXCL12 + CXCR7-siRNA. **P < 0.01 versus the vehicle group, ##P < 0.01 versus the CXCL12 group. e Hypothetical model illustrating that ATF4 interacts with TRPM3 and KIF17 to form a complex to regulate the membrane trafficking of TRPM3 in sensory neurons and thus contributes to thermal sensitivity. a, c, d One-way ANOVA followed by Tukey’s multiple comparisons test. b Two-tailed Independent Student’s t test. The error bars indicate the SEMs.

Similar articles

Cited by

References

    1. Hai T, Hartman MG. The molecular biology and nomenclature of the activating transcription factor/cAMP responsive element binding family of transcription factors: activating transcription factor proteins and homeostasis. Gene. 2001;273:1–11. doi: 10.1016/S0378-1119(01)00551-0. - DOI - PubMed
    1. Hai T, Curran T. Cross-family dimerization of transcription factors Fos/Jun and ATF/CREB alters DNA binding specificity. Proc. Natl Acad. Sci. USA. 1991;88:3720–3724. doi: 10.1073/pnas.88.9.3720. - DOI - PMC - PubMed
    1. Han J, et al. ER-stress-induced transcriptional regulation increases protein synthesis leading to cell death. Nat. Cell Biol. 2013;15:481–490. doi: 10.1038/ncb2738. - DOI - PMC - PubMed
    1. Rutkowski DT, Kaufman RJ. All roads lead to ATF4. Dev. Cell. 2003;4:442–444. doi: 10.1016/S1534-5807(03)00100-X. - DOI - PubMed
    1. Elefteriou F, et al. ATF4 mediation of NF1 functions in osteoblast reveals a nutritional basis for congenital skeletal dysplasiae. Cell Metab. 2006;4:441–451. doi: 10.1016/j.cmet.2006.10.010. - DOI - PMC - PubMed

Publication types

MeSH terms

LinkOut - more resources