. 2021 Mar 3;12(1):1399.
doi: 10.1038/s41467-021-21718-y.

Staphylococcus aureus induces an itaconate-dominated immunometabolic response that drives biofilm formation

Affiliations

Staphylococcus aureus induces an itaconate-dominated immunometabolic response that drives biofilm formation

Kira L Tomlinson et al. Nat Commun. .

Abstract

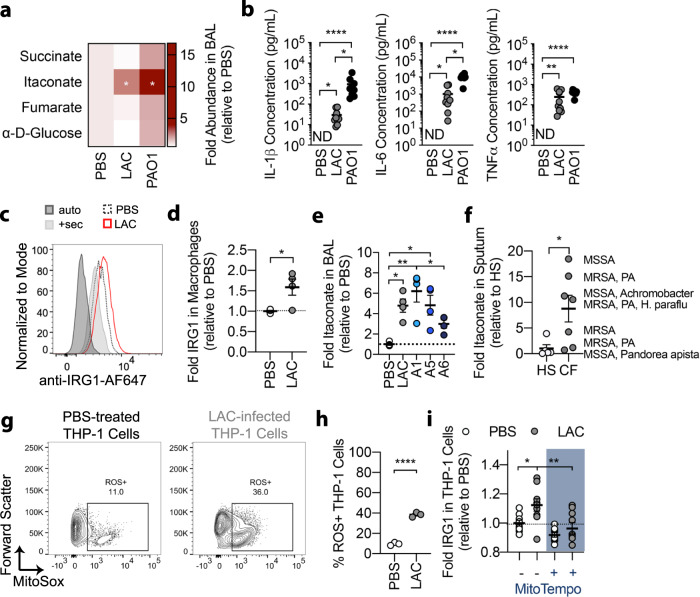
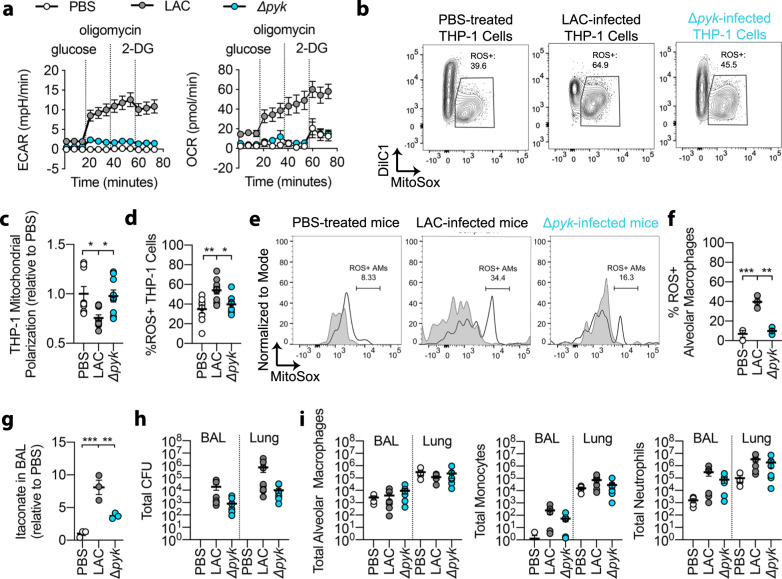
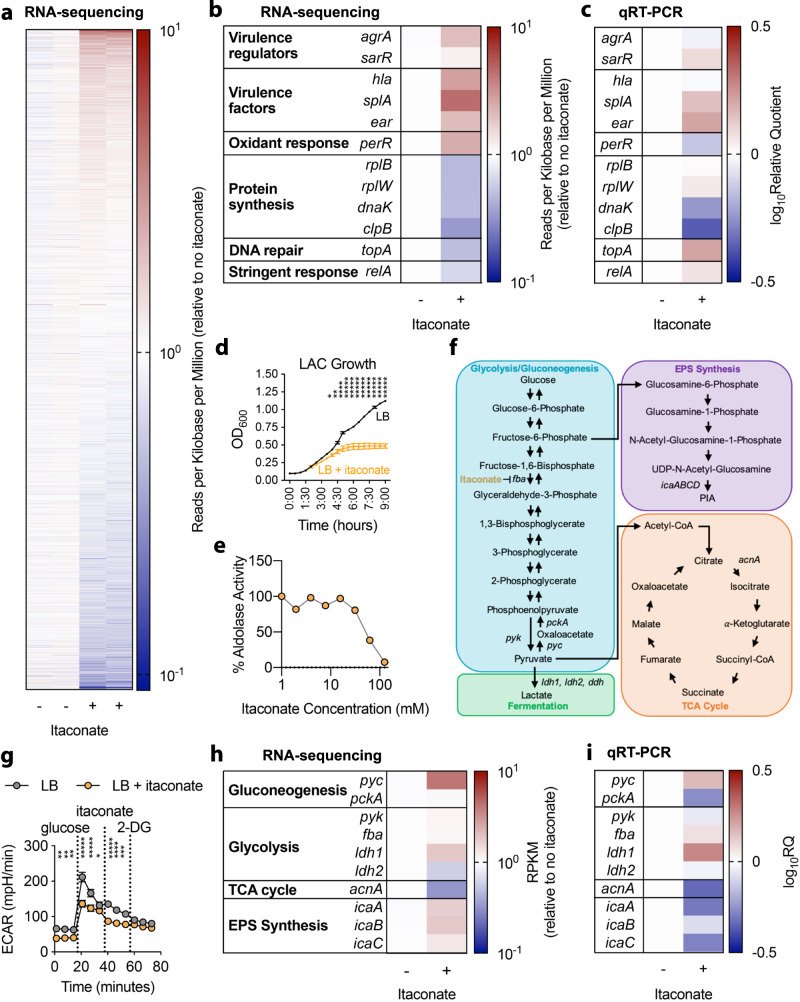
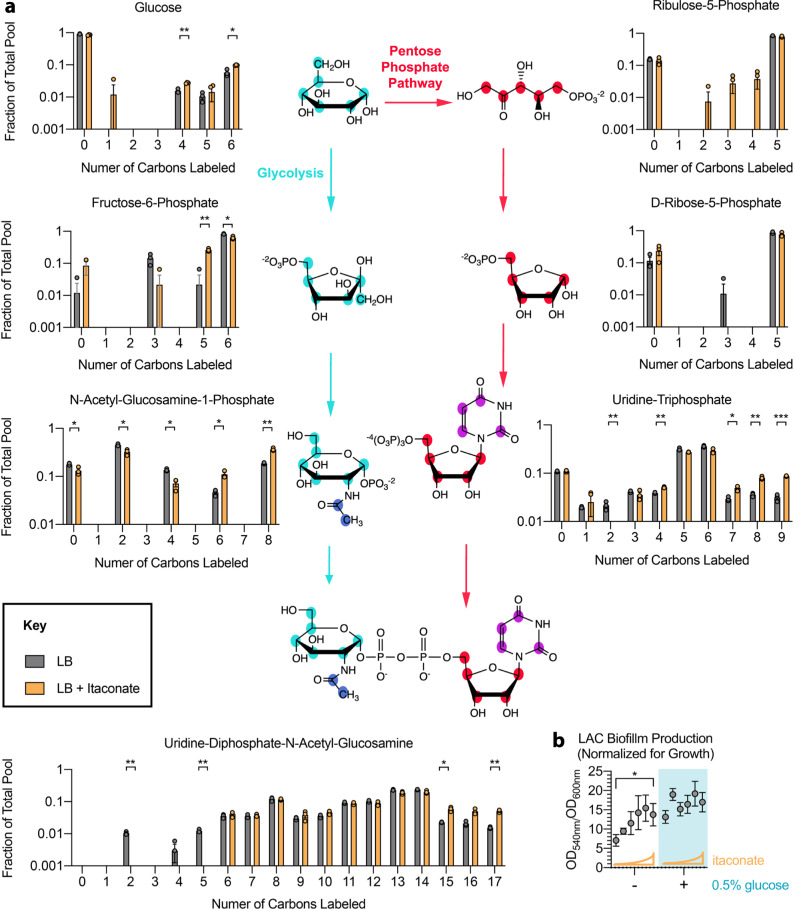
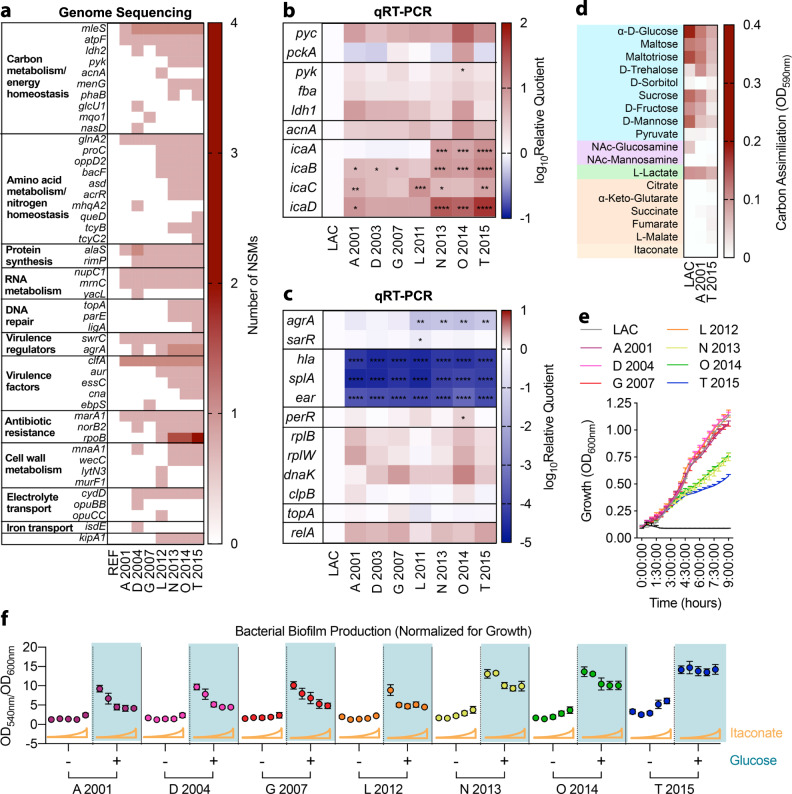
Staphylococcus aureus is a prominent human pathogen that readily adapts to host immune defenses. Here, we show that, in contrast to Gram-negative pathogens, S. aureus induces a distinct airway immunometabolic response dominated by the release of the electrophilic metabolite, itaconate. The itaconate synthetic enzyme, IRG1, is activated by host mitochondrial stress, which is induced by staphylococcal glycolysis. Itaconate inhibits S. aureus glycolysis and selects for strains that re-direct carbon flux to fuel extracellular polysaccharide (EPS) synthesis and biofilm formation. Itaconate-adapted strains, as illustrated by S. aureus isolates from chronic airway infection, exhibit decreased glycolytic activity, high EPS production, and proficient biofilm formation even before itaconate stimulation. S. aureus thus adapts to the itaconate-dominated immunometabolic response by producing biofilms, which are associated with chronic infection of the human airway.


Conflict of interest statement

The authors declare no competing interests.

Figures

Fig. 1
Fig. 1. S. aureus induces itaconate release in the airway.
a Bronchoalveolar lavage (BAL) fluid metabolites and b cytokines from mice treated with PBS or infected with LAC (S. aureus USA300) or PAO1 (P. aeruginosa). c, d Irg1 expression in the alveolar macrophages of PBS-treated or LAC-infected mice. e BAL itaconate from mice infected with the S. aureus clinical isolates A1, A5, A6. f Sputum itaconate from healthy subjects (HS) or CF patients (CF). g, h Mitochondrial ROS generation in PBS-treated and LAC-infected THP-1 cells. i. IRG1 expression in PBS-treated and LAC-infected THP-1 cells treated with a mitochondrial ROS scavenger (MitoTempo) or vehicle (PBS). Data are shown as mean ± SEM from n = 4 mice (a, e), 9 mice (b), 3 mice (c, d, g, h), or 9 biological replicates from 3 independent experiments (i). Significance determined by Two-Way ANOVA with Dunnett’s Multiple Comparisons (a), Kruskal-Wallis (b), two-tailed t-Student (d, f, h), or One-Way ANOVA with Tukey’s Multiple Comparisons (e, i); *P < 0.05; **P < 0.01; ****P < 0.0001.
Fig. 2
Fig. 2. S. aureus glycolytic activity induces host mitochondrial ROS and itaconate production.
a Extracellular acidification rate (ECAR; left panel) and oxygen consumption rate (OCR; right panel) of LAC S. aureus or a glycolytically inactive (Δpyk) mutant. b, c Mitochondrial membrane polarization and b, d ROS generation in THP-1 cells treated with PBS or infected with LAC or ∆pyk. e, f Mitochondrial ROS generation in the alveolar macrophages of mice treated with PBS or infected with LAC or ∆pyk. g Itaconate in the BAL fluid of mice treated with PBS or infected with LAC or ∆pyk. h Total colony forming units (CFU) and i. immune cells in the BAL fluid and lung tissue of mice treated with PBS or infected with LAC or ∆pyk. Data are shown as mean ± SEM from n = 3 biological replicates from 3 independent experiments (a), 9 biological replicates from 3 independent experiments (b, c, d), 3 mice (e, f, g), or 6 mice (h, i). Significance determined by One-Way ANOVA with Tukey’s Multiple Comparisons (c, d, f, g, h, i); *P < 0.05; **P < 0.01; ***P < 0.001.
Fig. 3
Fig. 3. Itaconate induces S. aureus metabolic stress.
a Changes in the S. aureus LAC transcriptome upon exposure to itaconate (30 mM). b, c Stress response gene expression in LAC exposed to itaconate. d LAC growth in the presence of itaconate (30 mM). e Inhibition of LAC aldolase activity by itaconate. f Depiction of S. aureus central carbon metabolism. g Extracellular acidification rate (ECAR) of LAC grown with or without itaconate (30 mM) for 72 hours. h, i Central carbohydrate metabolism gene expression in LAC exposed to itaconate (30 mM). Data are shown as mean ± SEM from n = 2 biological replicates from one independent experiment (a, b, e, h) or 3 biological replicates from 3 independent experiments (c, d, g, i). Significance determined by two-tailed t-student with FDR correction (d, g); *P < 0.05, **P < 0.01, ***P < 0.001, ****P < 0.0001, *****P < 0.00001.
Fig. 4
Fig. 4. Itaconate shunts carbohydrates into production of pro-biofilm EPS in S. aureus.
a 13C-glucose labeling of S. aureus LAC metabolites involved in EPS production in the presence or absence of itaconate (30 mM). For each molecule, the different isotopologues are shown. b Biofilm production (normalized for growth) of LAC in increasing itaconate concentrations (0 to 62 mM), with or without glucose (0.5%). Data are shown as mean ± SEM from n = 3 biological replicates from one independent experiment (a) or 3 independent experiments (b). Significance determined by two-tailed t-Student with FDR correction (a) or One-Way ANOVA with Tukey’s Multiple Comparisons (b); *P < 0.05, **P < 0.01, ***P < 0.001.
Fig. 5
Fig. 5. Clinical isolates exhibit adaptive metabolic changes to itaconate.
a Non-synonymous mutations (NSMs) in the genomes of clinical isolates. REF represents a reference isolate from the same patient. b Expression of central carbohydrate metabolic genes and c stress response genes by the clinical isolates, with respect to LAC. d Utilization of carbon sources that feed glycolysis (blue), EPS synthesis (purple), fermentation (green), or the TCA cycle (orange) by the earliest (A 2001) and latest (T 2015) clinical isolates. e Growth of clinical isolates in LB. f Biofilm production (normalized for growth) of the clinical isolates in increasing itaconate (0 to 62 mM), with or without glucose (0.5%). Data shown as mean ± SEM from n = 3 biological replicates from 3 independent experiments (b, c, d, e, f). Significance determined by One-Way ANOVA with Tukey’s Multiple Comparisons (b, c); *P < 0.05, **P < 0.01, ***P < 0.001, ****P < 0.0001.

Comment in

References

    1. Tong SYC, Davis JS, Eichenberger E, Holland TL, Fowler VG. Staphylococcus aureus infections: epidemiology, pathophysiology, clinical manifestations, and management. Clin. Microbiol. Rev. 2015;28:603–661. doi: 10.1128/CMR.00134-14. - DOI - PMC - PubMed
    1. Planet PJ. Life after USA300: the rise and fall of a superbug. J. Infect. Dis. 2017;215:S71–S77. doi: 10.1093/infdis/jiw444. - DOI - PMC - PubMed
    1. Francis JS, et al. Severe community-onset pneumonia in healthy adults caused by methicillin-resistant Staphylococcus aureus carrying the panton-valentine leukocidin genes. Clin. Infect. Dis. 2005;40:100–107. doi: 10.1086/427148. - DOI - PubMed
    1. Foster TJ. Immune evasion by staphylococci. Nat. Rev. Microbiol. 2005;3:948–958. doi: 10.1038/nrmicro1289. - DOI - PubMed
    1. Thammavongsa V, Kim HK, Missiakas D, Schneewind O. Staphylococcal manipulation of host immune responses. Nat. Rev. Microbiol. 2015;13:529–543. doi: 10.1038/nrmicro3521. - DOI - PMC - PubMed

Publication types

MeSH terms