

Quantitative conversion of biomass in giant DNA virus infection
- PMID: 33658544
- PMCID: PMC7930090
- DOI: 10.1038/s41598-021-83547-9
Quantitative conversion of biomass in giant DNA virus infection
Abstract
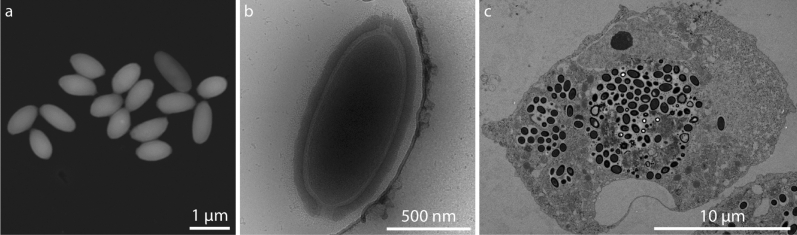
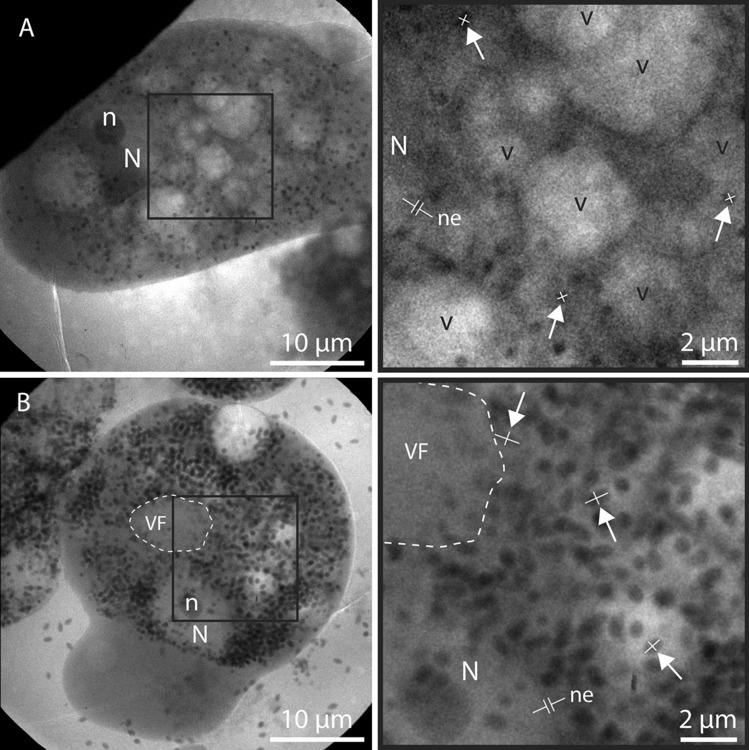
Bioconversion of organic materials is the foundation of many applications in chemical engineering, microbiology and biochemistry. Herein, we introduce a new methodology to quantitatively determine conversion of biomass in viral infections while simultaneously imaging morphological changes of the host cell. As proof of concept, the viral replication of an unidentified giant DNA virus and the cellular response of an amoebal host are studied using soft X-ray microscopy, titration dilution measurements and thermal gravimetric analysis. We find that virions produced inside the cell are visible from 18 h post infection and their numbers increase gradually to a burst size of 280-660 virions. Due to the large size of the virion and its strong X-ray absorption contrast, we estimate that the burst size corresponds to a conversion of 6-12% of carbonaceous biomass from amoebal host to virus. The occurrence of virion production correlates with the appearance of a possible viral factory and morphological changes in the phagosomes and contractile vacuole complex of the amoeba, whereas the nucleus and nucleolus appear unaffected throughout most of the replication cycle.
Conflict of interest statement
The authors declare no competing interests.
Figures


Similar articles
-
Noumeavirus replication relies on a transient remote control of the host nucleus.Nat Commun. 2017 Apr 21;8:15087. doi: 10.1038/ncomms15087. Nat Commun. 2017. PMID: 28429720 Free PMC article.
-
Complex Membrane Remodeling during Virion Assembly of the 30,000-Year-Old Mollivirus Sibericum.J Virol. 2019 Jun 14;93(13):e00388-19. doi: 10.1128/JVI.00388-19. Print 2019 Jul 1. J Virol. 2019. PMID: 30996095 Free PMC article.
-
Characterization of Mollivirus kamchatka, the First Modern Representative of the Proposed Molliviridae Family of Giant Viruses.J Virol. 2020 Mar 31;94(8):e01997-19. doi: 10.1128/JVI.01997-19. Print 2020 Mar 31. J Virol. 2020. PMID: 31996429 Free PMC article.
-
Sputnik, a virophage infecting the viral domain of life.Adv Virus Res. 2012;82:63-89. doi: 10.1016/B978-0-12-394621-8.00013-3. Adv Virus Res. 2012. PMID: 22420851 Review.
-
Mimivirus: leading the way in the discovery of giant viruses of amoebae.Nat Rev Microbiol. 2017 Apr;15(4):243-254. doi: 10.1038/nrmicro.2016.197. Epub 2017 Feb 27. Nat Rev Microbiol. 2017. PMID: 28239153 Free PMC article. Review.
Cited by
-
Morphological and Genomic Features of the New Klosneuvirinae Isolate Fadolivirus IHUMI-VV54.Front Microbiol. 2021 Sep 21;12:719703. doi: 10.3389/fmicb.2021.719703. eCollection 2021. Front Microbiol. 2021. PMID: 34621250 Free PMC article.
-
Sample Preparation Protocol for Laboratory Cryo-Soft X-Ray Microscopy for Studying Cellular Nanoparticle Uptake.Int J Mol Sci. 2025 Feb 15;26(4):1657. doi: 10.3390/ijms26041657. Int J Mol Sci. 2025. PMID: 40004121 Free PMC article.
-
Laboratory Liquid-Jet X-ray Microscopy and X-ray Fluorescence Imaging for Biomedical Applications.Int J Mol Sci. 2024 Jan 11;25(2):920. doi: 10.3390/ijms25020920. Int J Mol Sci. 2024. PMID: 38255992 Free PMC article.
-
Soft X-ray Microscopy in Cell Biology: Current Status, Contributions and Prospects.Acta Naturae. 2023 Oct-Dec;15(4):32-43. doi: 10.32607/actanaturae.26551. Acta Naturae. 2023. PMID: 38234603 Free PMC article.
-
Genomic and structural insights into Jyvaskylavirus, the first giant virus isolated from Finland.Elife. 2025 Mar 25;13:RP103492. doi: 10.7554/eLife.103492. Elife. 2025. PMID: 40131223 Free PMC article.
References
-
- Saunders VA, Carter J. Virology: Principles and Applications. Chichester: Wiley; 2007.
Publication types
MeSH terms
Substances
LinkOut - more resources
Full Text Sources
Other Literature Sources
Research Materials
