. 2021 Mar 3;11(1):5105.
doi: 10.1038/s41598-021-84440-1.

Brain injury after 50 h of lung-protective mechanical ventilation in a preclinical model

Affiliations

Brain injury after 50 h of lung-protective mechanical ventilation in a preclinical model

Thiago G Bassi et al. Sci Rep. .

Abstract

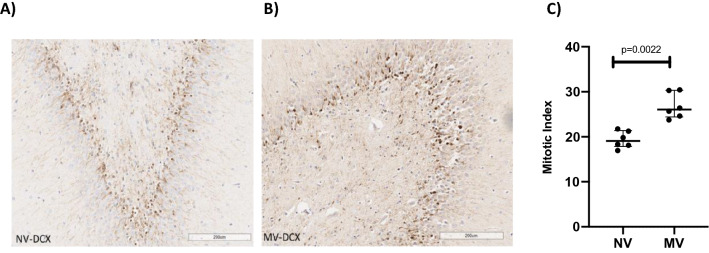
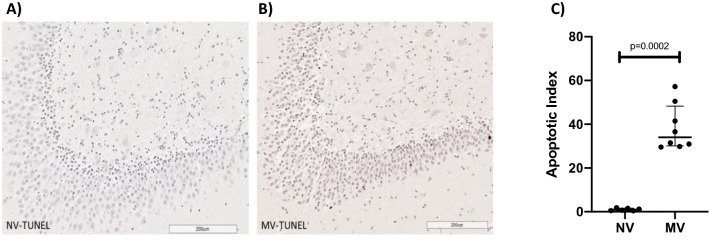
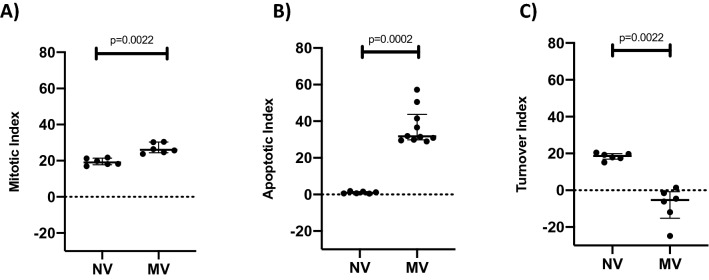
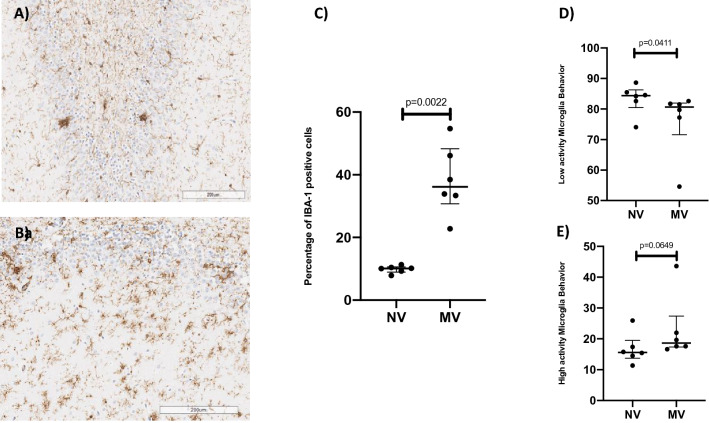
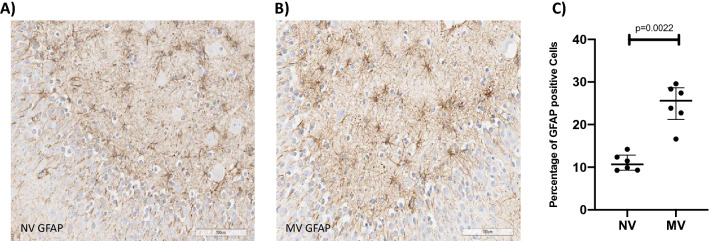
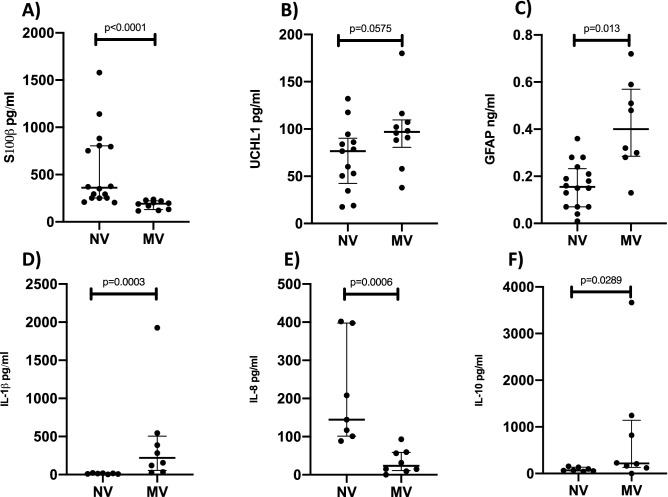
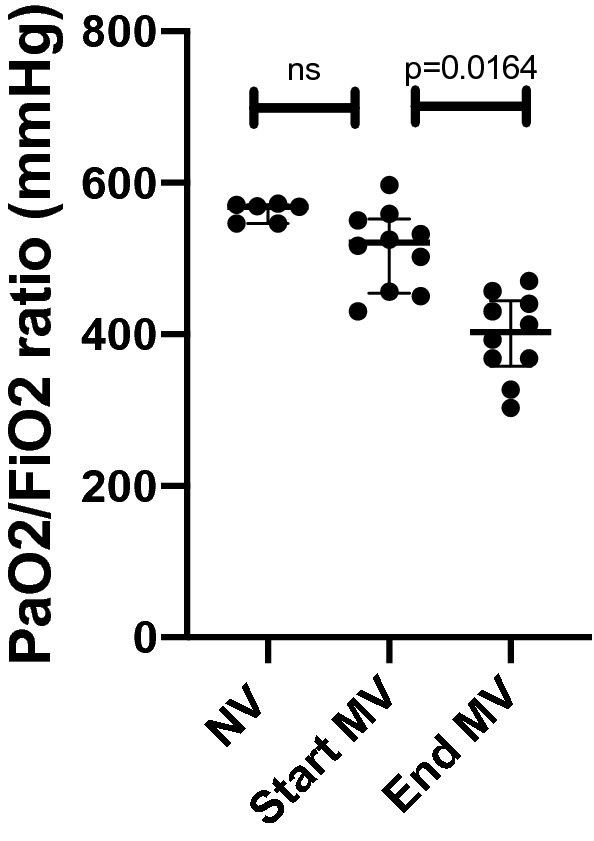
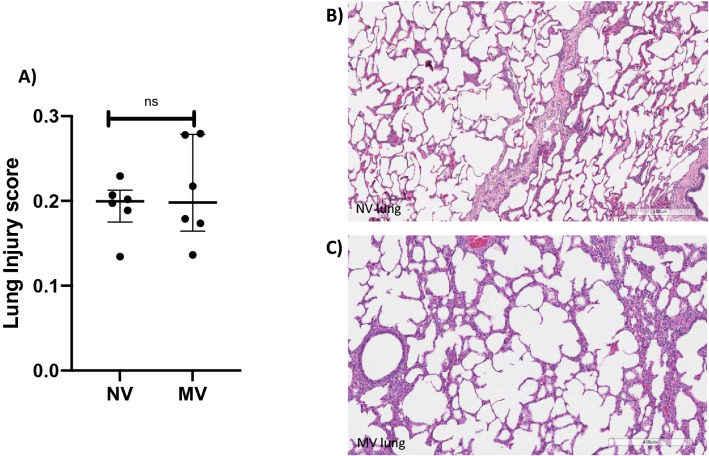
Mechanical ventilation is the cornerstone of the Intensive Care Unit. However, it has been associated with many negative consequences. Recently, ventilator-induced brain injury has been reported in rodents under injurious ventilation settings. Our group wanted to explore the extent of brain injury after 50 h of mechanical ventilation, sedation and physical immobility, quantifying hippocampal apoptosis and inflammation, in a normal-lung porcine study. After 50 h of lung-protective mechanical ventilation, sedation and immobility, greater levels of hippocampal apoptosis and neuroinflammation were clearly observed in the mechanically ventilated group, in comparison to a never-ventilated group. Markers in the serum for astrocyte damage and neuronal damage were also higher in the mechanically ventilated group. Therefore, our study demonstrated that considerable hippocampal insult can be observed after 50 h of lung-protective mechanical ventilation, sedation and physical immobility.


Conflict of interest statement

E.C.R, K.C.F, M.O, M.N and S.C.R have received consulting fees from Lungpacer Medical, Inc. T.G.B, D.E and M.G are employees of Lungpacer Medical, Inc. S.C.R is listed on a patent for Lungpacer Medical, Inc.

Figures

Figure 1
Figure 1
Slides of an NV subject’s hippocampus (A) and an MV subject’s hippocampus (B) after staining by doublecortin (DCX) assay, showing normal cells (blue) and doublecortin-positive cells (brown). Greater neurogenesis can be observed in the MV example than in the NV example. (C) Dot plot showing mitotic indices of 19.07 (17.84–21.38) in the NV group and 26.04 (24.41–30.34) in the MV group, p = 0.0022 (n = 6 per group).
Figure 2
Figure 2
Slide of an NV subject’s hippocampus (A) and an MV subject’s hippocampus (B) after staining by TUNEL assay, showing normal cells (blue) and TUNEL-positive cells (brown). Considerably greater hippocampal cellular apoptosis can be observed in the MV example than in the NV example. (C) Dot plot showing apoptotic indices of 0.96 (0.50–1.61) in the NV group and 31.70 (29.79–43.76) in the MV group p = 0.0002 (n = 6–10 per group).
Figure 3
Figure 3
(A) Dot plot showing mitotic indices of 19.07 (17.84–21.38) in the NV group and 26.04 (24.42–30.34) in the MV group, p = 0.0022 (n = 6 per group). (B) Dot plot showing apoptotic indices of 0.96 (0.50–1.61) in the NV group and 31.70 (29.79–43.76) in the MV group p = 0.0002 (n = 6–10 per group). (C) Dot plot showing turnover indices of + 18.59 (16.86–19.92) in the NV group and − 5.32 (− 15.16- − 0.77) in the MV group, p = 0.0022 (n = 6 per group).
Figure 4
Figure 4
Slide of an NV subject’s hippocampus (A) and an MV subject’s hippocampus (B) after staining by IBA-1, showing normal cells (blue) and IBA-1-positive cells (brown). (C) Dot plot showing percentages of IBA-1-positive cells, combining the two behaviors of microglia, 10.12 (8.93–10.65) in the NV group and 36.17 (30.71–48.27) in the MV group, p = 0.0022 (n = 6 per group). (D) Dot plot showing percentages of low-activity microglia behavior, 84.40 (80.49–86.27) in the NV group and 80.63 (71.59–81.93) in the MV group, p = 0.0411 (n = 6 per group). (E) Dot plot showing percentages of high-activity microglia behavior, 15.60 (13.73–19.51) in the NV group and 18.63 (17.37–27.38) in the MV group, p = 0.0649 (n = 6 per group).
Figure 5
Figure 5
Slide of an NV subject’s hippocampus (A) and an MV subject’s hippocampus (B) after staining by GFAP, showing normal cells (blue) and GFAP-positive cells (brown). (C) Dot plot showing percentages of GFAP-positive cells (astrocytes), 10.69 (9.31–12.85) in the NV group and 25.53 (21.21–28.66) in the MV group, p = 0.0022 (n = 6 per group).
Figure 6
Figure 6
(A) Dot plot showing serum concentrations of S100β, 360.90 pg/ml (252.10–803.60) in the NV group and 193.10 pg/ml (129.20–223.30) in the MV group, p < 0.0001 (n = 10–16 per group). (B) Dot plot showing serum concentrations of UCHL1, 76.57 pg/ml (42.48–90.26) in the NV group and 96.96 ng/ml (80.65–109.60) in the MV group, p = 0.0575 (n = 10–13 per group). (C) Dot plot showing serum concentrations of GFAP, 0.15 ng/ml (0.07–0.23) in the NV group and 0.40 ng/ml (0.28–0.57) in the MV group, p = 0.0013 (n = 8–16 per group). (D) Dot plot showing serum concentrations of IL-1β, 13.39 pg/ml (7.72–17.68) in the NV group and 219.60 pg/ml (56.23–505.40) in the MV group, p = 0.0003 (n = 7–8 per group). (E) Dot plot showing serum concentrations of IL-8, 144.50 pg/ml (100.90–397.90) in the NV group and 23.40 pg/ml (10.88–58.51) in the MV group, p = 0.0006 (n = 7–8 per group). (F) Dot plot showing serum concentrations of IL-10, 67.92 pg/ml (55.60–134.80) in the NV group and 217.50 pg/ml (131.30–1,140.00) in the MV group, p = 0.0289 (n = 7–8 per group).
Figure 7
Figure 7
Dot plot showing the PaO2/FiO2 ratio of the NV group (568 mmHg; 546–571), the PaO2/FiO2 ratio of the MV group at the start of the experiment (521 mmHg; 454–552) and the PaO2/FiO2 ratio of MV group at the end of the experiment (403 mmHg; 357–444). No statistically significant difference was found when comparing the PaO2/FiO2 ratio of the NV group (568 mmHg; 546–571) to the PaO2/FiO2 ratio of the MV group at the start of the experiment (521 mmHg; 454–552, p = 0.3700). The PaO2/FiO2 ratio of MV group at the end of the experiment (403 mmHg; 357–444) when compared to the PaO2/FiO2 ratio of the MV group at the start of the experiment (521 mmHg; 454–552, p = 0.0164) was statistically significant.
Figure 8
Figure 8
(A) Dot plot showing the lung injury scores of the NV group (0.19; 0.17–0.21) and the lung injury scores of the MV group (0.19; 0.16–0.27) with no statistical difference between the groups, p = 0.8182. Lung histology slides stained by hematoxylin and eosin, NV subject (B) and MV subject (C).

References

    1. Goligher EC, Ferguson ND, Brochard LJ. Clinical challenges in mechanical ventilation. The Lancet. 2016;387:1856–1866. doi: 10.1016/S0140-6736(16)30176-3. - DOI - PubMed
    1. Sasannejad C, Ely EW, Lahiri S. Long-term cognitive impairment after acute respiratory distress syndrome: A review of clinical impact and pathophysiological mechanisms. Crit. Care. 2019;23:1–12. doi: 10.1186/s13054-019-2626-z. - DOI - PMC - PubMed
    1. Woldegerima N, Rosenblatt K, Mintz CD. Neurotoxic properties of propofol sedation following traumatic brain injury. Crit. Care Med. 2016;44:455–456. doi: 10.1097/CCM.0000000000001322. - DOI - PMC - PubMed
    1. González-López A, et al. Lung purinoceptor activation triggers ventilator-induced brain injury. Crit. Care Med. 2019 doi: 10.1097/ccm.0000000000003977. - DOI - PMC - PubMed
    1. González-López A, et al. Mechanical ventilation triggers hippocampal apoptosis by vagal and dopaminergic pathways. Am. J. Respir. Crit. Care Med. 2013;188:693–702. doi: 10.1164/rccm.201304-0691OC. - DOI - PubMed

Publication types

MeSH terms