. 2021 Apr;592(7853):262-266.
doi: 10.1038/s41586-021-03299-4. Epub 2021 Mar 3.

Hunger enhances food-odour attraction through a neuropeptide Y spotlight

Affiliations

Hunger enhances food-odour attraction through a neuropeptide Y spotlight

Nao Horio et al. Nature. 2021 Apr.

Abstract

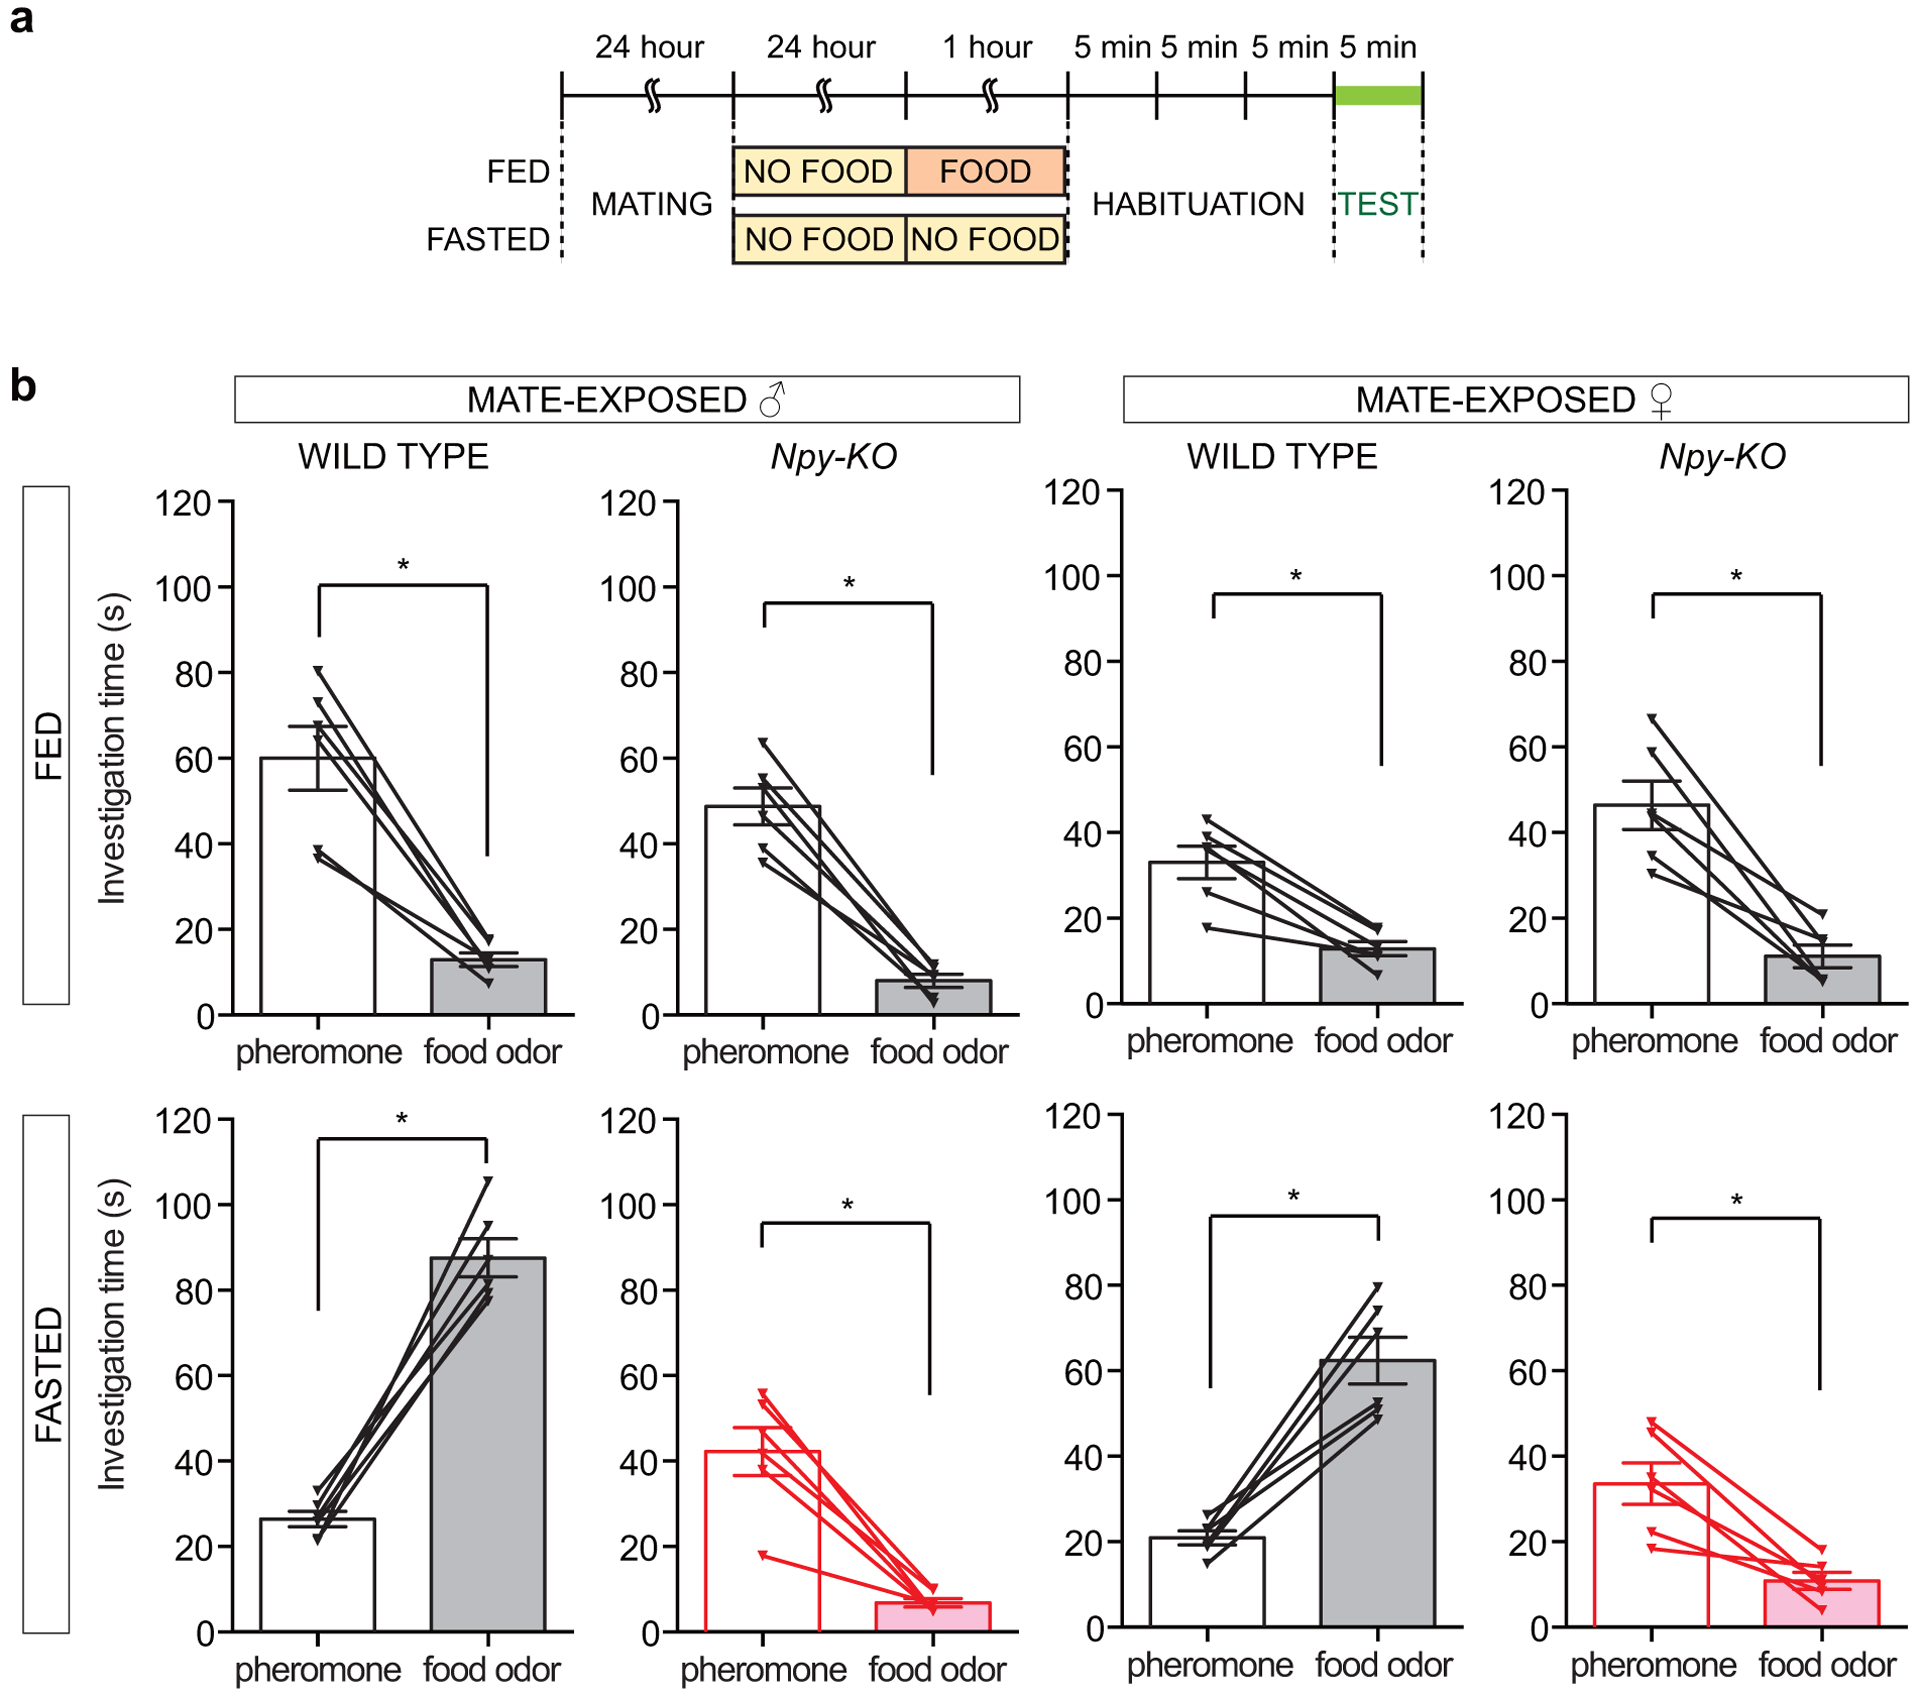
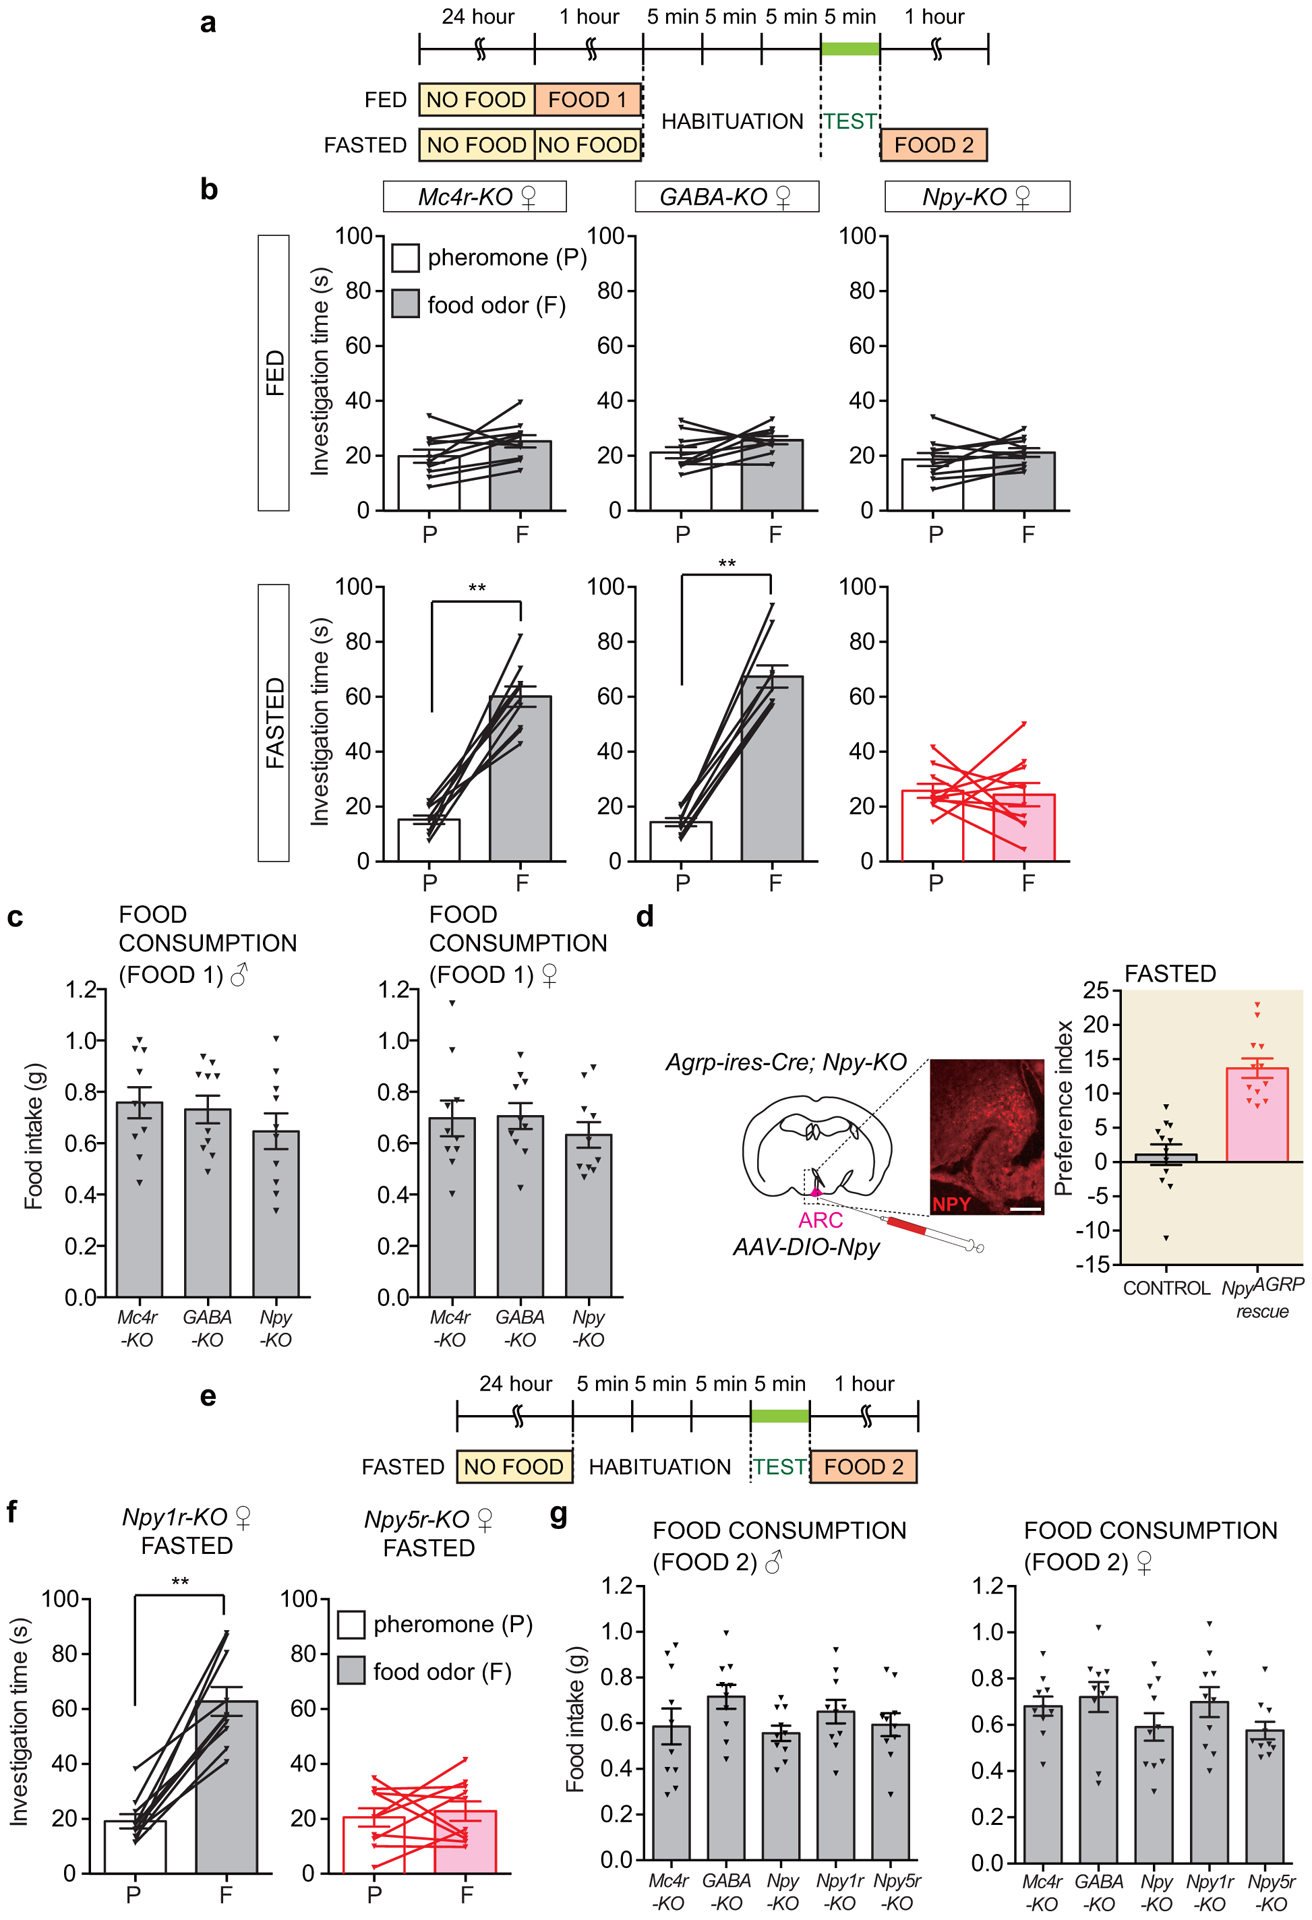
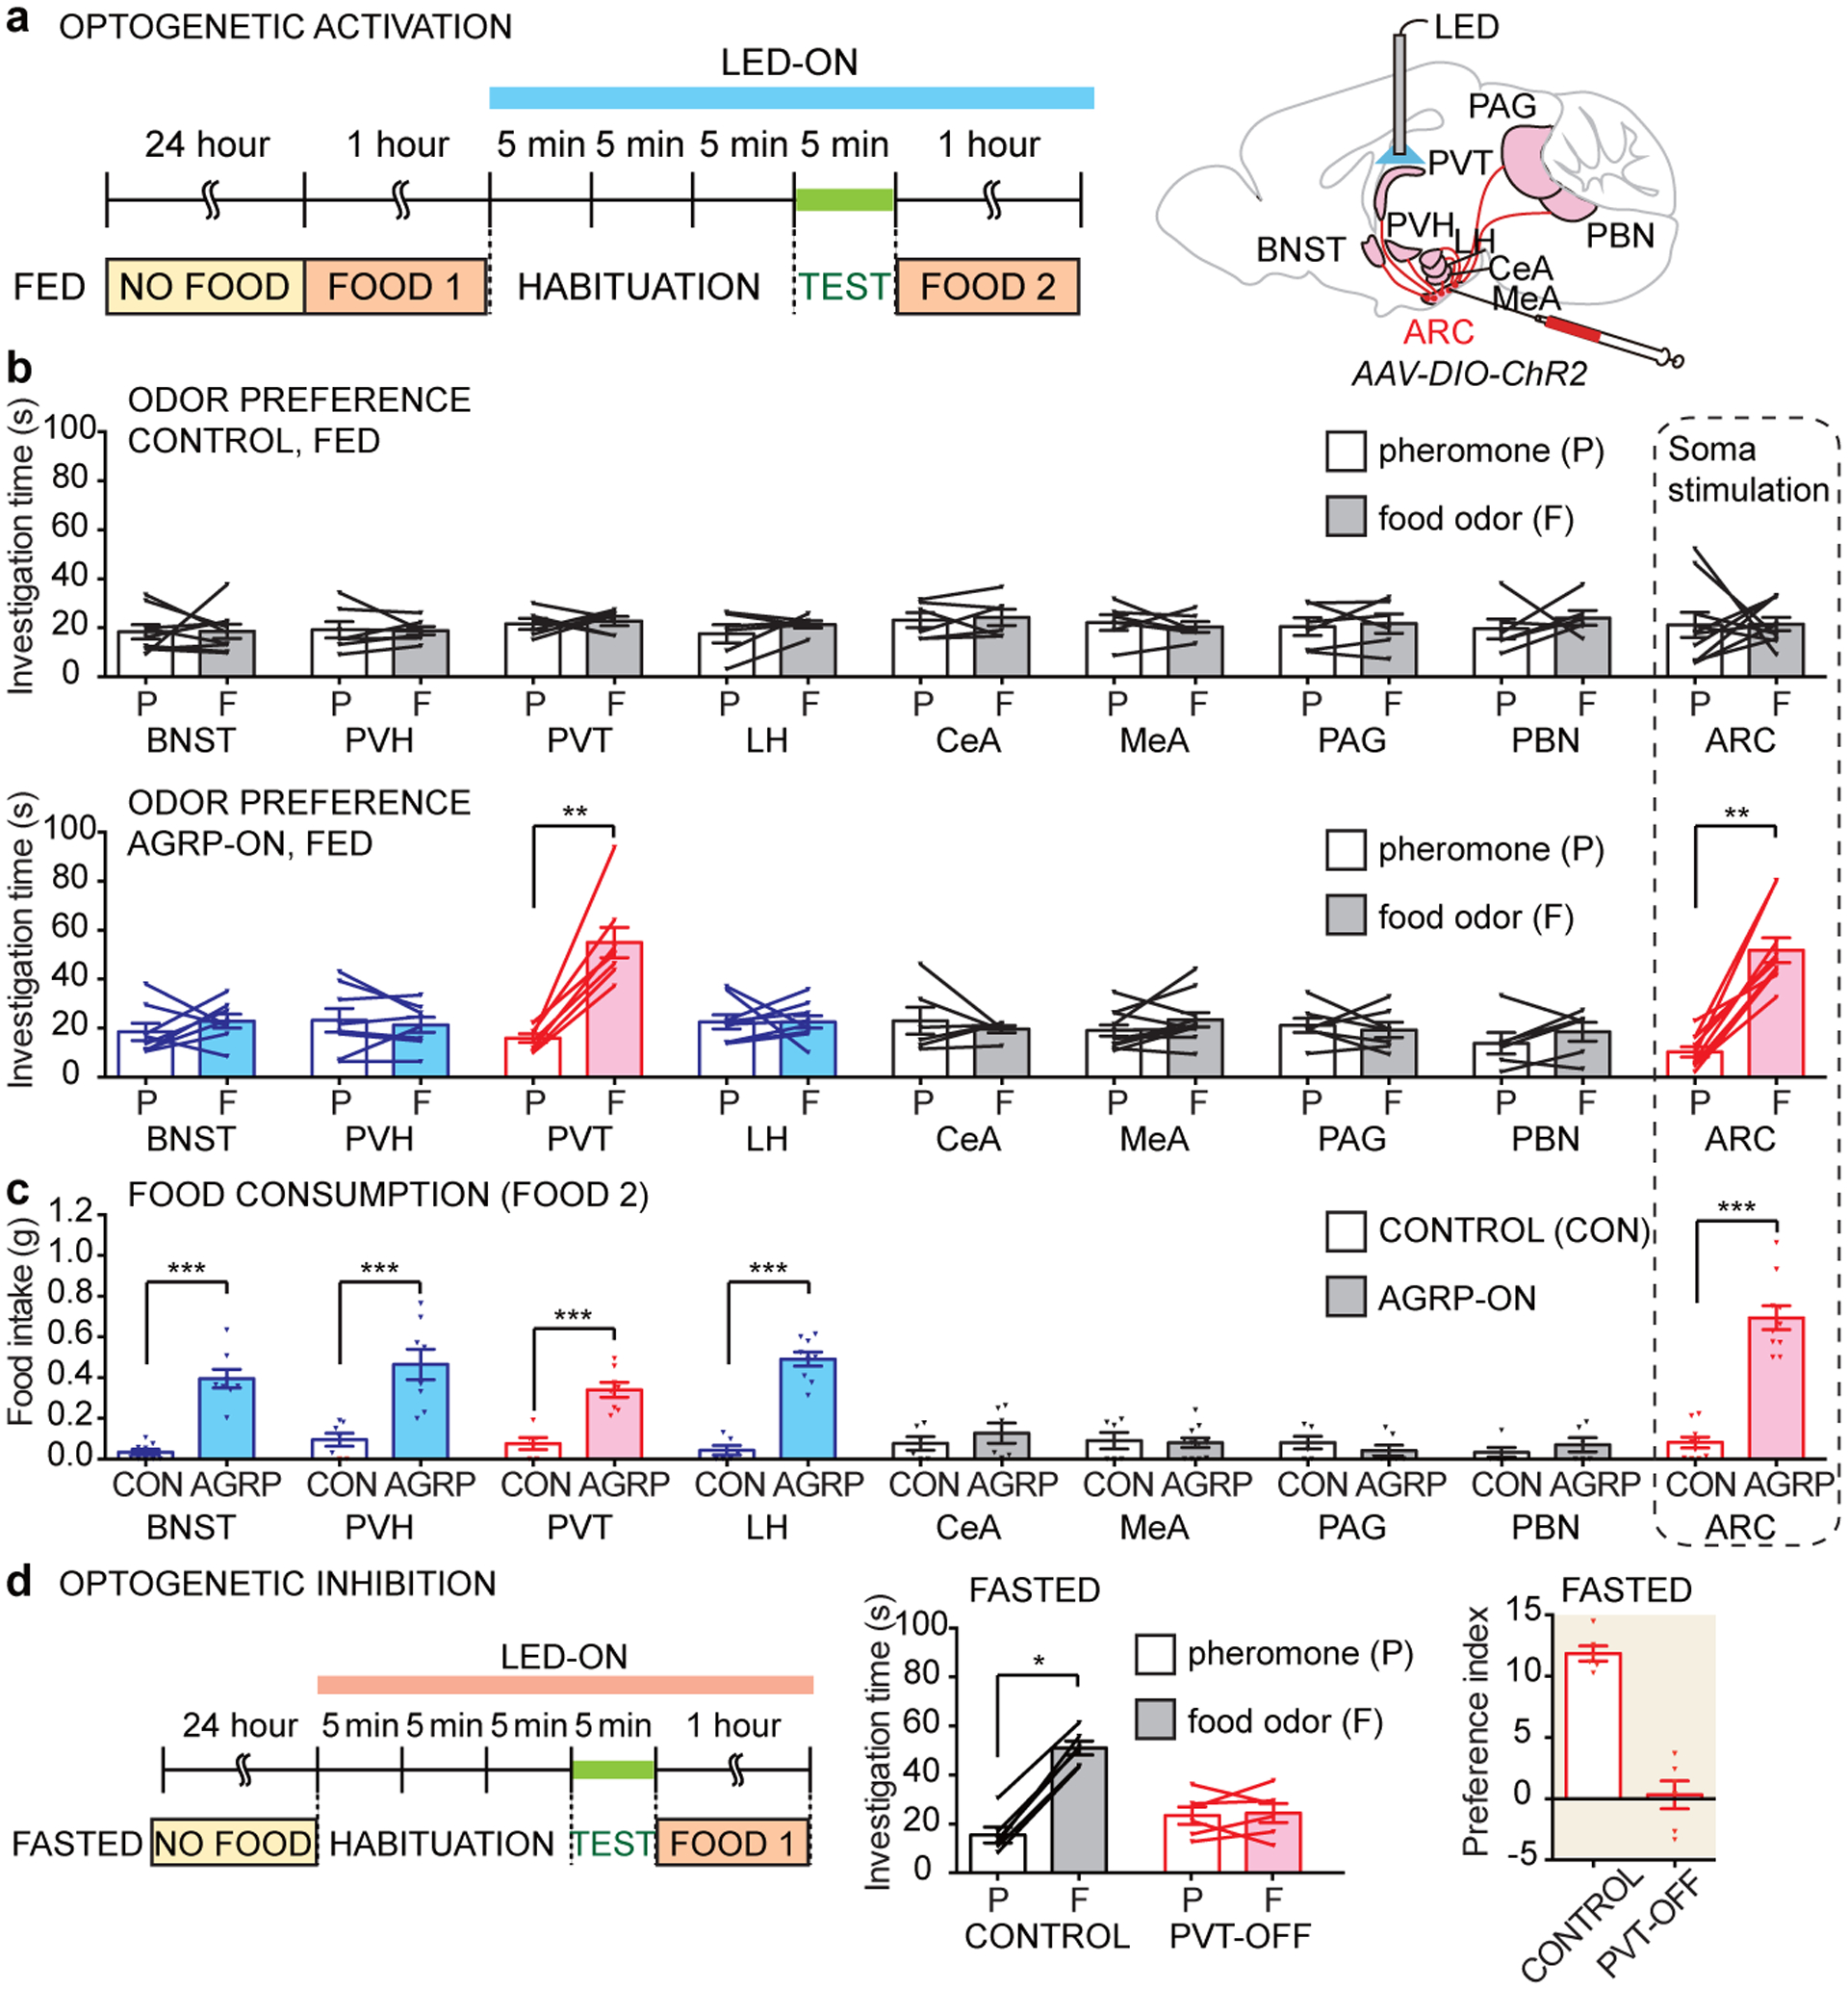
Internal state controls olfaction through poorly understood mechanisms. Odours that represent food, mates, competitors and predators activate parallel neural circuits that may be flexibly shaped by physiological need to alter behavioural outcome1. Here we identify a neuronal mechanism by which hunger selectively promotes attraction to food odours over other olfactory cues. Optogenetic activation of hypothalamic agouti-related peptide (AGRP) neurons enhances attraction to food odours but not to pheromones, and branch-specific activation and inhibition reveal a key role for projections to the paraventricular thalamus. Mice that lack neuropeptide Y (NPY) or NPY receptor type 5 (NPY5R) fail to prefer food odours over pheromones after fasting, and hunger-dependent food-odour attraction is restored by cell-specific NPY rescue in AGRP neurons. Furthermore, acute NPY injection immediately rescues food-odour preference without additional training, indicating that NPY is required for reading olfactory circuits during behavioural expression rather than writing olfactory circuits during odour learning. Together, these findings show that food-odour-responsive neurons comprise an olfactory subcircuit that listens to hunger state through thalamic NPY release, and more generally, provide mechanistic insights into how internal state regulates behaviour.


Conflict of interest statement

Competing interests declaration

The authors declare no competing financial interests.

Figures

Extended Data Figure 1.
Extended Data Figure 1.. Controls for two-choice odor preference assay.
a, Timeline of two-choice behavioral assay. b-c, Odor investigation times of fed (b) and fasted (c) male and female wild type mice in single odor pairings with water. (n=10 males and 10 females for b, 3 males and 3 females for c, mean ± s.e.m, lines with triangles: individual mice, *p<.05, ***p<.001 by two-tailed Wilcoxon test (p left to right in b: <.0001, <.0001, .86; p left to right in c: .03, .03). A statistical comparison of odor responses in b and c using a two-tailed Mann-Whitney U test revealed significant increases in food odor investigation in fasted mice compared with fed mice (p=.0006) but not in pheromone investigation (p=.15). d, Odor investigation times of fed (left) and fasted (right) wild type females, n=10 mice, mean ± s.e.m, lines with triangles: individual mice, **p<.01 by two-tailed Wilcoxon test (p fed: .77, p fasted: .002), e, Odor investigation times of male (left) and female (right) wild type mice fed ad libitum, n=10 mice, mean ± s.e.m, lines with triangles: individual mice, p values by two-tailed Wilcoxon test: male=.92, female=.19.
Extended Data Figure 2.
Extended Data Figure 2.. Mate encounters selectively enhance pheromone attraction in fed mice through an NPY-independent mechanism.
a-b, Timeline of two-choice behavioral assay (a) and odor investigation times (b) after mate exposure, fed (top) and fasted (bottom), male (left) and female (right), wild type and Npy-KO mice, n=6 mice, mean ± s.e.m, lines with triangles: individual mice, *p<.05 by two-tailed Wilcoxon test (p left to right, fed: .03, .03, .03, .03; p left to right, fasted: .03, .03, .03, .03).
Extended Data Figure 3.
Extended Data Figure 3.. Controls for experiments involving optogenetic stimulation of AGRP neuron projections to the PVT.
a, Timeline of two-choice assay involving optogenetic stimulation (blue bar) of AGRP neurons. b, Investigation time of fed control (black) and fed AGRP-ON (red) female mice to pheromones and food odors, n=10 mice, mean ± s.e.m, lines with triangles: individual mice, **p<.01 by two-tailed Wilcoxon test (p control: .32; p AGRP-ON: .02). c, Food intake was measured before (FOOD 1) and after (FOOD 2) the odor preference assay, as indicated in the timeline, for female mice used in b, n=10 mice, mean ± s.e.m, triangles: individual mice, ***p<.001 by Mann–Whitney U test (p FOOD1: .49; p FOOD2: <.0001). d, Preference index was calculated for fed control (unfilled bars, ‘CON’) and fed AGRP-ON (filled bars, ‘AGRP’) mice following illumination of brain regions indicated (n as reported for same mice in Fig. 2b–c, mean ± s.e.m). e, Food intake prior to two-choice assay and optogenetic stimulation (FOOD 1 in timeline) of mice with optic fibers implanted in various brain regions (n as reported for same mice in Fig. 2b–c, mean ± s.e.m, p values by Mann–Whitney U test from left to right: .47, .52, .90, .94, .18, .95, .81, .57, .89). f, Timeline of two-choice behavioral assay involving optogenetic stimulation (blue bar) of AGRP neurons in mice fed ad libitum. g-h, AAV-DIO-ChR2 was injected in the arcuate nucleus of wild type (control) or Agrp-ires-Cre (AGRP-ON) mice, and optic fibers were inserted in PVT. Odor investigation times in the two-choice behavioral assay (g) and post-test food consumption (h, FOOD 1 from timeline in f) from indicated mice fed ad libitum, n=6 (control) and 7 (AGRP-ON) mice, mean ± s.e.m, lines with triangles: individual mice, *p<.05, **p<.01 (p values by two-tailed Wilcoxon test in g: .56, .02; p value by two-tailed Mann–Whitney U test in h: .0012).
Extended Data Figure 4.
Extended Data Figure 4.. Attraction to a newly learned food odor is enhanced by hunger and optogenetic stimulation.
a, Timeline of two-choice behavioral assay before learning. b, Investigation time of fed (left) and fasted (right) wild type male mice to pheromones (unfilled bars) and strawberry gelatin odor (filled bars) before learning, n=10 mice, mean ± s.e.m, lines with triangles: individual mice, **p<.01 by two-tailed Wilcoxon test (p fed: .002; p fasted: .002). c, Timeline of learning paradigm and two-choice behavioral assay after learning. d, Investigation time to pheromones (unfilled bars) and strawberry gelatin odor (filled bars) after learning in wild type fed, wild type fasted mice, wild type fed mice after arcuate nucleus injection of AAV-DIO-ChR2 and PVT illumination (control), and Agrp-ires-Cre fed mice after arcuate nucleus injection of AAV-DIO-ChR2 and PVT illumination, n=6 mice (wild type fed, fasted), 4 (control, PVT) and 8 (AGRP-ON, PVT), mean ± s.e.m, lines with triangles: individual mice, *p<.05, **p<.01 by two-tailed Wilcoxon test (p values from left to right: >.99, .03, .88, .008).
Extended Data Figure 5.
Extended Data Figure 5.. Controls for optogenetic inhibition experiments.
a, AGRP neurons from Agrp-ires-Cre; lsl-Halorhdopsin (Halorhodopsin is expressed as a fusion protein with YFP) or Agrp-ires-Cre; lsl-tdTomato mice were dissociated and responses to light (LED-ON) were measured by whole-cell current clamp recordings. Representative examples (left) and the number of spikes measured (right) across animals before, during, and after photostimulation across mice, with normalization to the pre-illumination period, n=6 cells, mean ± s.e.m, lines: individual cells, **p<.01 by two-tailed Wilcoxon test (p pink PRE vs LIGHT: .03, p pink LIGHT vs POST: .03, p gray PRE vs LIGHT: .78, p gray LIGHT vs POST: .38). An additional statistical test involving one-way ANOVA with Tukey’s multiple comparisons test revealed similar results (pink one-way ANOVA: p=.0003, with Tukey’s multiple comparisons test: PRE vs LIGHT: p<.0001, LIGHT vs POST: p<.001, gray one-way ANOVA p=.53). b, Timeline and cartoon based on published brain section images of optogenetic inhibition experiments in PVT. c, Investigation times in the two-choice behavioral assay during arcuate nucleus illumination in Agrp-ires-Cre (control) or Agrp-ires-Cre; lsl-halorhodopsin (ARC-OFF) mice, n=6 mice, mean ± s.e.m, lines with triangles: individual mice, *p<.05 by two-tailed Wilcoxon test (p control: .03; p ARC-OFF: .44). d, Food consumption after the two-choice odor test (FOOD 1 in timeline) in Agrp-ires-Cre (control) or Agrp-ires-Cre; lsl-halorhodopsin (ARC-OFF, PVT-OFF) mice during ARC (left) or PVT (right) illumination, n=6 mice, mean ± s.e.m, lines with triangles: individual mice, *p<.05 by two-tailed Mann–Whitney U test (p left: .015, p right: .57).
Extended Data Figure 6.
Extended Data Figure 6.. Food odor investigation persists beyond transient AGRP neuron activity decreases measured by fiber photometry.
a, Timeline and depiction of fiber photometry experiments during single odor investigation, with cartoon based on published brain section images. Agrp-ires-Cre mice were injected in the arcuate nucleus (ARC) with AAV-DIO-GCaMP6s, and fiber photometry was performed in the ARC, PVT or PVH during water investigation (TEST A), pheromone investigation (TEST B), food odor investigation (TEST C), and food consumption (FOOD 1). b, Changes in GCaMP6s fluorescence (delta F/F) were recorded by fiber photometry in brain regions indicated during single odor investigation (top row). Responses are depicted as the mean of measurements made in indicated time intervals (0–30 seconds, 30–60 seconds, or each subsequent minute), n=6 mice, mean ± s.e.m, *p<.05, **p<.01, ***p<.001, statistical comparisons between food odor and water responses by two-way ANOVA with Dunnett’s multiple comparison. Food odor investigation time per 30 seconds (second row) during fiber photometry measurements above at time intervals (0–30 seconds, 30–60 seconds, or each subsequent minute), n=6 mice, mean ± s.e.m, lines: individual mice. Total investigation time for food odor, pheromones, and water during 5 minute fiber photometry test (third row), n=6 mice, mean ± s.e.m, lines with triangles: individual mice, *p<.05 by two-tailed Wilcoxon test (p water vs pheromone: .03; p pheromone vs food odor: .03 for ARC, PVT, PVH). Changes in GCaMP6s fluorescence (delta F/F) were recorded by fiber photometry during food consumption (FOOD 1 in timeline of a) after odor tests in the same mice (bottom row).
Extended Data Figure 7.
Extended Data Figure 7.. Odor preferences and food consumption patterns in knockout and rescue mice.
a, Timeline of two-choice behavioral assay. b, Investigation times for pheromones and food odors in fed (top) and fasted (bottom) knockout female mice indicated, n=10 mice, mean ± s.e.m, lines with triangles: individual mice, **p<.01 by two-tailed Wilcoxon test (from left to right, p fed: .08, .16, .24; p fasted: .002, .002, .85). c, Food intake prior to two-choice assay (FOOD 1 in timeline) of various knockout male (left) and female (right) mice (n=10 mice, mean ± s.e.m, triangles: individual mice). d, Cartoon (left) and preference indices (right) of NPY rescue experiments involving Npy-KO (control) and Agrp-ires-Cre; Npy-KO (NpyAGRP rescue) mice three weeks after AAV-lsl-Npy injection in the arcuate nucleus. Brain cartoon is based on published brain section images NPY immunohistochemistry is depicted in the figure inset. Preference indices are derived from data in Fig. 3d (n=12 mice, males and females, mean ± s.e.m, scale bar: 100 μm). e, Timeline of two-choice behavioral assay for receptor knockouts. f, Investigation times for pheromones and food odors in fasted knockout female mice indicated, n=10 mice, mean ± s.e.m, lines with triangles: individual mice, **p<.01 by two-tailed Wilcoxon test (p Npy1r-KO: .02; p Npy5r-KO: .77). g, Food intake after two-choice assay (FOOD 2 in timeline) of indicated knockout male and female mice (n=10 mice, mean ± s.e.m, triangles: individual mice).
Extended Data Figure 8.
Extended Data Figure 8.. Single odor preference assays in knockout mice.
a, Timeline of behavioral assay. b-e, Odor investigation times of fed Npy-KO (b), fasted Npy-KO (c), fed Npy5r-KO (d) and fasted Npy5r-KO (e) mice in single odor pairings with water, n=3 males and 3 females, mean ± s.e.m, lines with triangles: individual mice, *p<.05, **p<.01 by two-tailed Wilcoxon test (p values for b: .03, .001, c: .03, .03, d: .03, .03, e: .03, .03.
Extended Data Figure 9.
Extended Data Figure 9.. Food search behavior in knockout mice and analysis of Npy5r expression.
a, Latency to discover a food pellet buried in bedding was timed in fasted (left) and fed (right) mice indicated (n=3 males and 3 females, mean ± s.e.m, **p<.01, *p<.05 by Kruskal–Wallis test with Dunn’s multiple comparison). b, RNA in situ hybridization using Npy5r anti-sense and sense probes in coronal brain cryosections with PVT (left, dashed lines) and piriform cortex, scale bar: 500 μm. c, AGRP neuron projections to the PVT were visualized by immunohistochemistry for tdTomato in Agrp-ires-Cre mice injected in the arcuate nucleus with AAV-DIO-tdTomato, scale bar: 500 μm. Images in b and c are representative of three independent experiments involving different mice.
Extended Data Figure 10.
Extended Data Figure 10.. Controls for NPY injection into PVT.
a, Cartoon depicting injection site (top) and preference indices for experiments in Fig 3h and 3i (n=10 males and 10 females, mean + s.e.m.). b, Post-test food consumption (FOOD 1) for mice in Fig 3h and 3i, n=6 (3 males, 3 females), mean ± s.e.m, triangles: individual mice, *p<.05 by two-tailed Mann–Whitney U test (p NPY vs control: .015, p NPY5R agonist vs control: .04). c, Fasted Npy-KO mice were injected with low NPY levels (0.02 mg/kg) in the dorsal third ventricle, and after 15 minutes behavior was analyzed in the two-choice odor preference assay, n=6 (3 males, 3 females), mean ± s.e.m, lines with triangles: individual mice, p>.99 by two-tailed Wilcoxon test. d, Fasted Npy-KO mice were injected with high NPY levels (0.2 mg/kg) in the ventral third ventricle, and after 60 minutes behavior was analyzed in the two-choice odor preference assay, n=20 (10 males, 10 females), mean ± s.e.m, lines with triangles: individual mice, ***p<.001 by two-tailed Wilcoxon test. Brain cartoons are based on published brain section images.
Figure 1.
Figure 1.. Hunger and AGRP neuron activation promote attraction to food odors over pheromones.
a, Timeline and cartoon of two-choice behavioral assay. b, Investigation time (left) of fed and fasted male wild type mice to pheromones and food odors. Behavior of representative mice (right) where nose position is traced (black) over the 5 minute trial. c, Timeline (left) of two-choice assay involving AGRP neuron optogenetics, with location of optic fiber depicted in a cartoon (right) drawn based on published brain section images, scale bar: 200 μm. d, Investigation time of fed control and fed AGRP-ON male mice to pheromones and food odors. e, Preference indices for food odors over pheromones in animals indicated. (n=10 mice except e: n= 10 males and 10 females, mean ± s.e.m, lines with triangles: individual mice, **p<.01 by two-tailed Wilcoxon test).
Figure 2.
Figure 2.. Thalamic AGRP neuron projections promote food odor attraction.
a, Timeline of two-choice assay involving AGRP neuron optogenetic stimulation (blue bar), with optic fiber location depicted in a cartoon based on published brain section images. b, Investigation time of fed control (top) and fed AGRP-ON (bottom) mice to pheromones (P) and food odors (F) following optogenetic stimulation of AGRP axon terminals in brain regions indicated. c, Food consumption after the two-choice odor test (FOOD 2 in timeline) in fed control and fed AGRP-ON mice following illumination of brain regions indicated. d, Timeline (left), investigation times (middle) and preference index (right) for optogenetic inhibition experiments involving PVT illumination. (n: mice used for control, AGRP-ON in b-c: BNST: 9, 8; PVH: 7, 8; PVT: 6, 8; LH: 6, 9; CeA: 6, 6; MeA: 6, 11; PAG: 6, 7; PBN: 6, 6; ARC: 10,10, n in d: 6 mice, males and females, mean ± s.e.m, lines: individual mice, *p<.05, **p<.01, ***p<.001 by two-tailed Wilcoxon test except for c by two-tailed Mann–Whitney U test).
Figure 3.
Figure 3.. NPY and NPY5R are required for hunger-dependent food odor attraction.
a-b, Timeline (a) and odor investigation times (b) in fed and fasted knockout male mice indicated, n=10 mice, males and females, mean ± s.e.m, lines with triangles: individual mice. c-d, Timeline (c) and odor investigation times (d) in Npy-KO (control) and Agrp-ires-Cre; Npy-KO (NpyAGRP rescue) mice three weeks after AAV-DIO-Npy injection in the arcuate nucleus, n=12 mice, males and females, mean ± s.e.m, lines with triangles: individual mice. e-f, Investigation times (e) and odor preference indices (f) for fed and fasted knockout mice indicated, n=10 mice except preference index: n=10 males and 10 females, mean ± s.e.m, lines with triangles: individual mice). g-h, Timeline (g) and odor investigation times (h) for fasted Npy-KO mice injected in the PVT with artificial cerebrospinal fluid (aCSF) alone (−), NPY (0.02 mg/kg in aCSF) or NPY5R agonist ([CPP1–7, NPY19–23, Ala31, Aib32, Gln34]-hPancreatic Polypeptide, 0.002 mg/kg in aCSF), n=3 males and 3 females, mean ± s.e.m, lines with triangles: individual mice. i, Investigation times for fasted wild-type mice injected in the PVT with aCSF alone (−) or NPY5R antagonist (CGP71683, 0.2 mg/kg in aCSF), n=3 males and 3 females, mean ± s.e.m, lines with triangles: individual mice. *p<.05, **p<.01, ***p<.001 by two-tailed Wilcoxon test.

References

    1. Li Q & Liberles SD Aversion and Attraction through Olfaction. Curr Biol 25, R120–R129, doi: 10.1016/j.cub.2014.11.044 (2015). - DOI - PMC - PubMed
    1. Andermann ML & Lowell BB Toward a Wiring Diagram Understanding of Appetite Control. Neuron 95, 757–778, doi: 10.1016/j.neuron.2017.06.014 (2017). - DOI - PMC - PubMed
    1. Sternson SM Hypothalamic survival circuits: blueprints for purposive behaviors. Neuron 77, 810–824, doi:S0896–6273(13)00176–1 [pii] 10.1016/j.neuron.2013.02.018 (2013). - DOI - PMC - PubMed
    1. Rolls ET Taste, olfactory, and food reward value processing in the brain. Progress in neurobiology 127–128, 64–90, doi: 10.1016/j.pneurobio.2015.03.002 (2015). - DOI - PubMed
    1. Tong J et al. Ghrelin enhances olfactory sensitivity and exploratory sniffing in rodents and humans. J Neurosci 31, 5841–5846, doi: 10.1523/JNEUROSCI.5680-10.2011 (2011). - DOI - PMC - PubMed

Publication types